India's CAD May Decline to 0.5% of GDP Due to Lower Oil Prices and Gold Monetization
•
1 gostou•212 visualizações

High reliance on crude import and affection for gold has left India in Current Account Deficit

Recomendados
Recomendados
Mais conteúdo relacionado
Mais procurados
Mais procurados (19)
Destaque
Destaque (20)
Semelhante a India's CAD May Decline to 0.5% of GDP Due to Lower Oil Prices and Gold Monetization
Semelhante a India's CAD May Decline to 0.5% of GDP Due to Lower Oil Prices and Gold Monetization (20)
Mais de IndiaNotes.com
Mais de IndiaNotes.com (20)
Último
Último (20)
India's CAD May Decline to 0.5% of GDP Due to Lower Oil Prices and Gold Monetization
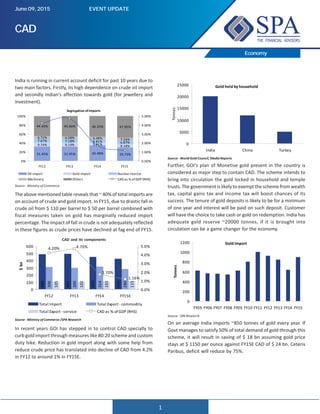
- 1. 1 Economy India is running in current account deficit for past 10 years due to two main factors. Firstly, its high dependence on crude oil import and secondly Indian's affection towards gold (for jewellery and investment). Segregation ofImports 31.45% 31.95% 34.48% 29.73% 9.74% 9.19% 5.91% 8.18% 7.67% 7.18% 6.81% 6.87% 6.72% 6.08% 6.48% 7.26% 44.43% 45.60% 46.33% 47.95% 0% 20% 40% 60% 80% 100% FY12 FY13 FY14 FY15 0.00% 1.00% 2.00% 3.00% 4.00% 5.00% Oil import Gold import Nuclear reactor Machinery Others CAD as % of GDP (RHS) Source - Ministry of Commerce The above mentioned table reveals that ~ 40% of total imports are on account of crude and gold import. In FY15, due to drastic fall in crude oil from $ 110 per barrel to $ 50 per barrel combined with fiscal measures taken on gold has marginally reduced import percentage. The impact of fall in crude is not adequately reflected in these figures as crude prices have declined at fag end of FY15. CAD and its components 489 491 450 419 306 300 280 105 102 103 115 314 4.70%4.20% 1.70% 1.16% 0 100 200 300 400 500 600 FY12 FY13 FY14 FY15E $bn 0.0% 1.0% 2.0% 3.0% 4.0% 5.0% Total Import Total Export - commodity Total Export -service CAD as % of GDP (RHS) Source-Ministry of Commerce/SPA Research In recent years GOI has stepped in to control CAD specially to curb gold import through measures like 80:20 scheme and custom duty hike. Reduction in gold import along with some help from reduce crude price has translated into decline of CAD from 4.2% in FY12 to around 1% in FY15E. CAD June 09, 2015 EVENT UPDATE Gold held by household 0 5000 10000 15000 20000 25000 India China Turkey Tonnes Source - World Gold Council, Media Reports Further, GOI's plan of Monetise gold present in the country is considered as major step to contain CAD. The scheme intends to bring into circulation the gold locked in household and temple trusts. The government is likely to exempt the scheme from wealth tax, capital gains tax and income tax will boost chances of its success. The tenure of gold deposits is likely to be for a minimum of one year and interest will be paid on such deposit. Customer will have the choice to take cash or gold on redemption. India has adequate gold reserve ~20000 tonnes, if it is brought into circulation can be a game changer for the economy. Gold Import 0 200 400 600 800 1000 1200 FY05 FY06 FY07 FY08 FY09 FY10 FY11 FY12 FY13 FY14 FY15 Tonnes Source - SPA Research On an average India imports ~850 tonnes of gold every year. If Govt manages to satisfy 50% of total demand of gold through this scheme, it will result in saving of $ 18 bn assuming gold price stays at $ 1150 per ounce against FY15E CAD of $ 24 bn. Ceteris Paribus, deficit will reduce by 75%.
- 2. 2 Economy Impact on CAD from import substitution of gold Gold price Savings (in $ bn) USD/oz If 50% demand is met If 100% demand is met through Import through Import 1150 16 34 1250 14 34 Crude Oil prices are down by ~41% & ~35% from April 2014 & October 2014 respectively and are expected to hover between $50-$70/barrel in the medium term. This is due to the fact that OPEC member countries are not taking production cuts fearing loss of market share and budgetary imbalance. Further, production from shale oil field will increase by 5 lacs barrel per day as crude moves above $65 per barrel. Impact on CAD from import and export of oil products Products Units Lacs MT Outflow USD in bn, if Indian crude Basket FY15 FY16E $60/bbl $70/bbl Import Crude 1894 1962 83.34 97.22 LPG 83 96 4.07 4.75 Petrol 4 6 0.26 0.30 HSD 1 2 0.08 0.10 Others 114 120 5.09 5.94 Outflow (in $ bn) 93 108 FY15 Import (in $ bn) 125 125 Savings (in $ bn) (A) 32 16 Export Naptha 68 67 3.52 4.11 Petrol 160 168 8.88 10.36 HSD 256 284 15.02 17.53 Others 153 162 8.57 10.00 Net Inflow (in $ bn) 36 42 FY15 Export (in $ bn) 47 47 Shortfall (in $ bn) (B) 11 5 Net Savings (in $ bn) (A-B) 21 11 % of GDP 0.94% 0.49% India is amongst the biggest beneficiary of decline in oil prices as ~75%-80% of India's oil consumption is met through imports. So any decline in oil prices will have positive impact on CAD. If crude price settles around $ 70 per barrel in FY16, India import bill from crude will reduce from $ 125 bn in FY15 to $ 108 bn in FY16E resulting in saving of $ 16 bn. However, export of petroleum products will also reduce from $ 47 bn in FY15 to $ 42 bn in FY16E, translating to reduction of $ 5 bn. Hence, current account deficit will reduce by $ 11 bn. (0.50% of FY16E GDP) Sensitivity Analysis of CAD (in $ bn) Gold monetization Scheme Indian crude basket $60/bbl $65/bbl $70/bbl 0% (3) (8) (13) 50% 13 8 3 100% 31 26 21 The above matrix highlights various scenarios and its impact on CAD which can vary in the range of 0.50% to surplus of 1.40% of FY16E GDP depending upon various scenarios. Assuming crude at $70/bbl and zero gold import substitution from gold monetization scheme, CAD is expected to be $13 bn or 0.59% of FY16E GDP from 1.16% in FY15E. At this level, financing CAD will not be a big issue with stable FDI of ~$20bn (0.9% of GDP), which will lend stability to rupee in case US federal reserve starts raising interest rate later this year.
- 3. 3 Economy For More Information Visit Us At : www.spasecurities.com Sharad Avasthi Head - Equity Research sharad.avasthi@spagroupindia.com Tel.: +91-33-4011 4800 Ext.832 SPA Securities Ltd: Mittal Court, A-Wing, 10th Floor, Nariman Point, Mumbai - 400 021, Tel. No. : +91-022-4289 5600, Fax: +91 (22) 2657 3708/9 Analyst Certification of Independence: The analyst(s) for this report certifies that all the views expressed in this report accurately reflect his or her personal views about the subject company(ies) or issuers and no part of his or hercompensationwas,isorwillbe,directlyorindirectlyrelatedtospecificrecommendationsorviewsexpressedinthisreport.Theresearchanalystsareboundbystringentinternalregulationsandalsolegalandstatutoryrequirements of the Securities and Exchange Board of India (hereinafter "SEBI") and the analysts' compensation are completely delinked from all the other companies and/or entities of SPASecurities Limited, and have no bearing whatsoever on anyrecommendationthattheyhavegivenintheResearchReport. DisclaimerandDisclosuresasrequiredunderSEBI(Research Analyst)Regulations,2014:SPASecuritiesLimited(hereinafterreferasSPASecurities)anditsaffiliatesareengagedininvestmentbanking,investment advisory, stock broking, institutional equities, Mutual Fund Distributor and insurance broking. SPASecurities is a SEBI registered securities broking Company having membership of NSE, BSE & MCX for Equity, Future & Option, Currency Derivatives segment and Wholesale Debt Market. The Company is focused primarily on providing securities broking services to institutional clients and is empanelled as an approved securities broker with all the major Nationalised, PrivateandCo-operativebanks,Corporatehouses,InsuranceCompanies,FinancialInstitutions,AssetManagementCompaniesandProvidentFundTrusts.Detailsofaffiliatesareavailableonourwebsitei.e.www.spasecurities.com. Weherebydeclarethatouractivitieswereneithersuspendednorwehavedefaultedwithanystockexchangeauthoritywithwhom weareregisteredinthelastfiveyears.WehavenotbeendebarredfromdoingbusinessbyanyStock Exchange/SEBI or any other authorities, nor has our certificate of registration been cancelled by SEBI at any point of time. GeneralDisclosures: ThisResearchReport(hereinaftercalled"report")hasbeenpreparedbySPASecuritiesandismeantforsoleusebytherecipientandnotforcirculation.ThisReportdoesnotconstituteapersonalrecommendation or take into account the particular investment objectives, financial situations, or needs of individual clients. The recommendations, if any, made herein are expression of views and/or opinions and should not be deemed or construed tobeneitheradviceforthepurposeofpurchaseorsaleofanysecurity,(asdefinedundersection2(h)ofsecuritiesContracts(Regulation)Act.1956,throughSPASecuritiesnoranysolicitationorofferingofanyinvestment/tradingopportunity onbehalfoftheissuer(s)oftherespectivesecurity(ies)referredtoherein.RecipientsofthisReportshouldrelyoninformation/dataarisingoutoftheirowninvestigations.Readersareadvisedtoseekindependentprofessionaladvice and arrive at an informed trading/investment decision before executing any trades or making any investments. ThisReporthasbeenpreparedonthebasisofpubliclyavailableinformation,internallydevelopeddataandothersourcesbelievedbySPASecuritiestobereliable,althoughitsaccuracyandcompletenesscannotbeguaranteed.Such information has not been independently verified and no guaranty, representation of warranty, express or implied, is made as to its accuracy, completeness or correctness.Any review, retransmission or any other use is prohibited. The information, opinions, views expressed in this Research Report are those of the research analyst as at the date of this Research Report which are subject to change and do not represent to be an authority on the subject. While we would endeavour to update the information herein on a reasonable basis, we are under no obligation to update the information.Also, there may be regulatory, compliance or other reasons that prevent us from doing so. Hence all such information and opinions are subject to change without notice. Our salespeople, traders, and other professionals may provide oral or written market commentary or trading strategies to our clients that reflect opinions that are contrary to the opinions expressed herein, and our proprietary trading and investing businesses may make investment decisions that may be inconsistent with the recommendations expressed herein. This Research Report should be read and relied upon at the sole discretion and risk of the recipient. If you are dissatisfied with the contents of this complimentary Research Report or with the terms of this Disclaimer, your sole and exclusive remedy is to stop using this Research Report. Neither SPASecurities nor its affiliates or their respective directors, employees, agents or representatives shall be responsible or liable in any manner, directly or indirectly, for the losses or the damages sustained due to the investments made or any action taken on basis of this report, including but not restricted to, fluctuation in the prices of shares and bonds, changes in the currency rates, diminution in the NAVs, reduction in the dividend or income, etc. Compensation of our ResearchAnalysts is not based on any specific merchant banking, investment banking or brokerage service transactions. SPASecurities may have issued other reports in the past that are inconsistent with and reachdifferentconclusionfromtheinformationpresentedinthisreport. SPASecurities, its affiliates and employees may, from time to time, effect or have effected an own account transaction in, or deal as principal or agent in or for the securities mentioned in this document.They may perform or seek to perform investment banking or other services for, or solicit investment banking or other business from, any company referred to in this report. TheusershouldconsulttheirownadvisorstodeterminethemeritsandrisksofinvestmentandalsoreadtheRiskDisclosureDocumentsforCapitalMarketsandDerivativeSegmentsasprescribedbySecuritiesandExchangeBoard of India before investing in the Indian Markets. A graph of daily closing prices of securities is available at www.nseindia.com and http://economictimes.indiatimes.com/markets/stocks/stock-quotes. (Choose a company from the list on the browser and select the "three years" icon in the price chart). SPASecurities plans to register itself as a Research Entity under the SEBI (ResearchAnalysts) Regulations, 2014. Disclaimers in respect of jurisdiction: This report is not directed to, or intended for distribution to or use by, any person or entity who is a citizen or resident or located in any locality, state, country or other jurisdiction where such distribution, publication, reproduction, availability or use would be contrary to law or regulation or what would subject SPASecurities or its affiliates to any registration or licensing requirement within such jurisdiction. If this report is inadvertentlysendorhasreachedanyindividualinsuchcountry,especially,USA,thesamemaybeignoredandbroughttotheattentionofthesender.Thisdocumentmaynotbereproduced,distributedorpublishedforanypurposes without prior written approval of SPASecurities. List of Associates as per SEBI (Research Analyst) Regulations, 2014 • SPAInsurance Broking Services limited Statements on ownership and material conflicts of interest, compensation - SPA and Associates Disclosure of interest statement Yes/No SPA Securities/its Affiliates/Analyst/his or her Relative financial interest in the company No SPA Securities/its Affiliates/Analyst/his or her Relative actual/beneficial ownership of more than 1% in subject company at the end of the month Immediately preceding the date of the publication of the research report or date of public appearance. No Investment banking relationship with the company covered No Any other material conflict of interest at the time of publishing the research report No Receipt of compensation by SPA Securities or its Affiliated Companies from the subject company covered for in the last twelve months: • Managing/co-managing public offering of securities • Investmentbanking/merchantbanking/brokerageservices • products or services other than those above • in connection with research report No Whether Research Analyst has served as an officer, director or employee of the subject company covered No Whether the Research Analyst or Research Entity has been engaged in market making activity of the Subject Company; No For statements on ownership and material conflicts of interest, compensation, etc. for individual Research Analyst(s), please refer to each specific research report. SPA CAPITAL SERVICES LIMITED Investment Advisory Services, AMFI Reg. No. ARN-0007 SPA CAPITAL ADVISORS LIMITED SEBI registered Category-1 Merchant Bankers SEBI Regn. No. INM000010825 SPA COMTRADE PRIVATE LIMITED Member of NCDEX & MCX. NCDEX TMID-00729, NCDEXFMCNo.NCDEX/TCM/CORP/0714 SPAINSURANCE BROKING SERVICES LTD Direct Broker for Life and General Insurance Broking IRDA Lic. Code No. DB053/03 SPA Securities Ltd SEBI Reg. Nos. NSE Cash INB231178238 NSE Future & Option INF231173238 NSE Currency Derivatives INE231178238 BSE Cash INB011178234 BSE Currency Derivatives INE011178234 MCX-SX Cash INB261178231 MCX-SX Future & Option INF261178231 MCX-SX Currency Derivatives INE261178238 Mutual Fund ARN 77388 CDSLDP IN-DP-CDSL-485-2008 NSDLDP IN-DP-NSDL-316-2009