Nirmal pi industries_03_aug15
•
1 gostou•206 visualizações

Hold PI Industries on strong Q1FY16 despite challenging environment #BrokerAdvice http://goo.gl/GoGtE9

Recomendados
Recomendados
Mais conteúdo relacionado
Mais procurados
Mais procurados (20)
Semelhante a Nirmal pi industries_03_aug15
Semelhante a Nirmal pi industries_03_aug15 (20)
Mais de IndiaNotes.com
Mais de IndiaNotes.com (20)
Último
Último (20)
Nirmal pi industries_03_aug15
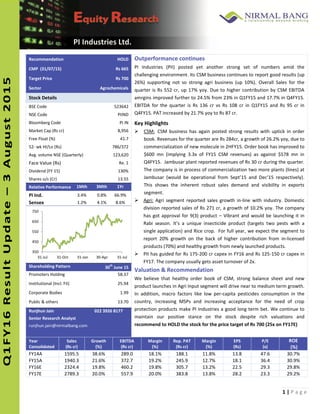
- 1. 1 | P a g e InitiatingCoverage PI Industries Ltd. 4 Recommendation HOLD Outperformance continues PI Industries (PII) posted yet another strong set of numbers amid the challenging environment. Its CSM business continues to report good results (up 26%) supporting not so strong agri business (up 10%). Overall Sales for the quarter is Rs 552 cr, up 17% yoy. Due to higher contribution by CSM EBITDA amrgins improved further to 24.5% from 23% in Q1FY15 and 17.7% in Q4FY15. EBITDA for the quarter is Rs 136 cr vs Rs 108 cr in Q1FY15 and Rs 95 cr in Q4FY15. PAT increased by 21.7% yoy to Rs 87 cr. Key Highlights CSM: CSM business has again posted strong results with uptick in order book. Revenues for the quarter are Rs 284cr, a growth of 26.2% yoy, due to commercialization of new molecule in 2HFY15. Order book has improved to $600 mn (implying 3.3x of FY15 CSM revenues) as against $578 mn in Q4FY15. Jambusar plant reported revenues of Rs 30 cr during the quarter. The company is in process of commercialization two more plants (lines) at Jambusar (would be operational from Sept’15 and Dec’15 respectively). This shows the inherent robust sales demand and visibility in exports segment. Agri: Agri segment reported sales growth in-line with industry. Domestic division reported sales of Rs 271 cr, a growth of 10.2% yoy. The company has got approval for 9(3) product – Vibrant and would be launching it in Rabi season. It’s a unique insecticide product (targets two pests with a single application) and Rice crop. For full year, we expect the segment to report 20% growth on the back of higher contribution from in-licensed products (70%) and healthy growth from newly launched products. PII has guided for Rs 175-200 cr capex in FY16 and Rs 125-150 cr capex in FY17. The company usually gets asset turnover of 2x. Valuation & Recommendation We believe that healthy order book of CSM, strong balance sheet and new product launches in Agri Input segment will drive near to medium term growth. In addition, macro factors like low per-capita pesticides consumption in the country, increasing MSPs and increasing acceptance for the need of crop protection products make PI Industries a good long term bet. We continue to maintain our positive stance on the stock despite rich valuations and recommend to HOLD the stock for the price target of Rs 700 (25x on FY17E) CMP (31/07/15) Rs 665 Target Price Rs 700 Sector Agrochemicals Stock Details BSE Code 523642 NSE Code PIIND Bloomberg Code PI IN Market Cap (Rs cr) 8,956 Free Float (%) 41.7 52- wk HI/Lo (Rs) 786/372 Avg. volume NSE (Quarterly) 123,620 Face Value (Rs) Re. 1 Dividend (FY 15) 130% Shares o/s (Cr) 13.55 Relative Performance 1Mth 3Mth 1Yr PI Ind. 3.4% 0.8% 66.9% Sensex 1.2% 4.1% 8.6% Shareholding Pattern 30 th June 15 Promoters Holding 58.37 Institutional (Incl. FII) 25.94 Corporate Bodies 1.99 Public & others 13.70 Runjhun Jain 022 3926 8177 Senior Research Analyst runjhun.jain@nirmalbang.com Year Consolidated Sales (Rs cr) Growth (%) EBITDA (Rs cr) Margin (%) Rep. PAT (Rs cr) Margin (%) EPS (Rs) P/E (x) ROE (%) FY14A 1595.5 38.6% 289.0 18.1% 188.1 11.8% 13.8 47.6 30.7% FY15A 1940.3 21.6% 372.7 19.2% 245.9 12.7% 18.1 36.4 30.9% FY16E 2324.4 19.8% 460.2 19.8% 305.7 13.2% 22.5 29.3 29.8% FY17E 2789.3 20.0% 557.9 20.0% 383.8 13.8% 28.2 23.3 29.2% 350 450 550 650 750 31-Jul 31-Oct 31-Jan 30-Apr 31-Jul
- 2. 2 | P a g e InitiatingCoverage PI Industries Ltd. Quarterly Result Table (Standalone) Particulars (Rs Cr) Q1FY16 Q1FY15 yoy Q4FY15 qoq Net Sales 554.8 471.2 17.7% 537.0 3.3% Cost of materials 306.0 247.3 23.8% 304.3 0.6% Purchase of goods 7.0 20.8 -66.4% 5.2 35.4% Employees Cost 40.2 31.7 26.8% 44.2 -9.1% Other Exps 65.8 63.5 3.7% 88.0 -25.2% EBITDA 135.8 108.0 25.8% 95.3 42.5% margins 24.5% 22.9% 17.7% Depreciation 11.5 9.8 20.1 EBIT 124.4 98.2 26.7% 75.2 65.3% Interest 2.7 1.8 54.0% 2.5 6.7% Other Income 4.5 3.6 25.0% 8.1 -44.4% Exchange loss/(gain) -4.1 -3.9 4.6% -4.8 -14.8% PBT 130.2 103.9 25.3% 85.6 52.2% Tax 42.9 32.2 33.4% 25.3 70.0% Tax rate 33.0% 31.0% 29.5% EO items 0.0 0.0 0.0 PAT reported 87.3 71.7 21.7% 60.3 44.7% PAT adjusted 87.3 71.7 21.7% 60.3 44.7% Equity Capital 13.5 13.5 13.5 FV 1.0 1.0 1.0 Adj EPS 6.4 5.3 21.7% 4.5 44.7%
- 3. 3 | P a g e InitiatingCoverage PI Industries Ltd. Financials P&L (Rs. Cr) FY14A FY15A FY16E FY17E Balance Sheet (Rs Cr) FY14A FY15A FY16E FY17E Net Sales 1595.5 1940.3 2324.4 2789.3 Share Capital 13.6 13.7 13.7 13.7 % change 38.6% 21.6% 19.8% 20.0% Reserves & Surplus 680.9 882.8 1140.5 1464.1 EBITDA 289.0 372.7 460.2 557.9 Net Worth 694.5 896.4 1154.2 1477.8 EBITDA margin (%) 18.1% 19.2% 19.8% 20.0% Net Deferred Tax Liab 43.7 36.9 36.9 36.9 Depn & Amort 31.6 49.8 47.0 53.9 Total Loans 115.9 81.5 60.5 48.5 Operating income 257.4 323.0 413.2 504.0 Other LT Liab 13.8 15.8 16.8 17.8 Interest 11.8 9.7 6.7 5.3 Trade Payables 291.6 353.8 376.4 451.7 Other Income 15.8 23.7 18.0 20.0 Provisions 32.4 41.3 44.3 47.3 PBT 261.4 355.2 424.6 518.7 Other CL 126.1 207.5 200.0 200.0 Tax 73.3 109.4 118.9 134.8 Total Liabilities 1317.9 1633.2 1889.1 2280.0 EO* 0.0 0.0 0.0 0.0 Net Fixed Assets 534.2 635.9 776.4 875.0 Reported PAT 188.1 245.9 305.7 383.8 Capital WIP 35.0 30.0 17.5 15.0 Adj PAT 188.1 245.9 305.7 383.8 Investments 0.5 0.5 0.5 0.5 Sh o/s - Diluted 13.6 13.6 13.6 13.6 Cash & Bank 43.8 34.1 98.0 195.2 Adj EPS 13.8 18.1 22.5 28.2 Inventories 318.8 378.2 433.1 519.7 EPS growth (%) 93.2% 30.7% 24.3% 25.6% Debtors 256.8 382.6 387.4 464.9 Cash EPS 16.1 21.7 25.9 32.2 Other CA 128.9 171.8 176.2 209.7 Quarterly - Standalone Sep-14 Dec-14 Mar-15 Jun-15 Total Assets 1317.9 1633.2 1889.1 2280.0 Net Sales 426.6 504.9 537.0 554.8 Cash Flow (Rs. Cr) FY14A FY15A FY16E FY17E EBITDA 72.6 94.1 95.3 135.8 Op CF before tax & WC 289.0 391.1 460.2 557.9 Dep & Amorz 9.6 9.7 20.1 11.5 Change in WC -3.3 -80.4 -44.9 -118.3 Operating Income 63.0 84.4 75.2 124.4 Tax -73.3 -109.4 -118.9 -134.8 Interest 1.9 3.6 2.5 2.7 CF from Operation 212.4 201.4 296.4 304.7 Other Inc. 5.5 5.9 8.1 4.5 Capex -62.1 -146.5 -175.0 -150.0 PBT 71.7 91.4 85.6 130.2 Inv & Oth Income 15.8 23.6 18.0 20.0 Tax 22.8 29.2 25.3 42.9 CF from Investing -46.3 -122.9 -157.0 -130.0 EO (less)/Add 0.0 0.0 0.0 0.0 Diviend Paid -31.9 -40.0 -48.0 -60.2 Reported PAT 49.0 62.2 60.3 87.3 Sh Capital & Premium 0.0 0.0 0.0 0.0 EPS (Rs.) 3.6 4.6 4.5 6.4 Interest Paid -11.8 -9.7 -6.7 -5.3 Ratios FY14A FY15A FY16E FY17E Loans -101.3 -34.4 -21.0 -12.0 EBITDA margin (%) 18.1% 19.2% 19.8% 20.0% Interest Paid & Others -5.2 -13.7 -6.7 -5.3 Adj PAT margin (%) 11.8% 12.7% 13.2% 13.8% CF from Financing -138.4 -88.1 -75.6 -77.5 PAT Growth (%) 93.2% 30.7% 24.3% 25.6% Net Chg. in Cash 27.6 -9.6 63.8 97.2 Price Earnings (x) 47.6 36.4 29.3 23.3 Cash at beginning 16.1 43.8 34.1 98.0 ROE (%) 30.7% 30.9% 29.8% 29.2% Cash at end 43.8 34.1 98.0 195.2 ROCE (%) 33.0% 36.1% 37.7% 36.8% Per Share Data FY14A FY15A FY16E FY17E Debt/Equity Ratio (x) 0.3 0.0 0.0 0.0 Adj EPS 13.8 18.1 22.5 28.2 Price/BV (x) 12.9 10.0 7.8 6.1 BV per share 51.0 65.9 84.8 108.6 EV / Sales 5.6 4.6 3.8 3.2 Cash per share 3.2 2.5 7.2 14.3 EV / EBITDA 31.1 24.2 19.4 15.8 Dividend per share 2.0 2.5 3.0 3.8
- 4. 4 | P a g e InitiatingCoverage PI Industries Ltd. Disclaimer: Nirmal Bang Securities Private Limited (hereinafter referred to as “NBSPL ”)is a registered Member of National Stock Exchange of India Limited, Bombay Stock Exchange Limited and MCX stock Exchange Limited. NBSPL is in the process of making an application with SEBI for registering as a Research Entity in terms of SEBI (Research Analyst) Regulations, 2014. NBSPL or its associates including its relatives/analyst do not hold any financial interest/beneficial ownership of more than 1% in the company covered by Analyst (in case any financial interest is held kindly disclose) NBSPL or its associates/analyst has not received any compensation from the company covered by Analyst during the past twelve months. NBSPL /analyst has not served as an officer, director or employee of company covered by Analyst and has not been engaged in market making activity of the company covered by Analyst. The views expressed are based solely on information available publicly and believed to be true. Investors are advised to independently evaluate the market conditions/risks involved before making any investment decision . This document, at best, represents Analyst opinion and is meant for general information only. NBSPL, its directors, officers or employees shall not in any way be responsible for the contents stated herein. NBSPL expressly disclaims any and all liabilities that may arise from information, errors or omissions in this connection. This document is not to be considered as an offer to sell or a solicitation to buy any securities Nirmal Bang Research (Division of Nirmal Bang Securities Pvt Ltd) B-2, 301/302, Marathon Innova, Opp. Peninsula Corporate Park Off. Ganpatrao Kadam Marg Lower Parel (W), Mumbai-400013 Board No : 91 22 3926 8000/8001 Fax : 022 3926 8010