Europe on corona for pdf
•
0 gostou•112 visualizações

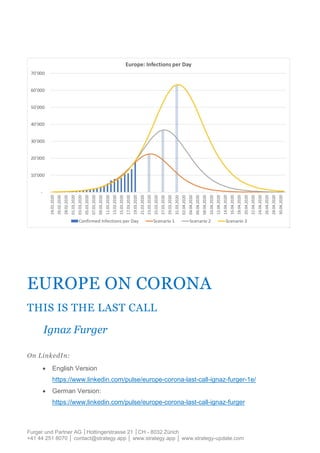
1) The author models the spread of COVID-19 in Europe using an S-curve model similar to how he modeled the spread in China. 2) Three scenarios are presented where Europe reaches a turning point in new infections by March 23rd, 27th, or 31st depending on how quickly measures take effect. 3) If measures are strictly followed and the turning point is reached by the end of April, new infections could be brought to zero with 12,000-25,000 total deaths across Europe.
![2
With consistent implementation of the measures, new infections
in Europe will be close to zero by the end of April.
The uncontrolled spread of the corona virus can be prevented if everyone
now consistently adheres to the measures and guidelines that have been
decided upon - which means nothing other than staying at home. The S-
curve models, with which I correctly modelled the overall trends in
infections and deaths in China starting on February 10, show that we in
Europe can still bring the number of new infections to zero as of the end of
April. The alternative is thousands of deaths, an uncertain future with
economic consequences that are still incalculable today.
It started in China
In December 2019 / January 2020 the first cases of a new, strange lung disease
appeared in Wuhan. Soon it turned out that it was more than just a few isolated
incidents, the disease spread. After China tried to hide the development in the
beginning, soon there was no way around recognizing the development as a
danger and fighting it rigorously. From a safe distance, we in Europe were able to
observe how the numbers were soaring and how drastic measures were decided
and implemented that were unimaginable for Europe at the time. Finally, in
February, the measures began to take effect, and as of February 5, the daily
incidence in China started to decrease. But at the same time, the first cases
began to appear in the USA, in Europe and in other Asian countries. While China
begun slowly to return to normality, more and more Europe came to the fore as
the center of the crisis.
The modelling of case numbers in China with the S-curve
Already at the beginning of February, when the numbers did not increase so much
anymore, I started to create the first S-curve models (logistics curve* [1]). The first
models from February 7th showed for China firstly a cumulative infection rate of
about 55,000 to 70,000 infections. In addition, it was shown that the wave would
be over by the end of February.](data:image/gif;base64,R0lGODlhAQABAIAAAAAAAP///yH5BAEAAAAALAAAAAABAAEAAAIBRAA7)
Recomendados
Recomendados
Mais conteúdo relacionado
Semelhante a Europe on corona for pdf
Semelhante a Europe on corona for pdf (20)
Último
Último (20)
Europe on corona for pdf
- 1. Furger und Partner AG │Hottingerstrasse 21 │CH - 8032 Zürich +41 44 251 8070 │ contact@strategy.app │ www.strategy.app │ www.strategy-update.com EUROPE ON CORONA THIS IS THE LAST CALL Ignaz Furger On LinkedIn: • English Version https://www.linkedin.com/pulse/europe-corona-last-call-ignaz-furger-1e/ • German Version: https://www.linkedin.com/pulse/europe-corona-last-call-ignaz-furger
- 2. 2 With consistent implementation of the measures, new infections in Europe will be close to zero by the end of April. The uncontrolled spread of the corona virus can be prevented if everyone now consistently adheres to the measures and guidelines that have been decided upon - which means nothing other than staying at home. The S- curve models, with which I correctly modelled the overall trends in infections and deaths in China starting on February 10, show that we in Europe can still bring the number of new infections to zero as of the end of April. The alternative is thousands of deaths, an uncertain future with economic consequences that are still incalculable today. It started in China In December 2019 / January 2020 the first cases of a new, strange lung disease appeared in Wuhan. Soon it turned out that it was more than just a few isolated incidents, the disease spread. After China tried to hide the development in the beginning, soon there was no way around recognizing the development as a danger and fighting it rigorously. From a safe distance, we in Europe were able to observe how the numbers were soaring and how drastic measures were decided and implemented that were unimaginable for Europe at the time. Finally, in February, the measures began to take effect, and as of February 5, the daily incidence in China started to decrease. But at the same time, the first cases began to appear in the USA, in Europe and in other Asian countries. While China begun slowly to return to normality, more and more Europe came to the fore as the center of the crisis. The modelling of case numbers in China with the S-curve Already at the beginning of February, when the numbers did not increase so much anymore, I started to create the first S-curve models (logistics curve* [1]). The first models from February 7th showed for China firstly a cumulative infection rate of about 55,000 to 70,000 infections. In addition, it was shown that the wave would be over by the end of February.
- 3. 3 On February 11, I posted the first article on Linkedin, with a total of 55,000 infections and 3,300 deaths. The model for the infections was adjusted on February 14th with a change in the counting method, resulting in just over 80,000 cases. Figure 1: First modeling of infections in China on February 11 Figure 2: Course of infections in China with adjustment on February 12: final value 80,000 The following picture shows the real results as of the end of February "Daily Cases":
- 4. 4 Figure 3: Daily infections in China - number of 12 February not smoothed backwards, beginning of March equal to zero as predicted by the model. This means that in China, the drastic measures taken have succeeded in restricting the habitat of the virus to such an extent that the spread of the virus has not only decreased, but was soon halted altogether. These measures have been consistently continued up to now, because as soon as a door is opened, or in other words as soon as the ecosystem is expanded again, the virus is given new habitat and will continue to spread according to a new S-curve. Subsequently it was found that the infections in Hubei started to decrease 12 days after the total lockdown. This means that the effect of the stringent measures arrived with a time delay. Prediction of deaths in China with the S-curve model In the same article of 11 February, the diagram with the deaths is shown:
- 5. 5 Figure 4: First model of deaths on 11 February: 3,300 cases The maximum was modelled with about 3,300 cases. As of 19 March, the total number of deaths according to China CDC Weekly is 3,245 cases I was writing then: "The model shows a saturation of the cumulative values at just over 3,000 cases. What is missing here is information on how long the deaths lived on average after infection. This could greatly improve the prognosis for the deaths. According to the available figures, the number of reported deaths is still rising, the maximum could be reached on February 16th with 125 new deaths". Effectively, the daily maximum on 15 February was given as 143 cases, which was a slight upward outlier smoothed by the neighboring numbers:
- 6. 6 Figure 5: Deaths per day approach zero at the end of February as predicted by the model Is Europe heading towards a catastrophe? Although cases have already appeared outside of China in January, the whole thing has long been viewed from a distance. It was not until the end of February at the beginning of March that it became clear that the spread was worldwide and many countries were really hit by the development: Figure 6: Europeans watch for a long time - and are then overrun, while the Chinese provinces have stopped the infections
- 7. 7 If we look at the development in Europe and compare it with China, we see the following: 1. Europe reacted much later with measures. As I showed in my posts on 18 and 19 March, the measures were only taken when the figures were much higher. 2. It has long been argued that measures like those in China could never be implemented in Europe, but what we are now seeing in Italy, France and Spain is comparable to Wuhan. 3. While there are no more cases in China, the number of infections in Europe is still rising. Apart from Italy, no other country is showing even the slightest sign of flattening That means we hit the wall with 200. Germany and Spain are already talking about an infestation of 20 - 30, even 70% or 80% in Madrid. In the USA, too, there is talk of 50% of the population being infected. With a mortality rate of several percent, that means thousands of deaths. A simple table shows how many deaths that would mean: (Model compiled by Peter Corless) Europe has a population of about 746 million (Wikipedia). If between 10% and 50% of the population is infected and we take the mortality rate of 1% to 3.5% as a basis, then we will be burying between 746,000 and 13 million fellow citizens in the next few months:
- 8. 8 Figure 7: Number of deaths in Europe - depending on infection rate and mortality rate: Example: if the infection-rate ist 30% and the mortality rate ist 1%, we will have 2.2 Mio deaths! Applied to Switzerland, we are talking about up to 150,000 deaths for the same parameters Figure 8: Table of deaths for Switzerland And Germany also gets its share: even with a death rate of 1% there are several 100 of thousands possible deaths! Figure 9: Table of deaths for Germany When experts set up models and show large numbers, which is always the case with exponential developments, this is one thing. But when politicians make statements on this in the form of: "we must expect that 20 - 30% or even 50% of the population will be infected", then this is not only stupid (because most of the
- 9. 9 time they don't even know what they are implicitly saying), it is but above all one thing: "irresponsible". THIS CANNOT BE … The development can still be stopped in Europe But what if the rigorous measures start to take effect now? What happens if we all follow the recommendations and really stay at home and the measures start to flatten the curve (#flattenthecurve)? Let's take the following arguments: On 15 March, almost all countries in Europe adopted very far-reaching measures, most of which are being implemented. The effect of these measures will now be felt with a time delay, i.e. the number of daily cases will only begin to decline after several days, possibly even weeks. On this basis, the S-curve can be used to present scenarios, and it does so in exactly the same way as I did for the development in China. What we are missing here, however, are the first signs of a flattening, as was the case in China in mid- February. But we can determine the turning point from another parameter, namely the delay between the measures and their effect. In Hubei, this period was 12 days. This gives the following basis for the models: 1. We take as a basis the figures that have been reported so far 2. We also assume that the measures will work and that new infections will be slowed down. On one hand, these have been officially imposed and are in some cases strictly monitored. On the other hand, people are also becoming increasingly frightened and are keeping their distance. When I walk through the city today, I ask myself where I could get infected. 3. We assume that the turning point will arrive after a similar delay like Hubei. So we can draft 3 scenarios and assume that the turning point will occur in 7, 11 or 15 days
- 10. 10 after the measures have been taken. For the sake of simplicity, we do it for Europe together. This leads us to the following results: • Scenario 1: The measures take effect relatively quickly and the turning point arrives on 23 March. The cumulative number stagnates at 390,000 cases • Scenario 2: The measures take effect as quickly as in Hubei/Wuhan and the turning point arrives on 27 March. The cumulative number stagnates at 700,000 cases. • Scenario 3: The measures take effect more slowly and the turning point arrives on 31 March. The cumulative number stagnates at 1,280,000 cases These scenarios are shown in the following two graphs: Figure 10: 3 scenarios cumulative cases with a turning point on 23, 27 and 31 March
- 11. 11 Figure 11: 3 scenarios daily cases with turning points on 23, 27 and 31 March We can derive the following statements 1. When the curve is flattened (#flattenthecurve), it does not become longer in time (as it is shown everywhere), but on the contrary, it shortens. This depends on the nature of things, namely on the law of diffusion described by the S-curve 2. If we implement the measures rigorously and thus achieve the desired effect, then we will in any case be able to push new infections to zero towards the end of April With a death rate of 1 - 2%, the worst case scenario will be 12,800 - 25,600 deaths across Europe. In relation to Switzerland, this means a few hundred and in Germany there would be about 1000 cases. The daily maximum rates also vary: if this figure is around 22,500 in the first scenario, it is over 60,000 in the third. Let’s look at the model from the Chinese province of Guangdong once again: The measures were already introduced in January and the cumulative number of infected persons stagnated at 1,350 cases. According to the WHO, the total number of deaths in Guangdong is 7 (in words "SEVEN").
- 12. 12 Figure 12: Daily infections Guangdong wit a maximum of 114 on Februar 3 Figure 13: Cumulative infections Guangdong with a total of 1.347 cases Conclusions We now have a very critical phase ahead of us. Only if we get through this together can we prepare for the phase afterwards. 1. By strictly following the measures, developments in Europe, Germany, Switzerland and all other countries can be brought under control.
- 13. 13 2. Due to the flattening, the curves are also shorter in time and the number of new infections can be stopped by the end of April. 3. The number of infections and deaths is halved with each gain of time of one week. And then we shouldn't wait again, but rather watch closely as the Chinese slowly revive their economy. And finally: follow the advice of Dr. Adriano Aguzzi and stay at home: https://www.youtube.com/watch?v=b0NFSxagQ64eature=emb_rel_pause or you or your loved ones will stay where you're put forever. ____________________ *[1] Logistic curve model=saturation/(1+EXP(-((LN81)/time duration)*(day- turnoverpt)))-base value *[2] Sources: https://github.com/CSSEGISandData/COVID-19 https://www.who.int/emergencies/diseases/novel-coronavirus- 2019/situation-reports/ http://weekly.chinacdc.cn/news/TrackingtheEpidemic.htm https://www.worldometers.info/coronavirus/ Literature: Therodore Modis: https://www.amazon.com/S-Shaped-Adventure- PREDICTIONS-Years-Later/dp/2970021692 Lockström: https://www.linkedin.com/pulse/forecasting- coronavirus-outbreak-dr-martin-lockstrom