
Recomendados
Recomendados
Mais conteúdo relacionado
Mais procurados
Destaque
Semelhante a Proficy machine edition trending
Semelhante a Proficy machine edition trending (20)
Mais de Iamtubalcain
Mais de Iamtubalcain (8)
Proficy machine edition trending
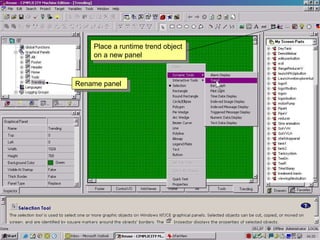
- 1. Place a runtime trend object on a new panel Rename panel
- 2. Drag and resize to suit
- 3. Assign variables to the pens
- 4. Fill in axis parameters
- 5. Give the trend object some data to display
- 6. The data begins to display each time the screen is opened ie: only Realtime data is shown
- 7. Create two new logging groups and set up logging strategy
- 8. Determine the frequency that data logs to TrendX
- 9. To configure large numbers of points undock the variables window
- 10. Bring up properties columns
- 11. Select the columns list
- 12. To tidy up the view, right-click and use the Remove column tab
- 13. Select your points by click and drag Just type T or F to make logging enabled TRUE or FALSE
- 14. Add the column Logging group settings group
- 15. Type any key to bring up the logging groups available
- 16. Again we can change as many points on view as we want
- 17. We have to download the logging data points and strategy so that we can use TrendX to open the log file
- 18. Launch TrendX
- 19. Once open we select a database
- 21. My folder is called Reuse
- 22. Open the database log file
- 23. Each of our logging groups can be expanded We add points to our charts by simply double clicking
- 24. We can create a number of different charts and in a variety of modes The points displayed show at the bottom and their associated values
- 25. With custom modes the chart indicator shows red
- 26. With realtime modes the chart indicator shows green We can zoom in and out and select cursor postion to see exact values
Notas do Editor
- We will now place a realtime trend chart on a new panel Select the Trend object icon from the toolbar or right-click and select from drop down menu
- Rename the panel and we will need to create a button to navigate to and from it.
- Assign variables to the pens on the Trend object
- Configure the axis settings
- Start your logic to give us some data to display
- We can now see the data, this is realtime data but there is no facility for historical analysis or printing the chart data So we need to create a chart that will give us this data and capability. We do this with the highly compacted data base tool TrendX
- Firstly create two new logging groups
- In the property inspector window assign their logging strategy
- As we did with alarms we will now configure our points by undocking the variables window to access large numbers of variables at one time for speed
- select the columns properties tab
- To add the columns with which we are concerned , select the columns list
- Right click on the columns window and use the hide columns tab to get rid of unnecessary columns
- Select the start point and drag across all the visible points you want to configure here we enable logging Type T or F for True or False
- Now logging is enabled we can assign logging groups for our points
- If you type any key, a drop down menu will appear with the logging groups that are available from which to select
- Change as many as you want
- To enable TrendX to assimilate this data we must download the configuration
- Start TrendX
- We must now add a database to TrendX
- Machine Edition has now created a database log based on our configuration information this is held in the project folder.
- Open your folder mine is called Reuse
- Open the database log file
- Now we can see all of the points that we configured for logging that are available to trend
- There are a variety of pre-configured modes that can be availed of, or we can create custom charts
- Custom modes are historical and are shown with a red marker
- Realtime charts are shown with a green indicator. These charts can be zoomed in to or our from for custom viewing