

Recomendados
Mais conteúdo relacionado
Mais procurados
Mais procurados (20)
Semelhante a D3_Gupta
Semelhante a D3_Gupta (20)
Mais de ICLEI_ITC
Último
Último (20)
D3_Gupta
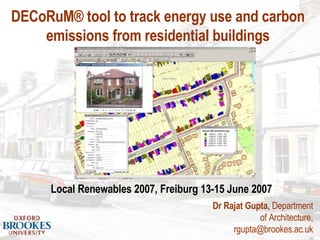
- 1. Dr Rajat Gupta, Department of Architecture, rgupta@brookes.ac.uk Local Renewables 2007, Freiburg 13-15 June 2007 DECoRuM® tool to track energy use and carbon emissions from residential buildings
- 2. Contents Overview of DECoRuM DECoRuM: estimating baseline energy and CO 2 emissions DECoRuM: predicting CO 2 emission reductions and cost-benefits Application of DECoRuM to a case study in Oxford Extrapolation to UK housing stock. Benefits and applications of DECoRuM. Background to the study
- 3. Background to the study
- 4. Buildings are a large part of the problem: decade on decade they use more energy UK carbon emissions in 2000: 150 MtC For industrialised countries such as UK, b uildings account for almost 50% of energy use and related CO 2 emissions that are driving climate change. Derived from DTI Energy Report 2000 Buildings 75 Million Tonnes (50%) 35 Million tonnes Industry 40 Million tonnes Transport Non-Domestic 35 Million tonnes Domestic 40 Million tonnes Existing domestic sector and CO 2 emissions
- 6. UK Kyoto commitment: First steps down a long road… Cut greenhouse gas emissions by 12.5% on 1990 levels, averaged over 2008-12. UK domestic goal: 20% cut in CO 2 by 2010 on 1990 levels Tougher targets ahead: In 2000, Royal Commission on Environmental Pollution called for 60% cut by 2050 and 80% by 2100 relative to 1998 levels. UK CO 2 emission reduction targets The Institute for Public Policy Research (IPPR) is demanding a 40% reduction in CO 2 emissions by 2020 and 90% by 2050 to avoid ‘dangerous climate change’.
- 8. It is within this context that the DECoRuM model has been developed!
- 10. DECoRuM: a next generation domestic energy model Capability to estimate baseline CO 2 emissions from individual dwellings using a locally-relevant approach, and well-established methodologies to ensure credibility. A mapping tool for representing domestic CO 2 emissions and reductions. This enables it to evaluate the potential for domestic CO 2 emission reductions from a whole range of measures on both the demand and supply sides of energy. An additional and unique feature of assessing the cost-benefits of individual CO 2 reduction measures and putting a financial cost to CO 2 emission reduction. Aggregates these to an urban scale – street, district or city level. DECoRuM provides local authorities and energy advisers with a tool to address the barrier of counting and reducing emissions locally.
- 11. Core methodologies used in DECoRuM Underlying physically-based energy models: BREDEM –12 linked to SAP 2001. Cost-benefit analysis approach
- 13. DECoRuM: estimating baseline energy and CO 2 emissions
- 14. Framework for baseline predictions DECoRuM baseline energy model estimates energy consumption and CO 2 emissions of individual dwellings as the basic component for calculation, and then aggregates these to an urban scale.
- 15. 95 input parameters for BREDEM-12 (SAP) calculation related to: - Site definition - Type of dwelling - Building fabric - Ventilation - Heating system - Hot water heating - Mechanical ventilation - Cooking - Lighting - Occupancy Techniques for data reduction: urban energy modelling 50 input data parameters common for all dwellings 5 input data parameters derived from built form 18 input data parameters derived from dwelling age 22 input data parameters collected for every dwelling Data reduction techniques in DECoRuM BREDEM-12 reference tables English House Condition Survey 2001 Standard dwelling configurations report Home energy survey forms Standard dwelling configurations report BREDEM-12 reference tables English House Condition Survey 2001 UK Building regulations Home energy survey forms Local authority records GIS urban map Walk-by surveys Sources of information 5 input parameters for every dwelling to estimate the solar potential Digital aerial image GIS urban map +
- 16. Data Reduction in DECoRuM Data to be collected by walk-by survey: 10 parameters (10% of total)
- 17. DECoRuM: predicting CO 2 emission reductions and cost-benefits
- 18. DECoRuM: 30 CO 2 reduction strategies Analysing CO 2 emission reductions rather than energy reduction is that it brings both demand and supply side measures into the same CO 2 equation
- 20. DECoRuM: cost-benefit methodology Helps to compare the cost of eliminating a tonne of CO 2 by using energy efficiency measures with low carbon technologies and solar energy systems .
- 21. Application of DECoRuM to a case study in Oxford
- 22. Oxford case study (318 dwellings) Aerial image of the case study area in North Oxford, UK This case study area was chosen because: Naturally fell within 2 enumeration districts. Number of dwellings in case study area was 318, comparable to other studies by researchers. Householders environmentally aware as realised from a survey done as part of the Oxford Solar Initiative project.
- 23. Oxford case study (318 dwellings) All the built forms and age groups of dwellings defined in DECoRuM, EHCS and OHCS, are present in the case study area.
- 24. Oxford case study: DECoRuM baseline energy & CO 2 model © Rajat Gupta, Oxford Brookes University, Oxford, UK.
- 25. Thematic map showing estimate of total annual energy consumption in the case study dwellings
- 26. Thematic map showing SAP ratings for dwellings in the case study
- 27. Thematic map of dwellings in the case study showing annual fuel costs
- 28. Oxford case study: Results from DECoRuM baseline energy model Mean energy use for a dwelling is 368kWh/m 2 /year CO 2 emissions are 80 kgCO 2 /m 2 /year. Average SAP rating was estimated as 45 Carbon Index: 3.4 Average annual fuel (running) cost per year per dwelling: £892
- 29. Results from DECoRuM baseline model: by built form and age groups Distribution of SAP rating, carbon index and running cost by age-band in case study area Breakdown of energy use, CO 2 emissions, running costs, SAP rating and carbon index as per built forms of dwellings in the case study
- 30. DECoRuM CO 2 reduction model: estimating solar potential 87% of the dwellings in the case study were suitable for installing either a SHW or a PV system or both.
- 31. Cost-effectiveness of various CO 2 reduction measures versus potential CO 2 savings in the Oxford case study area (Low capital cost scenario)
- 32. Potential for CO 2 emission reductions above 60% SHW and solar PV systems, individually installed cost £335 and £644/tonne of CO 2 saved in a low capital cost scenario. When applied in combination in package 3, the cost drops to £44 /tonne CO 2 saved. Emissions trading scheme: £15/tonne CO 2 Carbon capture and storage: £30-60/tonne CO 2 UK social cost of cutting a tonne of CO 2 : £19/tonne CO 2
- 33. Potential for CO 2 emission reductions from UK housing stock
- 34. DECoRuM: Key drivers Home Energy Conservation Act 30% improvement in energy efficiency in the domestic sector by 2007 relative to 1997 levels ~ 20% reduction in CO 2 emissions. Decent Homes Standard All social housing and vulnerable households in the private sector to be made decent by 2010: efficient heating and effective insulation. Fuel poverty To end fuel poverty by 2010 amongst vulnerable households. Home Information pack: EU Building Energy Directive Home Condition Report containing SAP energy rating and measures for improving energy efficiency. By 2007.
- 36. RIBA President’s medal for outstanding research 2006
- 37. DECoRuM is a next generation tool which is able to realistically count, cost and reduce CO 2 emissions locally. It extends the analysis for CO 2 emission reduction from buildings to make cities more sustainable to help avoid the worst impacts of climate change for the survival of the mankind itself. www.decorum-model.org.uk/
Notas do Editor
- About a new domestic energy model developed at Oxford Brookes University Reported in journals, newspapers, magazines, press releases and exhibitions. Generated a lot of interest from Carbon Trust and Universities when launched last year Presently it is being transformed into a commercial software for use.