Day 2 akm saiful islam, institute of water and flood management, arrcc-carissa workshop
•
0 gostou•165 visualizações

Presentation at ARRCC-CARISSA workshop 29 Jan 2019 to 31 Jan 2019

Recomendados
Recomendados
Mais conteúdo relacionado
Mais procurados
Mais procurados (20)
Semelhante a Day 2 akm saiful islam, institute of water and flood management, arrcc-carissa workshop
Semelhante a Day 2 akm saiful islam, institute of water and flood management, arrcc-carissa workshop (20)
Mais de ICIMOD
Mais de ICIMOD (20)
Último
Último (20)
Day 2 akm saiful islam, institute of water and flood management, arrcc-carissa workshop
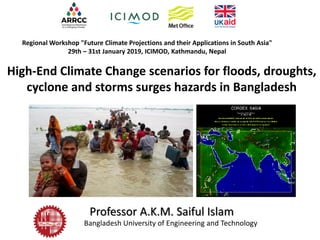
- 1. High-End Climate Change scenarios for floods, droughts, cyclone and storms surges hazards in Bangladesh Regional Workshop "Future Climate Projections and their Applications in South Asia" 29th – 31st January 2019, ICIMOD, Kathmandu, Nepal Professor A.K.M. Saiful Islam Bangladesh University of Engineering and Technology
- 2. Outline of the presentation • Recently Observed Extreme Climate Events in Bangladesh • Multi-model Ensemble Regional Climate Projections for Impact studies using CORDEX simulations • Changes in temperature and Rainfall Extremes in the future • Changes in Metrological Droughts in the future • Changes in Low and High Flows in GBM River Systems • Changes in Permanent Inundation due to Sea Level Rise • Changes in the Boro and Aman Rice yields in the future • Changes in the climate vulnerability of the coastal Bangladesh
- 3. Extreme Climate Events in Bangladesh during 2016-2018 Heatwave Flash Flood Lightening Cyclone Roanu Floods Flash Flood Cyclone Mora Landslide Lightening Floods 6-30 April 2016 12-13 May 201617-21 April 2016 17-23 May 2016 August 2016 13 June 20171-10 April 2017 20 June 201728-31 May 2017 August 2017 2016 2017 Lightning Blast Diseases in Rice Floods and bank erosion 2018 29 April -11 May 2018 September 2018 67 People Killed 90% Crop damaged 135 people died 168 peopled died 22 people died 3.9 M affected 57 People Killed 30% Crop damaged 57 people killed 24 People Killed 3.7M affected
- 4. Changes in climate extremes A temperature rise increases the probability of very warm days and decreases the probability of very cold days. Schematic diagram showing the effect of a mean temperature increase on extreme temperatures, for a normal temperature distribution. Figure from Solomon et al. (2007).
- 5. Average physical exposure to tropical cyclones assuming constant hazard (SREX, 2012)
- 6. Regional Climate Modeling (RCM) for Bangladesh over CORDEX: South Asia • GCM provides output more than 150km resolution which is not enough to capture mesoscale processes. • RCM daily output with horizontal resolution 50km are available for South Asia CORDEX domain. • Predictions are considered for extreme emission scenarios, RCP 8.5 • Climate output data have been bias corrected. Fahad et al. (2016)
- 7. RCM Projections using CIMP5 data GCM Ensemble RCM RCP8.5 (Year of Crossing) SWL 1.5 SWL 2 SWL 4 ACCESS1-0 r1i1p1 CSIRO-CCAM-1391M 2034 2046 2085 CCSM4 r1i1p1 CSIRO-CCAM-1391M 2016 2031 2079 CNRM-CM5 r1i1p1 SMHI-RCA4 2032 2046 2088 CNRM-CM5 r1i1p1 CSIRO-CCAM-1391M 2032 2046 2088 EC-EARTH r12i1p1 SMHI-RCA4 2019 2035 2083 CM5A-MR r1i1p1 SMHI-RCA4 2020 2034 2069 MIROC5 r1i1p1 SMHI-RCA4 2038 2052 - MPI-ESM-LR r1i1p1 CSIRO-CCAM-1391M 2021 2040 2083 MPI-ESM-LR r1i1p1 MPI-CSC-REMO2009 2021 2040 2083 MPI-ESM-LR r1i1p1 SMHI-RCA4 2021 2040 2083 GFDL-ESM2M r1i1p1 SMHI-RCA4 2040 2055 - Specific Warming Levels (SWLs) It is the mean annual global temperature increase by the end of the century related to preindustrial period (1880). Paris Agreement in 2015 emphasis on reducing GHGs to keep the increase of global mean temperature below 2C and effort should be made to reduce further to 1.5C with respect to pre-industrial period.
- 9. Performance of RCMs over the Region Comparison of annual cycle of precipitation between (a) observed data sets and raw GCM, (b) observed data sets and bias-corrected GCM and (c) observed data sets and bias-corrected RCM output for the historical period of 1971–2000. Comparison of annual cycle of temperature between (d) observed data sets and raw GCM, (e) observed data sets and bias-corrected GCM and (f) observed data sets and bias-corrected RCM output for the historical period of 1971–2000 Taylor diagrams showing correlation and standard deviations of precipitation and temperature between various observed gridded data sets and climate model outputs derived from 5 GCMs, 5 bias-corrected GCMs and 11 bias-corrected RCMs during the historical period of 1971–2000.
- 10. Fig. 6 Changes of annual precipitation from baseline (1981–2005) to 2050s (2041–2070) and 2080s (2071– 2100) observed in RCA4- EC-EARTH, REMO-MPI, CSIRO- CCSM4, CSIRO-CCNRM and CSIRO-CNRM-CM5 RCMs in RCP 4.5 scenario. Similar results, but in RCP 8.5 are also shown in k–t
- 12. Annual probability distribution functions for Rx1, Rx50, TXx and TNn indices for five regional climate model in three time periods of twenty-first Century. The solid line represents the observed period and dashed line represent mean of the five models in future time slices
- 13. Changes of Meteorological Droughts Drought Category SPI/SPEI Values No drought 0 ≤ Index Near normal/Mild drought -1.0 < Index < 0 Moderate drought -1.5 < Index ≤ -1.0 Severe drought -2.0 < Index ≤ -1.5 Extreme drought Index ≤ -2.0 Ensemble time series of SPI (left panel) and SPEI (right panel) at 12-month timescale averaged over the country. The red patch is the ensemble spread of the index values. Both SPI and SPEI are calculated relative to a baseline period of 1981 to 2010. Density distribution of SPI and SPEI values at 3 Month time-scale. Standard Precipitation Index (SPI) and Standard Precipitation and Evapotranspiration Index (SPEI)
- 14. How much area gets affected? Projected future median SPEI values over Bangladesh from 11 ensemble of Regional Climate Model (RCM).
- 15. Ganges-Brahmaputra-Megha Basins The GBM basins are located over India (64%), China (18%), Nepal (9%), Bangladesh (7%) and Bhutan (3%), and the elevation of the basins range from about 0 to above 8000 m above mean sea level (amsl).
- 17. SWAT Model Evaluation (R2, NSE, PBIAS, RSR) Statistical Indicators NSE R2 PBIAS RSR Ganges Calibration 0.80 0.81 12.47 0.44 Validation 0.77 0.79 15.52 0.49 Brahmapu tra Calibration 0.81 0.84 15.23 0.43 Validation 0.79 0.83 17.51 0.47 Meghna Calibration 0.85 0.86 5.33 0.38 Validation 0.83 0.85 5.84 0.41
- 18. Peak synchronization of GBM Rivers Changes in Q90 flow
- 19. Coastal modeling using Delft3D, SCHISM and FVCOM Coastal Models • DELFT3D- FLOW is a multi-dimensional (2D or 3D) hydrodynamic (and transport) simulation program which calculates unsteady flow and transport phenomena that result from tidal and meteorological forcing on a rectilinear or a curvilinear, boundary fitted grid. SCHISM (Semi-implicit Cross-scale Hydroscience Integrated System ModelModel domain and mesh. The riverine open boundaries (Hooghly, Ganges, Brahmaputra and Meghna) are indicated
- 21. Changes of Inundation due to SLR SLR (m) Inundated Area ( square km) Percent of Bangladesh Affected Population (million) 0.5 2000 1.6 2.5 1 3930 3.8 6 1.5 5300 5.1 8 SLR (m) Inundated Area (km2) % of inundation Area 0.5m 491 11.37 1m 1847 42.78 1.5m 2635 61.04 Inundation of the Sundarbans 0.5m SLR 1.0m SLR
- 22. Changing frequency of storm events, the number of events where sea level rose The number of high and very high sea level events each year for (a) west, (b) central and (c) east points in the delta region under the three scenarios tested (see Fig. 5a for point locations). A high event is defined as one that occurs ten times in the period 1991–2010 for that scenario, very high events have two occurrences in the same period.
- 23. Crop Modeling using DSSAT (Decision Support System for Agro-technology Transfer) • Extreme climate change will pose threat on various dimensions and Agriculture is one of them. • About 75% of our agricultural land is rice and it covers 28% of GDP. Real Name Brridhan29 Height 95 cm Duration of growth 160 days Grain quality Medium Yield (Kg/hectares) 7500 Developed on 1994 Developed by Bangladesh Rice Research Institute (BRRI)Hasan et al. (2016)
- 24. Changes of Boro yield at 1.5C, 2C, 4C SWLs Changes of Aman yield at 1.5C, 2C, 4C SWLs
- 25. Coastal vulnerability due to climate change
- 26. Changes in Climate Vulnerability 7 EXPOSURE INDICATORS5 SENSITIVITY INDICATORS 19 ADAPTIVE CAPACITY INDICATORS Present 2050
- 27. Key Messages • Extreme Rainfall over Bangladesh will be increased in the future. Chances of flash flood and land slides will be increased. • Projected changes in mean annual precipitation and temperature over the basins are larger in 4°C than in 1.5°C or 2°C. Changes are greater over Meghna basin than Brahmaputra basin. • Annual discharges of the Meghna basin change almost linearly with changes in the annual basin-averaged precipitation, while changes in discharges of the Brahmaputra basin are less sensitive to changes in precipitation. • Mean monthly flows are projected to increase the most in July (for Brahmaputra and Ganges) and in June (for Meghna). • Floods are likely to increase in both rivers as well as flood durations. • However, Hydrological droughts are likely to decrease in both rivers along with drought durations. • SLR rise will also cause permanent inundations in some parts of the coastal areas of Bangladesh. • Under high emission RCP 8.5 scenarios the mean yield of Boro rice will decrease about 10% during 2030’s and about 20% by 2100.
- 28. BUET Research Team • Prof. A.K.M. Saiful Islam • Prof. G.M. Tarekul Islam • Prof. Sujit Kumar Bala • Md. Alfi Hassan • Supria Paul • Mohan Kumar Das • Md. Jamal Uddin Khan • Shazzadur Rahman ▪ Mustasim Billah ▪ Abdur Rahman Tazkia ▪ Golam Rabbani Fahad ▪ Sudipta Adhikary ▪ Nasir Uddin Ahmed ▪ Khaled Mohammed ▪ Ahmed Sajid Hasan Thank you!