lg display-034220-Algorithm Investment Report
•
0 gostou•64 visualizações

lg display-034220-Algorithm Investment Report
![[Price for scheduled purchasing]
Arbitrarily made
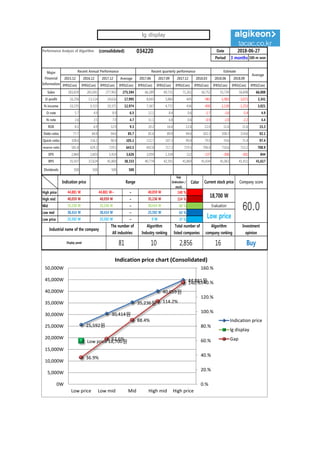
Algorithm stocks Trading Strategies (consolidated) 034220 Date
Period
Gap
(Indication /
stock)
Color
low price 25,592 W 25,592 W ~ 0 W 37 % -1,324,285 W -52
Low mid 30,414 W 30,414 W ~ 25,592 W 63 % -2,250,913 W -74
Mid 35,236 W 35,236 W ~ 30,414 W 88 % -3,177,542 W -90
High mid 40,059 W 40,059 W ~ 35,236 W 114 % -4,104,171 W All selling
Suggested Purchase
Amount 3,593,297 W
Number of stocks
purchased 192
Indication price Range Buying / Selling Buying / Selling [Stocks]
High price 44,881 W 44,881 W~ ~ 40,059 W 140 % -5,030,800 W All selling
2018-06-27
3 months
Current stock price Evaluation
Stock price rise
probability score
Investment opinion Prospective purchase amount
18,700 W Low price 58.8 Buy 6,000,000 W
44.1 41.2 42.8 34.2 43.2 52.2
2018.01.25 2018.02.26 2018.03.27 2018.04.24 2018.05.25 2018.06.26
Stock price rise
probability score
A Sector 48.2 47.4 43.9 47.0 48.2 47.7
58.8B Sector 40.0 35.0 41.7 47.0 38.3 56.7
Total average
2018.03.27 2018.04.24 2018.05.25 2018.06.26
Total of
increase rate
Total score
A Sector -2 % -8 % 7 % 2 % -1 %
2 % 49.7B Sector -14 % 16 % 11 % -23 % 32 %
Total average -7 % 4 % -25 % 21 % 17 %
2018.02.26
48 47
44
47 48 48
40
35
42
47
38
57
44
41 43
34
43
52
0
10
20
30
40
50
60
2018.01.25 2018.02.26 2018.03.27 2018.04.24 2018.05.25 2018.06.26
Stock price rise probability score
A sector
B sector
Total average
-2%
-8%
7%
2%
-1%
-14%
16%
11%
-23%
32%
-7%
4%
-25%
21%
17%
-30%
-20%
-10%
0%
10%
20%
30%
40%
2018.02.26 2018.03.27 2018.04.24 2018.05.25 2018.06.26
Increase rate of stock price rise
A sector
B sector
Total average
lg display](data:image/gif;base64,R0lGODlhAQABAIAAAAAAAP///yH5BAEAAAAALAAAAAABAAEAAAIBRAA7)
Recomendados
Recomendados
Mais conteúdo relacionado
Mais procurados
Mais procurados (20)
Semelhante a lg display-034220-Algorithm Investment Report
Semelhante a lg display-034220-Algorithm Investment Report (20)
Mais de 알고리즘 기업분석 컨설팅-알기컨,algikeon
Mais de 알고리즘 기업분석 컨설팅-알기컨,algikeon (20)
Último
Último (20)
lg display-034220-Algorithm Investment Report
- 1. Performance Analysis of Algorithm (consolidated) 034220 Date Period 3 months 100-m won 2015.12 2016.12 2017.12 Average 2017.06 2017.09 2017.12 2018.03 2018.06 2018.09 IFRS(Con) IFRS(Con) IFRS(Con) IFRS(Con) IFRS(Con) IFRS(Con) IFRS(Con) IFRS(Con) IFRS(Con) IFRS(Con) IFRS(Con) Sales 283,839 265,041 277,902 275,594 66,289 69,731 71,261 56,752 55,739 56,698 66,008 O-profit 16,256 13,114 24,616 17,995 8,043 5,860 445 -983 -1,983 -3,073 3,341 N-income 10,235 9,315 19,371 12,974 7,367 4,772 436 -490 -1,130 -1,253 3,021 O-rate 5.7 4.9 8.9 6.5 12.1 8.4 0.6 -1.7 -3.6 -5.4 4.9 N-rate 3.6 3.5 7.0 4.7 11.1 6.8 0.6 -0.9 -2.0 -2.2 4.4 ROE 8.1 6.9 12.9 9.3 20.2 16.4 12.6 12.0 11.6 11.6 15.3 Debt-ratio 77.7 84.8 94.6 85.7 81.6 89.8 94.6 102.3 108.3 114.6 92.1 Quick-ratio 108.6 116.1 90.4 105.1 112.7 107.3 90.4 79.0 74.6 71.4 97.4 reserve-ratio 581.8 629.1 719.5 643.5 692.8 717.3 719.5 706.0 710.6 715.2 708.9 EPS 2,860 2,603 5,414 3,626 2,059 1,334 122 -137 -306 -301 844 BPS 35,507 37,624 41,869 38,333 40,774 42,391 41,869 41,434 41,063 41,411 41,617 Dividends 500 500 500 500 Major Financial Information Recent Annual Performance Recent quarterly performance Estimate Average 2018-06-27 Gap (Indication / stock) Color High price ~ 140 % High mid ~ 114 % Mid ~ 88 % Low mid ~ 63 % Low price ~ 37 % Buy 25,592 W 25,592 W 0 W Industrial name of the company The number of All industries Algorithm Industry ranking Total number of listed companies Algorithm company ranking Investment opinion Display panel 81 10 2,856 16 40,059 W 40,059 W 35,236 W 35,236 W 35,236 W 30,414 W Evaluation 44,881 W 44,881 W~ 40,059 W 18,700 W 60.030,414 W 30,414 W 25,592 W Low price Indication price Range Current stock price Company score 25,592원 30,414원 35,236원 40,059원 44,881원 Low price 18,700원 36.9% 62.6% 88.4% 114.2% 140.% 0.% 20.% 40.% 60.% 80.% 100.% 120.% 140.% 160.% 0W 5,000W 10,000W 15,000W 20,000W 25,000W 30,000W 35,000W 40,000W 45,000W 50,000W Low price Low mid Mid High mid High price Indication price chart (Consolidated) Indication price lg display Gap lg display
- 2. [Price for scheduled purchasing] Arbitrarily made Algorithm stocks Trading Strategies (consolidated) 034220 Date Period Gap (Indication / stock) Color low price 25,592 W 25,592 W ~ 0 W 37 % -1,324,285 W -52 Low mid 30,414 W 30,414 W ~ 25,592 W 63 % -2,250,913 W -74 Mid 35,236 W 35,236 W ~ 30,414 W 88 % -3,177,542 W -90 High mid 40,059 W 40,059 W ~ 35,236 W 114 % -4,104,171 W All selling Suggested Purchase Amount 3,593,297 W Number of stocks purchased 192 Indication price Range Buying / Selling Buying / Selling [Stocks] High price 44,881 W 44,881 W~ ~ 40,059 W 140 % -5,030,800 W All selling 2018-06-27 3 months Current stock price Evaluation Stock price rise probability score Investment opinion Prospective purchase amount 18,700 W Low price 58.8 Buy 6,000,000 W 44.1 41.2 42.8 34.2 43.2 52.2 2018.01.25 2018.02.26 2018.03.27 2018.04.24 2018.05.25 2018.06.26 Stock price rise probability score A Sector 48.2 47.4 43.9 47.0 48.2 47.7 58.8B Sector 40.0 35.0 41.7 47.0 38.3 56.7 Total average 2018.03.27 2018.04.24 2018.05.25 2018.06.26 Total of increase rate Total score A Sector -2 % -8 % 7 % 2 % -1 % 2 % 49.7B Sector -14 % 16 % 11 % -23 % 32 % Total average -7 % 4 % -25 % 21 % 17 % 2018.02.26 48 47 44 47 48 48 40 35 42 47 38 57 44 41 43 34 43 52 0 10 20 30 40 50 60 2018.01.25 2018.02.26 2018.03.27 2018.04.24 2018.05.25 2018.06.26 Stock price rise probability score A sector B sector Total average -2% -8% 7% 2% -1% -14% 16% 11% -23% 32% -7% 4% -25% 21% 17% -30% -20% -10% 0% 10% 20% 30% 40% 2018.02.26 2018.03.27 2018.04.24 2018.05.25 2018.06.26 Increase rate of stock price rise A sector B sector Total average lg display
- 3. 정보와 완전 정보 결 투자판단 있습니 위배 무단으 숙지하 Compliance notice ① The information provided by The Algorithm Company Analysis Consulting is obtained through reliable data and information and The Algorithm Company Analysis Program (TACAP), but its accuracy or completeness are not guaranteed. Furthermore, it may change over time.Therefore, we are not legally responsible for the results of the data provided by The Algorithm Company Analysis Consulting because of information errors or omissions. ② The Algorithm Company Analysis Consulting and all the information provided on it site are reference materials for investment decisions and the final responsibility of investment is up to users utilizing this information. ③ The Algorithm Company Analysis Consulting and its site do not do anything that violates the related laws such as discretionary transaction. ④ Users can not reallocate and recycle the information provided by The Algorithm Company Analysis Consulting firm let alone the information provided by its Site. ⑤ Be sure to know about application period of this algorithm analysis report in order to improve its accuracy. Tel : 070 - 4667 - 5009 Email : tacac@tacac.co.kr Homepage : tacac.co.kr Blog : tacac.blog.me SERVICES M&A, IPO, RECOVER, CORPORATE RESTRUCTURING, MANAGEMENT OF TECHNOLOGY, BUSINESS STRATEGY, FAMILY BUSINESS Request : http://tacac.co.kr/?page_id=1374 ① Consulting The Algori accuracy o change ove results of Consulting ② informatio investmen up ③ do anythin transaction ④ The Algori informatio ⑤ analysis re