hyungdai e&c-000720-Algorithm Investment Report
•
0 gostou•87 visualizações

hyungdai e&c-000720-Algorithm Investment Report
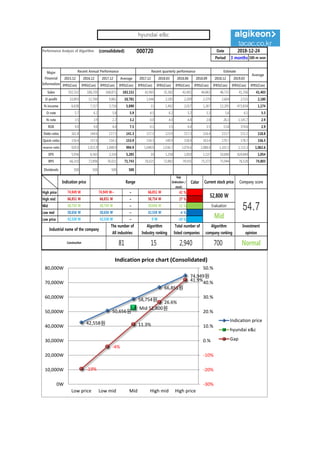
![[Price for scheduled purchasing]
Arbitrarily made
Algorithm stocks Trading Strategies (consolidated) 000720 Date
Period
Gap
(Indication /
stock)
Color
2018-12-24
3 months
Current stock price Evaluation
Stock price rise
probability score
Investment opinion Prospective purchase amount
52,800 W Mid 56.5 Normal 6,000,000 W
Suggested Purchase
Amount 2,654,306 W
Number of stocks
purchased 50
Indication price Range Buying / Selling Buying / Selling [Stocks]
High price 74,949 W 74,949 W~ ~ 66,851 W 42 % -1,113,452 W -15
High mid 66,851 W 66,851 W ~ 58,754 W 27 % -706,376 W -11
Mid 58,754 W 58,754 W ~ 50,656 W 11 % -299,299 W -5
Low mid 50,656 W 50,656 W ~ 42,558 W -4 % 107,777 W 2
low price 42,558 W 42,558 W ~ 0 W -19 % 514,854 W 12
Stock price rise
probability score
A Sector 48.0 50.6 51.7 49.2 48.3 49.8
56.5B Sector 36.7 44.6 42.5 49.2 27.9 37.5
Total average
2018.07.26 2018.08.24 2018.09.21 2018.10.26 2018.11.23 2018.12.21
42.3 47.6 47.1 29.6 38.1 43.7
22 % 13 %
2018.08.24 2018.09.21 2018.10.26 2018.11.23 2018.12.21
Total of
increase rate
Total score
A Sector 5 % 2 % -5 % -2 % 3 %
-3 % 49.0B Sector 18 % -5 % 14 % -76 % 26 %
Total average 11 % -1 % -59 %
48 51 52 49 48 50
37
45 43
49
28
38
42
48 47
30
38
44
0
10
20
30
40
50
60
2018.07.26 2018.08.24 2018.09.21 2018.10.26 2018.11.23 2018.12.21
Stock price rise probability score
A sector
B sector
Total average
5% 2%
-5% -2% 3%
18%
-5%
14%
-76%
26%
11%
-1%
-59%
22%
13%
-100%
-80%
-60%
-40%
-20%
0%
20%
40%
2018.08.24 2018.09.21 2018.10.26 2018.11.23 2018.12.21
Increase rate of stock price rise
A sector
B sector
Total average
hyundai e&c](data:image/gif;base64,R0lGODlhAQABAIAAAAAAAP///yH5BAEAAAAALAAAAAABAAEAAAIBRAA7)
Recomendados
Recomendados
Mais conteúdo relacionado
Mais procurados
Mais procurados (20)
Semelhante a hyungdai e&c-000720-Algorithm Investment Report
Semelhante a hyungdai e&c-000720-Algorithm Investment Report (20)
Mais de 알고리즘 기업분석 컨설팅-알기컨,algikeon
Mais de 알고리즘 기업분석 컨설팅-알기컨,algikeon (20)
Último
Último (20)
hyungdai e&c-000720-Algorithm Investment Report
- 1. Performance Analysis of Algorithm (consolidated) 000720 Date Period 3 months 100-m won 2015.12 2016.12 2017.12 Average 2017.12 2018.03 2018.06 2018.09 2018.12 2019.03 IFRS(Con) IFRS(Con) IFRS(Con) IFRS(Con) IFRS(Con) IFRS(Con) IFRS(Con) IFRS(Con) IFRS(Con) IFRS(Con) IFRS(Con) Sales 192,332 188,250 168,871 183,151 42,965 35,382 42,401 44,863 46,733 41,356 41,403 O-profit 10,893 11,590 9,861 10,781 1,946 2,185 2,209 2,379 2,604 2,515 2,180 N-income 6,638 7,317 3,716 5,890 11 1,402 2,017 1,267 12,205 473,834 1,174 O-rate 5.7 6.2 5.8 5.9 4.5 6.2 5.2 5.3 5.6 6.1 5.3 N-rate 3.5 3.9 2.2 3.2 0.0 4.0 4.8 2.8 26.1 1,145.7 2.9 ROE 9.0 9.0 4.4 7.5 0.1 3.5 4.4 3.5 13.8 374.6 2.9 Debt-ratio 161.8 144.6 117.5 141.3 117.5 123.9 117.3 116.4 113.7 111.1 118.8 Quick-ratio 150.4 157.0 154.3 153.9 154.3 149.9 158.4 163.4 170.7 178.7 156.5 reserve-ratio 920.0 1,015.9 1,048.9 994.9 1,048.9 1,036.7 1,076.6 1,088.0 1,101.5 1,115.3 1,062.6 EPS 5,956 6,565 3,334 5,285 10 1,258 1,810 1,137 10,690 424,844 1,054 BPS 66,310 72,896 76,021 71,743 76,021 72,882 74,935 75,373 75,944 76,520 74,803 Dividends 500 500 500 500 2018-12-24 Major Financial Information Recent Annual Performance Recent quarterly performance Estimate Average Gap (Indication / stock) Color High price ~ 42 % High mid ~ 27 % Mid ~ 11 % Low mid ~ -4 % Low price ~ -19 % Indication price Range Current stock price Company score 66,851 W 66,851 W 58,754 W 58,754 W 58,754 W 50,656 W Evaluation 74,949 W 74,949 W~ 66,851 W 52,800 W 54.750,656 W 50,656 W 42,558 W Mid Normal 42,558 W 42,558 W 0 W Industrial name of the company The number of All industries Algorithm Industry ranking Total number of listed companies Algorithm company ranking Investment opinion Construction 81 15 2,940 700 42,558원 50,656원 58,754원 66,851원 74,949원 Mid 52,800원 -19% -4% 11.3% 26.6% 41.9% -30% -20% -10% 0.% 10.% 20.% 30.% 40.% 50.% 0W 10,000W 20,000W 30,000W 40,000W 50,000W 60,000W 70,000W 80,000W Low price Low mid Mid High mid High price Indication price chart (Consolidated) Indication price hyundai e&c Gap hyundai e&c
- 2. [Price for scheduled purchasing] Arbitrarily made Algorithm stocks Trading Strategies (consolidated) 000720 Date Period Gap (Indication / stock) Color 2018-12-24 3 months Current stock price Evaluation Stock price rise probability score Investment opinion Prospective purchase amount 52,800 W Mid 56.5 Normal 6,000,000 W Suggested Purchase Amount 2,654,306 W Number of stocks purchased 50 Indication price Range Buying / Selling Buying / Selling [Stocks] High price 74,949 W 74,949 W~ ~ 66,851 W 42 % -1,113,452 W -15 High mid 66,851 W 66,851 W ~ 58,754 W 27 % -706,376 W -11 Mid 58,754 W 58,754 W ~ 50,656 W 11 % -299,299 W -5 Low mid 50,656 W 50,656 W ~ 42,558 W -4 % 107,777 W 2 low price 42,558 W 42,558 W ~ 0 W -19 % 514,854 W 12 Stock price rise probability score A Sector 48.0 50.6 51.7 49.2 48.3 49.8 56.5B Sector 36.7 44.6 42.5 49.2 27.9 37.5 Total average 2018.07.26 2018.08.24 2018.09.21 2018.10.26 2018.11.23 2018.12.21 42.3 47.6 47.1 29.6 38.1 43.7 22 % 13 % 2018.08.24 2018.09.21 2018.10.26 2018.11.23 2018.12.21 Total of increase rate Total score A Sector 5 % 2 % -5 % -2 % 3 % -3 % 49.0B Sector 18 % -5 % 14 % -76 % 26 % Total average 11 % -1 % -59 % 48 51 52 49 48 50 37 45 43 49 28 38 42 48 47 30 38 44 0 10 20 30 40 50 60 2018.07.26 2018.08.24 2018.09.21 2018.10.26 2018.11.23 2018.12.21 Stock price rise probability score A sector B sector Total average 5% 2% -5% -2% 3% 18% -5% 14% -76% 26% 11% -1% -59% 22% 13% -100% -80% -60% -40% -20% 0% 20% 40% 2018.08.24 2018.09.21 2018.10.26 2018.11.23 2018.12.21 Increase rate of stock price rise A sector B sector Total average hyundai e&c
- 3. 정보와 완전 정보 결 투자판단 있습니 위배 무단으 숙지하 Compliance notice ① The information provided by The Algorithm Company Analysis Consulting is obtained through reliable data and information and The Algorithm Company Analysis Program (TACAP), but its accuracy or completeness are not guaranteed. Furthermore, it may change over time.Therefore, we are not legally responsible for the results of the data provided by The Algorithm Company Analysis Consulting because of information errors or omissions. ② The Algorithm Company Analysis Consulting and all the information provided on it site are reference materials for investment decisions and the final responsibility of investment is up to users utilizing this information. ③ The Algorithm Company Analysis Consulting and its site do not do anything that violates the related laws such as discretionary transaction. ④ Users can not reallocate and recycle the information provided by The Algorithm Company Analysis Consulting firm let alone the information provided by its Site. ⑤ Be sure to know about application period of this algorithm analysis report in order to improve its accuracy. Tel : 070 - 4667 - 5009 Email : tacac@tacac.co.kr Homepage : tacac.co.kr Blog : tacac.blog.me SERVICES EDUCATION, M&A, IPO, RECOVER, CORPORATE RESTRUCTURING, MANAGEMENT OF TECHNOLOGY, BUSINESS STRATEGY, FAMILY BUSINESS Request : http://tacac.co.kr/?page_id=1374 ① Consulting The Algori accuracy o change ove results of Consulting ② informatio investmen up ③ do anythin transaction ④ The Algori informatio ⑤ analysis re