Nested loop join technique
•Transferir como DOCX, PDF•
0 gostou•720 visualizações

Explanation and comparison of NL join technique in Oracle 10g

Recomendados
Mais conteúdo relacionado
Mais de Heribertus Bramundito
Último
Último (20)
Nested loop join technique
- 1. Nested Loop Join Technique – Part 1 (Table Pre-fetching) Background Table Pre-fetching has been introduced in Oracle 9i and is enabled by default. This new approach gives some improvement in Nested Loop Join (NLJ) by reducing logical IO of the query. In 10g we can control this new behavior by setting a database parameter (_table_lookup_prefetch_size). It’s annoying actually but another improvement has been introduced in 11g and in that version, we have full control of this behavior simply by using SQL hints. The objective of this test cases is to see all those behavior (normal, table pre-fetching and also the newest table batching – in 11g) when we have NLJ in our query. I am going to compare the performance of unique and non-unique Index in sorted and unsorted data, so in total we will have 4 test cases per batch. In this Part 1 I am going to run the test cases in 10g only (for normal and table pre-fetching technique) and I am planning to rerun the test cases against 11g in Part 2. I take Randolf’s exercise as my reference(http://oracle-randolf.blogspot.com/2011/07/logical-ioevolution-part-1-baseline.html), please go to his blog and read the articles, it’s very explainable but I might miss some parts as well. So if you have time to read, then we can share the knowledge together For the monitor purpose (statistics/ wait event/ etc), I am going to use Snapper version 4 by TanelPoder (http://blog.tanelpoder.com/2013/02/18/manual-before-and-after-snapshot-support-in-snapper-v4/). Just go to his blog as well, this guy is a genius and he has a lot of good stuffs. In his book (Cost Based Oracle Fundamental), Jonathan Lewis has observed about table pre-fetching technique as well. This is what he has explained in the book.
- 2. Just to recap, the normal NLJ pseudo-code will be looked as below: begin for r_outer in (select rows from outer_table where <filter>) loop for r_inner in (select rows from inner_table where <matched the join + filter>) loop output the selected columns from both tables end loop end loop end; With above code, output from inner table will be sorted based on outer table.In the other side, Oracle do not guarantee that the output will be sorted based on outer table. I am not too interested in testing this theory, but you can see one example in this blog http://dioncho.wordpress.com/2010/08/16/batching-nljoptimization-and-ordering/ The pseudo-code of new NLJ technique is like the following: begin for r_outer in (select rows from outer_table where <filter>) loop for r_inner in (select rows from inner_table where <matched the join + filter>) loop get the relevant rowid and put it in ‘list’ end loop walk through the rowid ‘list’ and scan the inner_table once to get all required data; end loop end; Test Recipes As a starting point, I will create 5 tables with 10,000 rows each and exactly10 rows per block, using “MINIMIZE RECORDS_PER_BLOCK” command. The purpose is to get a good figure of the number. In addition to that tables, 4 indexes will be created in the 4 inner tables (except DRIVEN). The index itself will be having BLEVEL=2 (I have to use PCTFREE=99 to force it), so the index height is 3 (ROOT BRANCH LEAF). Later in this test cases we will create a shorter index to see the impact of the query (logical read should be smaller as the index got shorter) 1. DRIVEN, driving (outer) tabletable name should be DRIVER or DRIVING but I mistakenly createdasDRIVEN and it was already half way when I realize it 2. T_UNIQ_SORTED, inner table with Unique Index on ID column and sorted data, to show the normal NLJ 3. T_UNIQ_UNSORTED, inner table with Unique Index on ID column and sorted data, to show the normal NLJ (this is created to see the different between sorted and unsorted data) 4. T_NON_UNIQ_SORTED, inner table with non-unique Index on ID column and sorted data, to show the new table pre-fetching behavior 5. T_NON_UNIQ_UNSORTED, inner table with non-unique Index on ID column and scattered/ random ordered data, to show the new table pre-fetching behavior (this is created to see what is the differences between these techniques)
- 3. create_tables.LST recreate_index.LST other_info.LST Test Cases and Results To be able to make “fair-enough” comparison, I am following these steps in this exercise. The idea is to put as much as block in the buffer to minimize physical IO. I am too lazy to create an automated script so I have done all these steps manually. Sometimes, due to an unwanted load in my VM environment, I have to rerun the test to get good data with acceptable variation. 1. Flush buffer_cache 2. Warm up the buffer by: a. Select all data from outer table, DRIVEN (full table scan) b. Scan inner table using index access (full index scan) 3. Begin snapper process from separate session 4. Execute each test case (there are 4). Turn on event 10046 to trace SQL wait event and event 10200 to dump consistent gets activity. 5. End snapper process Below are some scenarios that I have prepared and followed to see how the engine does its work. Please check below attached XLS file for the details result. 1. Normal NLJ against Unique and Non-Unique index 2. Pre-fetch NLJ againstUnique and Non-Unique index 3. Compare the performance of index with BLEVEL=2 and BLEVEL =1 4. Compare the performance of random and sequential data distribution (scattered data) DBA series - Nested Loop Join Technique.xlsx It’s Number Time With basic understanding from below table and index statistics, we expect to see around 30,000 consistent gets for the index (since we need to walk from root – branch – leaf to get the rowid) and 1,000 for
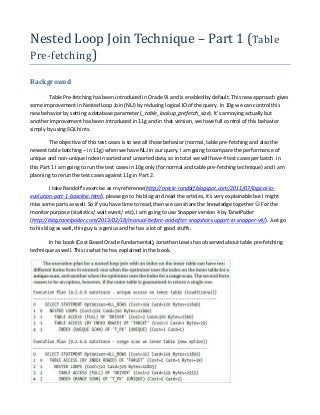
- 4. the table (with an assumption that Oracle still hold the buffer for every consecutive 10 rows) or 10,000 consistent gets (with a knowledge that we have 10,000 rows in the table). TABLE_NAME NUM_ROWS BLOCKS AVG_ROW_LEN ------------------------------ ---------- ---------- ----------DRIVEN 10000 1000 204 T_UNIQ_UNSORTED 10000 1000 204 T_NON_UNIQ_SORTED 10000 1000 204 T_UNIQ_SORTED 10000 1000 204 T_NON_UNIQ_UNSORTED 10000 1000 204 INDEX_NAME CLUSTERING_FACTOR BLEVEL LEAF_BLOCKS DISTINCT_KEYS -------------------------- ----------------- ---------- ----------- ------------T_UNIQ_UNSORTED_IDX 9993 2 10000 10000 T_NON_UNIQ_UNSORTED_IDX 9989 2 10000 10000 T_UNIQ_SORTED_IDX 1000 2 10000 10000 T_NON_UNIQ_SORTED_IDX 1000 2 10000 10000 Normal NLJ, Unique and Non-Unique Index Let’s start with the most basic one. Before we start this test, we need to disable pre-fetching feature using below command and bounce the instance. If everything is in place, we should see below execution plan from both unique and non-unique version. alter system set "_table_lookup_prefetch_size"=0 scope=spfile; Unique Index
- 5. Non-Unique Index Reading the tkprof output, in the unique index version, we see 20,668 consistent gets for index access, followed by exactly 10,000 for the inner-table (T_UNIQ_SORTED). While in the non-unique version, we see 30,667 consistent gets for the index access and 10,000 for the outer-table (T_NON_UNIQ_SORTED). In addition to this, we have 1,672 visits for the outer table (DRIVEN). So these facts are not matched with our expectation??? To be able to answer this question, we need to enable event 10200 to dump consistent gets. The output of event 10200 dump file is provided in above tabular attachment and we will look into it to see what was happened. Instead of 30,000 consistent gets for the index (as what we expect in the
- 6. beginning), Oracle did only 20,668 (as reported in tkprof output and also in the output of event 10200 dump file).In this case Oracle make some optimization by pinning those ROOT buffers (only 668 consistent gets out of 10,000 – in the above right most table). That is make sense since ROOT and BRANCH is kind of door or gate to enter the index data, which is in the LEAF block. Moving to the table part, here we have extra 400 consistent gets for T_UNIQ_SORTED (actually we have 1,000 blocks and 10,000 rows) and also extra 267 for DRIVEN, which is inconsistent result if we compare to the tkprof output. What I can say from this symptom is some buffer might be being read more than once. But actually we should have 10,000 consistent gets for DRIVEN (in fact that we have only 1,000 blocks for 10,000 rows), so that 267 extra is considered as small And WHY we have inconsistent result between session statistics and the output of tkprof??? As of now what I can say is, again, may be the output of tkprofis being affected by table and index statistics (product of Oracle algorithm). Of course we need to confirm it by HACKING the statistics rerun again few test cases (I will put it in my list) Going forward to the non-unique index, finally we can able to spot the different of 10,000 consistent gets between those 2 things what is that??? We have 19,999 consistent gets for LEAF block; this means additional 10,000 consistent gets! Ok good!?! When we look into the consistent get hierarchy table, after Oracle visit the inner-table, Oracle go to the next leaf to check whether that leaf has the same value with the current leaf or not. This is an extra job for Oracle when we have non-unique index, it has to check whether the next leaf has the same value or not. This behavior is not present in the unique index. These are another interesting statistics/ wait event to be compared: consistent gets – examination related with unique index access, according to Randolf, this is “shortcut” version of consistent gets and it could reduce the number of required latch when we want to access some buffer (I have to rerun this test and monitor the latch activity as well, may be later) index fetch by rowid index unique scan index scan kdiixs1 index range scan buffer is (not) pinned count part of Oracle optimization to reduce consistent gets rows fetched via callback observed only in unique index scan, but I cannot find further information table scan blocks gotten why it is 1,670 blocks only while we have 2 table with 1,000 blocks each. This is due to “warm up” activity that is executed before NLJ, so few blocks are already in the buffer, this was my first and only guess db file sequential read confirmed that during this testing, Oracle reload few db blocks into the buffer
- 7. Pre-fetching Technique, Unique and Non -Unique Index In 10g, pre-fetching is enabled by default, but in most of the cases we can only see this feature in the non-unique index access (I cannot reproduce pre-fetching output for unique index scan in this exercise). Starting 11g, Oracle is able to use pre-fetching techniqueagainst unique index scan, and that is the default behavior(this sounds to be good news). I am going to cover the comparison between normal and pre-fetching technique against non-unique index only, since the outputs of unique index are similar (please check in the XLS file for the details). When we enable pre-fetching feature, we should be able to see below new execution plan for non-unique index scan. The “TABLE ACCESS BY INDEX” has been moved to the upper list, outside the “NESTED LOOPS”. What this means? To me, it can be translated as “instead of going forth and back from index – table to getrowid and finally access the data, Oracle can keep few rowids into alist, mostly linked list structure, and finally use single/ multi block scan to the table”. This new approach will reduce the number of consistent gets. Well let’s see the number for the confirmation, as always.
- 8. While the consistent gets for the index part is still remain the same (20,668 from event10200 dump fileoutput and 30,667 from tkprof output), the number of consistent gets for the table access, T_NON_UNIQ_SORTED, are significantly reduced from 10,400 in the previous test case (it should be 10,000 normally) to 1,667 consistent gets only. This is confirming the theory of pre-fetching technique, that Oracle do not go to the table directly after get a rowid from leaf block. Except the “consistent gets” related, while checking the statistics and wait events comparison, we can see also the improvement in “buffer is pinned count” where Oracle exactly pinned more buffer for table block. But the value of this statistic is still mystery for me since I cannot figure it out from where it is coming. It will be good to see if anyone is able to get this algorithm or calculation. Index’s Height The first myth about the relation of index’s height with the performance of NLJ is that the lower the index, the smaller the consistent gets is. So let’s the number confirmed it. During this test case, I have to recreate the index with default PCTFREE. It will create an index with BLEVEL=2 (the index doesn’t has BRANCH level) and has only 20 blocks (instead of 10,000 blocks in the previous test case). Since this is a huge different, we expect to see some improvement as well in term of consistent gets. Below is the detail of the newly created indexes.
- 9. INDEX_NAME CLUSTERING_FACTOR BLEVEL LEAF_BLOCKS DISTINCT_KEYS ------------------------------ ----------------- ---------- ----------- ------------T_UNIQ_SORTED_IDX 1000 1 20 10000 T_NON_UNIQ_SORTED_IDX 1000 1 21 10000 Unique Index
- 10. In the unique index version, we can see that consistent gets of index is reduced by 10,000 since we don’t have BRANCH level in the new index. The result of normal and pre-fetching technique is not different for unique index version as what we have observed before, so this improvement is purely due to the index size (we have shorter index with height = 2, or BLEVEL=1).Thus we can say, in 10g, when we are talking about unique index, Oracle always think (maybe hardcoded in the code) that scanning single index leaf is the most efficient access path. The dump output of new T_UNIQ_SORTED_IDX structure is attached in the above table for your reference, it is clearly mentioned that the number of leaf block is 20. Non-Unique Index I was shocked when I see the output of non-unique index with pre-fetching feature turn on. The output of event 10200 didn’t capture any ROOT/ BRANCH access of the index, and moreover the number of consistent gets for LEAF block is also reduced from 19,999 to 8,632 (it is a huge improvement indeed). It is interesting to see from where the improvement is coming, whether it is coming as part of pre-fetching technique or because we have shorter index??? The answer is easier to get since we have already know the output of unique index version before. Yes, it is due to the size of the index. Well let’s see below table for statistics and wait event comparison (for the unique index version, you can see also below comparison but to me, nothing is interesting).
- 11. “consistent gets” is reduced from 42,381 to 34,048 due to optimization from pre-fetching technique (“buffer is pinned count” make it clear that Oracle is able to pin the buffer twice, from 17,669 to 35,334) and finnaly “consistent gets” is reduced from 34,048 to 14,735, but this time due to shorter index (“buffer is pinned count” did not change during this test case, which is 35,334). We can see also the improvement in “physical reads” from 13 to 0. So in this case we can say that small is beautiful isn’t it? How about the result for normal non-unique index version? Do we have buffer optimization as well when the index is shorter? The answer is No (please check in the XLS for details), so table pre-fetching feature is independent with index’s size. Another interesting part is again “consistent gets – examination”, it is reduced from 10,001 to 1. And finally from another book of Jonathan Lewis, “Oracle Core Essential Internals for DBAs and Developers” I got some clue(this is another interesting book and mostly I will not be able to finish reading it), and found this one. So it is related with latch activity, which is sadly was missed in this exercise Ok, I will not cover and talking this statistic anymore in this exercise, but I have to cover it in Part 2 or later if I have time and, more important,a willingness to rerun all these test cases against 10g. Pre-fetching Technique, Scattered vs Sequential Data in Unique and Non-Unique Index
- 12. The last test case is to check how Oracle handle scattered data. For unique index, everything looks similar, regardless how scattered the data in the table is. The same thing is happened for non-unique index when pre-fetching is turn off. So, nothing is special in here, so leave it. Let’s check the non-unique index when pre-fetching is turn on. Moving forward to non-unique index (pre-fetching is turn on), the consistent gets is increased from 34,048 to 42,369. I will attached again the output of event 10200 from non-unique index version (both sorted and unsorted) non-unique index, pre-fetching is turn on, data is sorted non-unique index, pre-fetching is turn on, data is unsorted (scattered)
- 13. The only different is consistent gets from the table; it is 1,667 for sorted table and 9,988 for scattered table. What is this odd 9,988 value? From where is it coming? How about this? Isn’t it a nice coincidence? To be able to scan the data in a sequential order, Oracle need to jump 9,989 times to the different table block, this is what clustering_factor is all about. So, Oracle use this knowledge as an upper limit for consistent gets value for table access. Of course the value can be less than the clustering_factor value (part of buffer optimization), but it should not be more than that. From “buffer is pinned count” statistic we can see that Oracle did the buffer optimization for scattered data but is not that much if we compare to the sequential one. References http://hoopercharles.wordpress.com/2011/01/24/watching-consistent-gets-10200-trace-file-parser/ http://oracle-randolf.blogspot.com/2011/07/logical-io-evolution-part-1-baseline.html http://dioncho.wordpress.com/2010/08/16/batching-nlj-optimization-and-ordering/ http://blog.tanelpoder.com/2013/02/18/manual-before-and-after-snapshot-support-in-snapper-v4/ “Cost Based Oracle Fundamental” book
- 14. What’s Next? This article only covers a small part of real world scenarios. There are a lot of other considerations that need to be tested to get more detail understanding about how things are working. In this article, we have not talking about how Oracle handles: 1. IOT, Index Organized Table 2. Bitmap Index 3. Global or Local Index 4. Parallelism 5. Anti Join or Semi Join 6. Index Pre-fetching (if such of this feature is available) You can add another point to make this list longer, or you can make it shorter by taking one and do the exercise. So, will you participate??? -heri-