SlideShare uma empresa Scribd logo
1 de 70
“Financial Performance Analysis: AStudyonJanataBank Ltd.”
Department of Accounting and Information Systems, Comilla University. Page | 1
1.1 Introduction
The process of economic development needs capital formation besides other structural
changes like improvement in skill and efficiency of manpower, better organization, health
and education system, etc. An efficient and well-organized financial system contributes to
the much-desired economic development through capital formation which can be divided into
three stages viz., savings, financing and investment. Banks constitute the most important
functionary in the whole network of the financial system for mobilization of savings,
intermediation between savers and investors and allocation of credit to productive sectors and
thus play a dynamic role in the economic development of a nation. The health of Bangladesh
Economy is closely related to the banking systems.
Banking is one of the highly leveraged businesses. Financial statements for banks present a
different analytical problem than statements for manufacturing and service companies. As a
result analysis of bank’s financial performance requires a distinct approach that recognizes a
bank’s unique risks.
Janata Bank Limited is a first generation bank in Bangladesh. It is playing an important role
in developing the business sector of the country. It has implemented well-structured online
banking systems that make it easier to provide prompt banking services to the customer.
Financial performance analysis is the process of identifying the financial strengths and
weaknesses of the Bank by properly establishing the relationship between the items of
balance sheet and profit and loss account. It also helps in short-term and long term
forecasting and growth can be identified with the help of financial performance analysis. It is
the structural and logical way to represent overall financial performance of a financial
institution.
1.2 Origin of the Report
Theoretical and practical knowledge both are important phases of learning. Perfect
combination of both practical and theoretical methods is necessary for holistic learning.
Theoretical knowledge has its own importance in the learning. It is the base of doing anything
practically. Practical knowledge assists us to attain the exact techniques that become the tools
of our job. Learning during internship is the best way of acquiring knowledge by using both
practical and theoretical aspects of a thing or situation.
To relate the theoretical knowledge with the practice Bachelor of Business Administration
(BBA) course requires 3 months attachment with an organization followed by a report
assigned by the supervisor in the organization and endorsed by the faculty. Students are
placed in enterprises, organizations, research institutions as well as development projects.
Since practical orientation is an integral part of the BBA degree requirement, I was deputed
by the Department of Accounting & Information Systems (AIS), Comilla University to Janata
“Financial Performance Analysis: AStudyonJanataBank Ltd.”
Department of Accounting and Information Systems, Comilla University. Page | 2
Bank Limited, Corporate Branch, Comilla to take real life exposure of the activities of the
organization as a financial institution. After completion of the internship program report
submission is essential. I have assigned a topic “Financial Performance Analysis of Janata
Bank Limited.” The topic was selected with able guidance of the respective supervisor. The
Janata Bank Ltd. authority gave me the opportunity to work at the three months on the topic.
My faculty supervisor Shuvabrata Saha, Assistant Professor of AIS department, Comilla
University, approved the topic and authorized me to prepare this report as a part of the
fulfillment of internship requirement.
1.3 Rationale of the Report
Banking in Bangladesh has to keep pace with the global change. The economy of the country
has a lot left to be desired and there are lots of scopes for massive improvement. In an
economy like this, banking sector can play a vital role to improve the overall social-economic
condition of the country. Now, Banks must compete in the market place both with local
institution as well as foreign ones. The management of the bank is responsible for taking
decisions and formulating plans and policies for the future. They, therefore, always need to
evaluate its performance and effectiveness of their action to realize the company’s goal in the
past. For the purpose financial performance analysis is important to the company’s
management. It’s very important to have an effective and sound credit risk management
system in place which will help the bank mitigate its risk factors and carry out successful
financing service or lending. Financial performance analysis helps to provide important
information to the management regarding extension of credit. Shareholders, who are the
owners of the bank, can also get meaningful information through the financial performance
analysis.
Thus, performance analysis helps to highlight the facts and relationships concerning
managerial performance, corporate efficiency, financial strength and weakness, credit
worthiness of the bank. With these issues in mind, the topic “Financial Performance
Analysis” has been undertaken as my topic for internship report.
1.4 Objectives of the Report
The following report has two types of objectives which are described as follows:
1.4.1 Broad Objectives:
 To get an overall idea about the financial performance of Janata Bank Limited.
 To relate the theoretical knowledge to the original financial data of Janata Bank
Limited.
1.4.2 Specific Objectives:
 To understand the theoretical aspect of financial performance.
“Financial Performance Analysis: AStudyonJanataBank Ltd.”
Department of Accounting and Information Systems, Comilla University. Page | 3
 To analyze the financial statements of Janata Bank Limited by using financial tools.
 To know about different ratios applicable for measuring financial performance of a
bank.
 To identify the strength and weakness of the bank based on the financial performance
in the last five years (2009-2013).
 Finally, to make some recommendations and suitable conclusion regarding financial
performance of Janata Bank limited.
1.5 Methodology of the Report
1.5.1 Introduction:
This report is the reflection of three months internship program in Janata Bank Limited
corporate Branch, Comilla. Banking sector is a fast going sector in Bangladesh. All banks are
facing tremendous competition from each other. So, the officers remain very busy to provide
a better customer service. As an intern, I had to collect data and information from that busy
corporate environment. Information collected to furnish this report is both from primary and
secondary sources.
1.5.2 Researchtype:
This is a “Descriptive Research”, which briefly reveals the overall activities of the bank. This
Internship report has been prepared based on the information extracted from different sources
collected by using a specific methodology.
1.5.3 Choice of the Year:
I have selected the last five years (2009-2013) for my analysis. I have collected data and
financial papers of these five years to prepare this report.
1.5.4 Method of Data Collection:
To make this report presentable and effective, the necessary information has been collected
from two sources:
“Financial Performance Analysis: AStudyonJanataBank Ltd.”
Department of Accounting and Information Systems, Comilla University. Page | 4
The primary sources are:
 Face to face conversation with the clients.
 Taking initial lectures from Branch Manager and Senior Officers.
 Consulting with the supervisor.
 Practical work experience at different desk.
 Close observation of the several tasks by the different department’s officers.
The secondary sources are:
 Annual Report of Janata Bank Limited (2009-2013).
 Brochures of Janata Bank Limited.
 Prospectus of Janata Bank Limited.
 Relevant file study as provided by the officers concerned.
 Working Papers.
 Different circulars issued by the Head office of Janata Bank Limited.
 Unpublished data received from the corporate Branch, Comilla.
 Different Financing and Accounting related text books.
“Financial Performance Analysis: AStudyonJanataBank Ltd.”
Department of Accounting and Information Systems, Comilla University. Page | 5
1.5.5 Data Analysis & Reporting:
To analyze the gathered data I have used Ratio analysis, Vertical/Common size analysis,
Horizontal/Trend analysis, Economic value added analysis (EVA), Market value analysis.
Some necessary number of table, chart, and graph are also used to present the report. Ms-
Word, Excel or any required computer programs used to process the data.
1.6 Scope of the report
There is a certain boundary to cover this report. To achieve the objective of the report, i.e. to
get an overall idea about the financial performance of Janata Bank Limited, it is not possible
to cover each and every activity performed in the organization. The report has covered only
the data which are published in the annual reports. Moreover the company itself and financial
institutions have got some confidential information which is not possible to disclose publicly,
so those data and information had to be ignored for this report. The report is divided into six
parts. Chapter one contains “Introduction” which includes origin, objectives, scope,
methodology, justifications and limitations of the report. Chapter two contains “An Overview
of the Organization”, which includes history of JBL, its management and function, vision,
mission. Chapter three describes “Practical Experience as an Intern”. Chapter four contains
the “Literature review”. Chapter five of my report is about “Theoretical Discussion”. Chapter
six contains Financial Performance Analysis of JBL and Chapter seven includes “Findings,
Recommendation and Conclusion”.
1.7 Limitations of the Report
To make a report various aspects and experiences are needed. But I have faced some barriers
for making a complete and perfect report. These barriers or limitations, which hinder my
work, are as follows:
Confidentiality: The bank’s policy of not disclosing some data and information for obvious
reasons, which would have been very much useful for the report.
Random changing system: As the bank is continuously changing its system is also changing
time to time, it will be difficult to ascertain the true performance of the bank each time.
Extreme workload: Few officers sometime felt disturbed, as they were busy with their job.
Sometime they didn’t want to supervise me out of their official work. Sometimes it was
difficult to collect data important files are kept in volt for safety.
Lack of time: Time constraint was one of the major drawbacks in the report. The duration of
the Report was only three months which was very short. So, I could not go in depth analysis.
Other limitation: There was non-availability of some preceding and latest data. As I am a
newcomer, there is a lack of previous experience in this concern. And many practical matters
have been written from my own observation that may vary from person to person.
“Financial Performance Analysis: AStudyonJanataBank Ltd.”
Department of Accounting and Information Systems, Comilla University. Page | 6
2.1 Backgroundof Janata Bank Limited
Janata Bank Limited is one of the state owned commercial banks in Bangladesh, has an
authorized capital of Tk. 20000 million (approx. US$ 289.85 million), paid up capital of Tk.
5000.00 million, reserve of Tk.8202.00 million and retained surplus Tk. 2737.00 million. The
Bank has a total asset of Tk. 282423.00 million as on 30th November 2008. Immediately
after the emergence of Bangladesh in 1971, the erstwhile United Bank Limited and Union
Bank Limited were renamed as Janata Bank. On 15th November, 2007 the bank has been
Corporatized and renamed as Janata Bank Limited. Janata Bank Limited operates through
860 branches including 4 overseas branches at United Arab Emirates. It is linked with 1202
foreign correspondents all over the world. The Bank employs more than 13(Thirteen)
thousand persons. The mission of the bank is to actively participate in the socio- economic
development of the nation by operating a commercially sound banking organization,
providing credit to viable borrowers, efficiently delivered and competitively priced,
simultaneously protecting depositor’s funds and providing a satisfactory return on equity to
the owners. The Board of Directors is composed of 13 (Thirteen) members headed by a
Chairman. The Directors are representatives from both public and private sectors. The Bank
is headed by the Chief Executive Officer & Managing Director, who is a reputed banker. The
corporate head office is located at Dhaka with 10 (ten) Divisions comprising of 37 (thirty
seven) Departments. The Company started its banking operation and entitled to carry out the
following types of banking business:
All types of commercial banking activities including Money Market operation:
 Investment in Merchant Banking activities.
 Investment in Company activities.
 Financiers, Promoters, Capitalists etc.
 Financial Intermediary Services.
 Any related Financial Services
2.2 Vision of Janata Bank Limited
To become the effective largest commercial bank in Bangladesh to support socio- economic
development of the country and to be a leading bank in South Asia.
2.3 Missionof Janata Bank Limited
Janata Bank Limited will be an effective commercial bank by maintaining a stable growth
strategy, delivering high quality financial products, providing excellent customer service
through an experienced management team and ensuring good corporate governance in every
step of banking network.
“Financial Performance Analysis: AStudyonJanataBank Ltd.”
Department of Accounting and Information Systems, Comilla University. Page | 7
2.4 Corporate Profile
Name of Company Janata Bank Limited
RegisteredOffice Janata Bhaban110, Motijheel C/A Dhaka-
1000, Bangladesh
Legal Status 21 May 2007
Date of Commencement of Business 21 May 2007
Banking license obtained from Bangladesh
Bank
31 May 2007
Authorized Capital BDT 20,000 Million
Paid up Capital BDT 19,140 Million
Face value per share BDT 100
Shareholding Pattern 100% Share owned by Government of the
People’s Republic of Bangladesh
Tax Identification No 001-200-2732
Vat Registration No 9011050160
Chairman of the Board of Directors Professor Dr. AbulBarkat
CEO & Managing Director Mr. S M Aminur Rahman
Corporate Rating Status:
Entity Rating (2012)
As Government owned Bank
A+ in the long run
AR-2 in the short run
AAA in the long run
AR-1 in the short run
Telex 675840JBDBJ, 671288 JBHOBJ
Phone PABX 9560000, 9566020, 9556245-49, 9565041-
43, 9560027-30
Fax 88-02-9564644, 9560869
E-mail md@janatabank-bd.com
Website www. janatabank-bd.com
Swift Code JANB BD DH
“Financial Performance Analysis: AStudyonJanataBank Ltd.”
Department of Accounting and Information Systems, Comilla University. Page | 8
2.5 Core Values of Janata Bank Limited
Fig: Core values of Janata bank limited
2.6 Core strengths
 Transparent and Quick Decision Making.
 Efficient Team of Performer.
 Satisfied Customers.
 Internal Control.
 Skilled Risk Management.
 Diversification.
2.7 Core competencies
 Knowledge.
 Experience & Expertise.
 Customer Orientation/ Focus.
 Transparency.
 Determination.
 Zeal for Improvement.
2.8 Objectives of Janata Bank Limited
The objectives for which the bank is established are as follows:
 To carry on, transact, undertake and conduct the business of banking in all branches.
 To receive, borrow or to raise money on deposit, loan or otherwise upon such terms as
the company may approve.
 To carry on the business of discounting and dealing in exchange of specie and
securities and all kinds of mercantile banking.
 To provide for safe-deposit vaults and the safe custody of valuables of all kinds.
Professinalism
Accountability
Intrigity Quality
Transparency
Commitment Diversity
Dignity
Growth
“Financial Performance Analysis: AStudyonJanataBank Ltd.”
Department of Accounting and Information Systems, Comilla University. Page | 9
 To carry on business as financiers, promoters, capitalists, financial and monitory
agents, concessionaires and brokers.
 To act as agents for sale and purchase of any stock, shares or securities or for any
other momentary or mercantile transaction.
 To establish and open offices and branches to carry on all or any of the business
abroad and within the country provided prior permission is obtained from Bangladesh
bank.
 To ensure optimum utilization of all available resources.
 To remain one of the best banks in Bangladesh in terms of profitability and asset
quality.
2.9 Business Prospects of Janata Bank Limited
 Surplus Capital Adequacy after IPO subscription.
 Business expansion in capital market.
 Gradual expansion of branch network.
 Progressive automation of the branches.
 Real online banking software will be in function soon.
 Expansion of ATM and Credit Card.
 Consideration of prime customers.
2.10 International Award of Janata Bank Limited
Recently The Bank has been recognized internationally and domestically for its good
performance.
 International Award -"World's Best Bank Award-2010 in Bangladesh.
 International Award -"World's Best Bank Award-2009 in Bangladesh.
 International Award -"World's Best Bank Award-2007 in Bangladesh.
 International Award -"World's Best Bank Award-2006 in Bangladesh.
 Janata Bank Limited receives "Asian Banking Awards 2005" on Credit Scheme for
Handicapped People.
 International Award -The Bank of the Year-2004 in Bangladesh.
“Financial Performance Analysis: AStudyonJanataBank Ltd.”
Department of Accounting and Information Systems, Comilla University. Page | 10
2.11 Services of Janata Bank Ltd
Fig: various services provide by Janata bank limited
2.12 Branches of Janata Bank Limited
Branches No. of Branches
Local Office 1
Corporate-1 Branch 10
Corporate-2 Branch 40
Overseas Branch 04
Grade-1 Branch 204
Grade-2 Branch 205
Grade-3 Branch 291
Grade-4 Branch 104
NRB Branch 01
Total Branches 860
2.13 New/ Special Products of Janata Bank Limited
 Financing IT Sector.
 Financing of Industries.
 Ready Cash.
 Windows for SMEs.
 Loan to Travel Agencies.
Current Services
• customer
Credit Scheme
• Secured
Overdraft
• Cash Credit
• Curent Deposit
A/C
• Deposit
Services
Deposit Services
• Savings A/C
• Curent Deposit
A/C
• Short Term
Deposit
• Fixed Deposit
Received
• Monthly
Savings
Scheme
Others
• DD
• TT
• L/C
• PO
• Credit Cards
• Online Banking
“Financial Performance Analysis: AStudyonJanataBank Ltd.”
Department of Accounting and Information Systems, Comilla University. Page | 11
 Loan to Diagnostic Centers.
 NRB Escrow Account.
 NRB Gift Cheque.
2.14 Ethical Principles
Bank deals with public money where ethics, integrity and trust are the most essential. Janata
Bank protects and upholds these principle issues in every area of its management activities
and customer services. The basic characteristics of employee’s code of ethics and business
conduct are as follows:
 Ensure customer service with utmost care, respect, dedication, integrity and
unwavering responsibility.
 Protect privacy and confidentiality of customer’s information.
 Prevent money laundering and fraud forgery.
 Protects and upholds corporate value.
2.15 Strategic objectives of JBL
We Have:
 Concern.
 Commitment.
 Competence.
Our Strengths:
 Nationwide networks, 893 branches.
 Foreign network, 4 branches and.
 1239 foreign corospondence.
 State-owned image.
 Goodwill.
 Received globally recognized awards.
 Strong deposit base.
 No capital shortfall.
 No provision shortfall .
 Skilled manpower.
 Experienced higher level management.
 Newly recruited talents.
 Friendly board of directors.
Our Brand:
 Quality and responsive staff.
 Efficient service.
“Financial Performance Analysis: AStudyonJanataBank Ltd.”
Department of Accounting and Information Systems, Comilla University. Page | 12
 High and sustained growth (depositadvance, import, export, foreign remittance non
interest income and recovery).
 Good quality loan.
 Low classified loan.
 Timely recovery.
 Business diversification.
 Attract low cost deposit.
 Participate in capital market.
 Improve agricultural loan(disbursement, recovery etc.).
 High impact of CSR.
 Aesthetic infrastructure.
We Need:
 Sense of belonging (ownership).
 Improve service mentality.
 Human touch with clients.
 Proactive, team spirit.
 Loosing branches make profitable.
 Chronic weak branches make strengthen.
 Managerial efficiency (GIS of good customer/ borrowers; meeting each within 1 km
radius).
 Strong cash recovery.
 Strategic thinking.
 More agricultural loan.
 Broadening of deposit base; reaching all.
 Automation, on-line banking.
 Need based training.
 More remittance.
 Discipline, chain of command.
 Hygienic bank premises.
 Avoid intermediary between management and clients.
“Financial Performance Analysis: AStudyonJanataBank Ltd.”
Department of Accounting and Information Systems, Comilla University. Page | 13
2.16 ORGANOGRAM OF JBL
Board of Director
Managing Director
Deputy Managing Director
General Managers
Deputy General Managers
Senior Principle Officer
Principle Officers
Senior Officers
Officers
Assistant Officer
Management Trainee
Officer
“Financial Performance Analysis: AStudyonJanataBank Ltd.”
Department of Accounting and Information Systems, Comilla University. Page | 14
2.17 Corporate Governance
Boardof Directors Designation
ProfessorDr. Abul Barkat Chairman
Dr. Jamal uddin Ahmed, FCA
Mr. Md. Emdadul Hoque
Mr. Nagibul Islam Dipu
Dr. R M Debnath
Syed Bazlul Karim, B.P.M.
Prof. Mohammad Moinuddin
Mr. Md. Abu Naser
Mrs. Sangita Ahmed
Prof. Dr. Nitai Chandra Nag
Mr. A.K.M Kamrul Islam, FCA
Member
Member
Member
Member
Member
Member
Member
Member
Member
Member
Corporate
Governance
Culture
Business
Planning
Compliance
Risk
Management
“Financial Performance Analysis: AStudyonJanataBank Ltd.”
Department of Accounting and Information Systems, Comilla University. Page | 15
2.18 Financial highlights of JBL
“Financial Performance Analysis: AStudyonJanataBank Ltd.”
Department of Accounting and Information Systems, Comilla University. Page | 16
2.19 CSR Activities of Janata Bank Limited
For bringing dynamism in CSR activities and including the most part of the deprived people,
the total activities have been categorized and sub-categorized in the following ways:
 Education & Research.
 Health & Treatment.
 Poverty reduction & rehabilitation.
 Combat against natural calamity.
 A try to bring the marginal agriculturists and the poor out of the grip of loan.
 Preservation of history-tradition, culture and sports.
 Preservation of environment.
 Expansion of technology.
 Invention.
SL Description Contribution
(In Million)
1. Cash donation to the PM’s relief fund for the victims of Rana Plaza
accident at Savar and maintenance of two relief camps for three
weeks at Savar.
20.00
2. Donation to the University of Dhaka for establishing a new
department named “Department of Oceanology”
19.00
3. Donation to “Proyash”, Comilla for running a school for the disabled. 10.00
4. Donation to establish “Muktijuddha Smriti Zadughar” at
Segunbagicha, Dhaka
10.00
5. Donation to Hokey Federation for development of the sector 6.90
6. Providing a bus for the teachers of the University of Dhaka. 6.80
7. Providing a bus for the teachers/doctors of Bongobondhu Medical
University, Dhaka.
6.80
8. Providing a bus for the teachers of Jahangir Nagar University 3.80
9. Providing a bus for the students of Shahjalal Science & Technology
University, Sylhet.
3.80
10. Providing a bus for the teachers of Chittagong University. 3.80
11. Providing an ambulance to CRP at Savar. 3.20
12. Distribution of blankets among the poor. 3.00
13. Donation to Dhaka Ahsania Mission for establishing Cancer
Hospital.
2.00
14. Donation to Begum Rokeya University in Rangpur for foundation of
“Shahid Minar”.
1.00
15. Donation for establishing Bondor Badhy Bhumi Smriti Complex in
Chittagong.
0.80
16. Providing an ambulance to Kushtia General Hospital. 0.70
17. Donation to Dhaka Shishu Hospital for setting up Thalassemia
Centre.
0.67
18 Donation for establishing “Shahid Minar” at Borguna. 0.65
19 Donation to Shamima Akhter for artificial leg. 0.50
“Financial Performance Analysis: AStudyonJanataBank Ltd.”
Department of Accounting and Information Systems, Comilla University. Page | 17
3.1 Positionand Duties as an Intern:
An internship is work-related learning experience for individuals who wish to develop hands
on work experience in certain occupation field. An internship is position which allows a
student to gain professional experience in an occupational area which they are considering.
An internship is a supervised pre professional learning experience in which students apply
their skills knowledge in a professional setting. It provides students with a full and realistic
view of workplace culture and experience. As a part of the Internship program of Bachelor of
Business Administration (BBA) course requirement, I was assigned to do my internship at
JBL, Comilla branch for period of three months.
3.1.1 Internship Position:
As an intern I was act as an intern of the organization. My job was to gain the practical
knowledge from the bank. For this reason I observed practical works done by the officers of
the JBL Comilla branch. I did some work to familiar the work. My learning experiences from
the various departments are given in the following table. A short summary of my duties and
responsibilities are also stated below:
Placement Area Working Days
Cash section 8 days
Accounting section 20 days
Loan and advance section 14 days
Clearing section 12 days
Remittance section 10 days
3.1.2 The Nature of the Job and My Specific Responsibilities:
General Banking Division:
In General banking division I had lots of duties. Those are containing Cash Counter Section,
Front Desk and Accounts Department.
About a week I was in the cash department. The bank does not usually put intern nevertheless
they allowed me and I was lucky to experience first-hand what happens behind the counter.
My responsibilities in this department have been just to assist them in a small and possibly
way.
 Use the Xerox machine to help them.
 Counting vouchers.
 Checking the individual EOD (End of day journal report) of each cashier.
 Learn about Money Laundering Act.
Although the activities were very small, they helped me understand the nature of work. Then
I was assign to Front desk and Account’s Department.
“Financial Performance Analysis: AStudyonJanataBank Ltd.”
Department of Accounting and Information Systems, Comilla University. Page | 18
I had a wide variety of responsibilities:
 Account opening.
 Demand Deposit.
 Fixed deposit.
 Give the information to customer about our product.
 Bringing out the cheque books for customers, receiving them from courier.
 Recording the issuance cheque books in the recording paper.
 Finding FD, DPS, and old account opening forms.
 Putting different seals for clearing.
 Writing the later on printing pay orders.
 Numbering shares and putting seals on them during IPO’s.
 Give the balance statement.
 Signature verification etc.
Advance & Loan Division:
It is really hard to work in this department for the first time and I become very disappointed
by later on I worked hard and learned how to deal with this. I was in this division for the next
2 weeks. Although much work was not assigned me, I assist this section in the following
way:
 Accept customer loan offer.
 Discuss with person about loan.
 Create new file for loan application.
 Prepare Documentation form.
 Observe evaluation paper.
 Fill up CIB inquiry form.
 Sorting the loan form and put that form in according to customers file.
 Create sanction letter.
 Observe cheque list.
3.1.3 My Observation:
As internship is an important learning experience so I completed my internship at Janata
Bank Ltd. I had a lot of pleasurable moment but more importantly finally understood working
by actually being there. This practical orientation is really necessary for the development and
preparation of personnel before entering in any professional area.
The things that I have learned and experienced at JBL are:
 Meaning and understanding the responsibilities.
 Necessity of commitment.
 Punctuality and regularity is important.
 Ability to interact with different sorts of people.
 Accumulated valuable work-related skills.
“Financial Performance Analysis: AStudyonJanataBank Ltd.”
Department of Accounting and Information Systems, Comilla University. Page | 19
4.1 Literature Review
Financial performance analysis is the process of determining the operating and financial
characteristics of a firm from accounting and financial statements. The goal of such analysis
is to determine the efficiency and performance of firm’s management, as reflected in the
financial records and reports.
Finance always being disregarded in financial decision making since it involves investment
and financing in short-term period. Further, also act as a restrain in financial performance,
since it does not contribute to return on equity (Rafuse, 1996). Dilemma in financial
management is to achieve desired trade off between liquidity, solvency and profitability
(Lazaridis et al., 2007). Management of working capital in terms of liquidity and profitability
management is essential for sound financial recital as it has a direct impact on profitability of
the company (Rajesh and Ramana Reddy, 2011). The crucial part in managing working
capital is required maintaining its liquidity in day-to-day operation to ensure its smooth
running and meets its obligation (Eljelly, 2004). Ultimate goal of profitability can be
achieved by efficient use of resources. It is concerned with maximization of shareholders or
owners wealth (Panwala, 2009). It can be attained through financial performance analysis.
Note that the terms ‘performance’ and ‘effectiveness’ are used interchangeably because
problems related to their definition, measurement and explanation are virtually identical
(March and Sutton 1997). Financial analysis offers a system of appraisal and evaluation of a
firm’s performance and operations; it is the analysis of the financial statement of an
enterprise. Financial analysis is the process of identifying the financial strengths and
weaknesses of the firm by properly establishing relationship between the items of the balance
sheet and the profit and loss account (Pandey ,1979). The analysis of financial statement can
be best done by various yardsticks of which, the important is known as ratio or percentage
analysis. Financial Statements (income statement, cash flow statement, owners’ equity
statement and balance sheet) contain a wealth of information which, if properly analyzed and
interpreted, can provide valuable insights into a firm’s performance and position.
Performance measurement of public enterprises has been the subject matter of discussion for
planners, administrators, managers, economists and academics since long. But some lack of
clarity about performance and the existence of defensive attitude on the part of those who
have to take responsibility for inefficient operations have the effect of inhibiting both frame
discussion and decisive action in this regard Bunnett(1987). Trade creditors are interested in
the firm’s ability to meet their claims.The suppliers are concerned with the firm’s solvency
and survival. They analyze the firm’s profitability over time. Long term creditors place more
emphasis on the firm’s solvency and profitability. The investors are most concerned about the
firm’s earnings.
“Financial Performance Analysis: AStudyonJanataBank Ltd.”
Department of Accounting and Information Systems, Comilla University. Page | 20
The concept of financial performance of the banks based on the financial ratio is applied by
different researcher and the following is the summary of past studies and their results about
the performance of the banks:
In his study, (Tarawneh, 2006) divided the commercial banks in Oman in cohesive categories
depending on their financial characteristics revealed by financial ratios. Financial ratios are
the simplest tools for evaluating the financial performance of the firm Wen-Cheng LIN ET.
Al (2005). One can employ financial ratios to determine a firm’s liquidity, profitability,
solvency, and capital structure and assets turnover.
Altman (1968) used financial ratios to predict corporate bankruptcy. He found that the
bankruptcy model has an accuracy rate of 93% and is very successful in predicting failed and
non-failed firms. Ohlson (1980) employed financial ratios to predict a firm’s crisis. He found
that there are four factors affecting a firm’s vulnerability. These factors are the firm’s scale,
financial structure, performance and liquidity.
The operational efficiency and asset management, in adding to the bank size, positively
influenced the financial performance of these banks Khizer et.al. (2011), in his study about
profitability indicators of banks in Pakistan for the period of 2006-2009 find that profitability
is directly and positively affected by operating efficiency, assets management ratios, and size
when using ROA as profitability indicator. The association between profitability and other
indicators is different, when using ROE as profitability indicator. ROE is positively related
with assets management and negative association is finding with size and operating
efficiency. Sidqui and Shoaib, (2011) concluded in their study “Measuring performance
through capital structure in Pakistan” that size of the bank plays an important role in
determining the profitability of the bank using ROE as profitability measure. The
comparative financial performance of banking sector conducted by using CAMELS rating
system (Nimalathasan, 2008). The performance of Malaysian Islamic bank carried out by
using financial ratios(Samad and Hassan).The south African commercial banks performance
measured by financial ratios analysis (kumbiari and Webb,2010). Performance of selected
Indian commercial banks has done by view growth in asset, profit, revenue, investment and
deposit (Jaladhar, Anchula and Achari, 2011).
“Financial Performance Analysis: AStudyonJanataBank Ltd.”
Department of Accounting and Information Systems, Comilla University. Page | 21
5.1 Performance
Performance refers to both quantity & quality of work done. The accomplishment of a given
task measured against present standards of accuracy, completeness, cost and speed. In a
contract, performance is deemed to be the fulfillment of an obligation, in a manner that
releases the performer from all liabilities under the contract. Performance measures the total
return of an investment provides over a specific period. It can be positive, representing a gain
in value, or negative representing a loss.
5.2 Financial Performance
Financial Performance is a subjective measure of how well a firm can use assets from its
primary mode of business and generate revenues. This term is also used as a general measure
of a firm's overall financial health over a given period of time, and can be used to compare
similar firms across the same industry or to compare industries or sectors in aggregation.
5.3 Financial Performance Analysis
Financial performance analysis is the process of identifying the financial strengths and
weaknesses of the firm by properly establishing the relationship between the items of balance
sheet and profit and loss account. It also helps in short-term and long term forecasting and
growth can be identified with the help of financial performance analysis.
The dictionary meaning of ‘analysis’ is to resolve or separate a thing in to its element or
components parts for tracing their relation to the things as whole and to each other. The
analysis of financial statement is a process of evaluating the relationship between the
component parts of financial statement to obtain a better understanding of the firm’s position
and performance. This analysis can be undertaken by management of the firm or by parties
outside the namely, owners, creditors, investors. Standards also require auditors to obtain an
understanding of the measurement and review of the entity’s financial performance, including
both internal and external measures. Such measures might include:
 Key ratios and operating statistics.
 Key performance indicators.
 Employee performance measures and incentive compensations plan.
 Industry trends.
 The use of forecast, budgets, and variance analysis.
 Analyst reports and credit rating reports.
5.4 Major Steps of Financial Performance Analysis
Financial performance analysis is something of an art. Experienced managers, investors and
analysts develop a data bank of information over time, and after doing many such analyses,
that they bring to bear every time they review a company.
“Financial Performance Analysis: AStudyonJanataBank Ltd.”
Department of Accounting and Information Systems, Comilla University. Page | 22
Step 1: Acquire the company’s financial statements for several years. As a minimum, get the
following statements, for at least 3 to 5 years.
 Statement of Financial Position.
 Statement of Comprehensive Income.
 Statement of Changes in Owners’ Equity.
 Statement of Cash Flows.
Step 2: Quickly scan all of the statements to look for large movements in specific items from
one year to the next. For example, did revenues have a big jump, or a big fall, from one
particular year to the next? Did total or fixed assets grow or fall? If there is anything that
looks very suspicious, research the information about the company to find out why.
Step 3: Review the notes accompanying the financial statements for additional information
that may be significant to analysis.
Step 4: Examine the Statement of Financial Position. Look for large changes in the overall
components of the company's assets, liabilities or equity.
Step 5: Examine the Statement of Comprehensive Income. Look for trends over time.
Calculate and graph the growth of the following entries over the past several years.
 Revenues (sales)
 Net income (profit, earnings)
Step 6: Examine the Statement of Changes in Owners’ Equity. Has the company issued new
shares, or bought some back? Has the retained earnings account been growing or
shrinking? Why? Are there signals about the company's long-term strategy here?
Step 7: Examine the Statement of Cash Flows, which gives information about the cash
inflows and outflows from operations, financing, and investing.
Step 8: Calculate financial ratios in several categories, for each year.
Step 9: Obtain data for the company’s key competitors, and data about the industry.
Step 10: Finally, the result obtained by means of application of financial tools is evaluated.
5.5 Financial Statements
Financial Statements refers to formal and original statements prepared by a business concern
to disclose its financial information. According to John.N.Meyer, “The financial statement
provides summary of accounts of a business enterprise, the balance sheet reflecting assets,
liabilities and capital as on a certain date and the income statement showing the result of
operation during a certain period”. The financial statements are prepared with a view to
“Financial Performance Analysis: AStudyonJanataBank Ltd.”
Department of Accounting and Information Systems, Comilla University. Page | 23
depict the financial position of the concern. They are based on the recorded facts and are
usually expressed in monetary terms. The financial statement are prepared periodically that is
generally for the accounting period. The term financial statement has been widely used to
represent four statements prepared by accountants at the end of specific period. They are:
 Statement of Financial Position.
 Statement of Comprehensive Income.
 Statement of Changes in Owner’s Equity.
 Statement of Cash Flows.
5.6 Objectives of Financial Performance Analysis and Interpretation
The users of financial statement have definite objectives to analysis and interpret. Therefore;
there are variations in the objectives of interpretation by various classes of people. However,
there are certain specific and common objectives which are listed below:
 To interpret the profitability and efficiency of various business activities with
the help of profit and loss account.
 To measure managerial efficiency of the firm.
 To ascertain earning capacity in future period.
 To measure short-term and long -term solvency of the business.
 To determine future positional of the concern.
 To measure utilization of various assets during the period.
 To compare operational efficiency of similar concerns engaged in the same
industry.
5.7 Financial Analysis Tools
Financial analysis tools are one of the most efficient ways that can be used for ensuring good
profit from investments. These financial analysis tools are highly helpful in evaluating the
market and investing in a way so as to maximize the profit from the investments made. These
financial analysis tools are useful for deciphering both internal and external information
related to a specific business organization. The analysis and interpretation of financial
statement is used to determine the financial position and result of operation as well. The
following are the tools that are used for analyzing the financial position of the company:
 Horizontal Analysis
 Vertical Analysis
 Ratio Analysis
 Economic value added (EVA) Analysis
 Market value analysis
“Financial Performance Analysis: AStudyonJanataBank Ltd.”
Department of Accounting and Information Systems, Comilla University. Page | 24
5.7.1 Horizontal Analysis:
Horizontal analysis involves calculating the percentage change of the categories of financial
statements over time. For example, one may be interested in the trend of a company's
operating expenses. By examining the percentage change from year one to year two in
operating expenses, he/she can determine whether costs are shrinking or growing. However,
horizontal analysis has its drawbacks. This technique does not take into account the changing
size of v business. Going back to the expense example, a manager may be concerned that the
company's expenses are growing every year, but if the business is growing, there is no cause
for concern.
5.7.2 Vertical Analysis:
Vertical analysis is the process of reporting each item on a set of financial statements as a
percentage of a larger item. On the income statement, items are usually reported as a
percentage of sales, and on the balance sheet items are usually reported as a percentage of
total assets. A single vertical analysis is not very useful to most managers, but using the
results of a vertical analysis to compare ratios across time or to see how a company measures
up to industry benchmarks can help a management team determine areas of strength and
weakness.
5.7.3 Ratio Analysis:
Ratio analysis is a family of techniques that involves computing common ratios of different
balance sheet and income statement categories and comparing these ratios to those of other
companies or widely established benchmarks. Some ratios, such as profit margin or return on
assets, are so common that they are part of the business vernacular. Others, such as day’s
sales outstanding or collection cycle, may be initially unfamiliar but quite useful. A ratio
exists for nearly every business metric, so learning these tools can be daunting; however, the
ability to precisely gauge performance is useful when investigating specific concerns about a
firm.
5.7.4 Economic value added (Eva) Analysis:
EVA (Economic Value Added) is modern financial measurement tool that determines if a
business is earning more than its true cost of capital (Gabriela et al, 2009). While analyzing
performance of AXIS bank in terms of capital adequacy ratios and correlation analysis is
used (Shrivastava et al, 2011). The analysis includes CAMELS rating and multivariate
regression analysis for comparing financial performance commercial banks (Jha and Hui,
2012). Using data for Taiwan Province of China, Lin, Penm, Garg, and Chang (2005) study
the direct effects of capital regulations and capital requirements.
“Financial Performance Analysis: AStudyonJanataBank Ltd.”
Department of Accounting and Information Systems, Comilla University. Page | 25
5.7.5 MarketValue Analysis:
Market value analysis (MVA) is simply the difference between the current total market value
of a company and the capital contributed by investors. As a wealth metric it measures the
level of value, the bank has accumulated over time.
5.8 Groups of FinancialRatios
Financial ratios can be divided into four basic groups or categories:
i. Liquidity ratios
ii. Activity ratios
iii. Debt ratios
iv. Profitability ratios
Liquidity, activity, and debt ratios primarily measure risk, profitability ratios measure return.
In the near term, the important categories are liquidity, activity, and profitability; because
these provide the information that is critical to the short fully weather the short run.
5.8.1 Analyzing Liquidity:
The liquidity of a business firm is measured by its ability to satisfy its short term obligations
as they come due. Liquidity refers to the solvency of the firm’s overall financial position.
Importance of Liquidity Ratios:
1. Cash Flow: A company's cash flow is the money in profits that it is taking in at any one
time. This money is available for immediate spending by the company without any need to go
through a process of liquidation or selling. Any company's cash flow is subject to change as
demand rises and falls as part of the basic economic process. High cash flows allow
businesses to take on greater debt without lowering their liquidity ratios.
2. Assets: Private companies typically have a variety of assets that have different degrees of
liquidity. It is easier, for instance, to sell and make a profit off of land than it is to sell a
department. Assets can be counted as part of a typical liquidity ratio based on what they
would sell for on the immediate common market. Often, assets will be undervalued by the
market at any time, which makes them less certain.
3. Financing: It is a part of the basic functioning of the modern business. Without the ability
to take out debt, even large businesses would find it very difficult to operate. Debt is
necessary not only to finance new projects but often to manage the everyday expenses of a
business. Financing allows businesses to expand while also providing them with flexibility as
regards to shifts in demand. The higher a business' liquidity ratio, the more it can do.
“Financial Performance Analysis: AStudyonJanataBank Ltd.”
Department of Accounting and Information Systems, Comilla University. Page | 26
4. Controversy: Controversy has followed in the wake of certain financial scandals over how
much liquidity private institutions such as banks should be required to maintain. Certain
major banks failed due to the lack of funds they had available to pay their debts. The failure
of financial institutions threatens not only their investors but the entire economy for which
they form an infrastructure. Various countries around the world have begun to require higher
liquidity in private banking.
The three basic measures of liquidity are:
 Net working capital = Current Assets – Current Liability
 Current ratio = Current Assets / Current Liability
 Quick Ratio = Cash + Government Securities + Receivable / Total Current
Liabilities
5.8.1. 1 Net Working Capital:
Net Working Capital, although not actually a ratio is a common measure of a firm’s overall
liquidity. A measure of liquidity is calculated by subtracting total current liabilities from total
current assets.
Net Working Capital =Total Current Assets –Total Current Liabilities.
5.8.1. 2 Current Ratio:
One of the most general and frequently used of these liquidity ratios is the current ratio.
Organizations use current ratio to measure the firm’s ability to meet short-term obligations. It
shows the bank’s ability to cover its current liabilities with its current assets. The current ratio
is equal to (current assets) / (current liabilities). Current assets are assets that should be
convertible to cash within a year. Current liabilities are debt obligations that are due within a
year. The current ratio is current assets divided by current liabilities, and measures the
liquidity of a company over a short time period. Even if a company has a great business, no
long-term debt, tons of cash flow, and a great brand, it can still fall into a lot of trouble if it
doesn’t keep enough short-term cash available to cover its immediate needs. The higher the
current ratio, the safer and more liquid the company is in terms of short-term needs.
Current Ratio = Current Asset/Current Liabilities
Standard ratio: 2:1
5.10.1.3 Quick Ratio:
The quick ratio is a much more exacting measure than current ratio. This ratio shows a firm’s
ability to meet current liabilities with its most liquid assets. The quick ratio is equal to
(current assets – inventories) / current liabilities. It’s the same as the current ratio except that
it doesn’t count inventories in the asset category. This means that the quick ratio is a more
“Financial Performance Analysis: AStudyonJanataBank Ltd.”
Department of Accounting and Information Systems, Comilla University. Page | 27
conservative estimate of liquidity than the current ratio. The reason inventories are excluded
is because depending on the company and its products, inventories may not be readily
convertible into cash. The higher the quick ratio, the safer and more liquid the company is in
terms of short-term needs.
Quick Ratio=Cash + Government Securities + Receivable / Total Current Liabilities.
Standard ratio: 1:1
5.8.1.4 Operating Cost to Income Ratio:
It measures a particular Bank’s operating efficiency by measuring the percent of the total
operating income that the Bank spends to operate its daily activities. It is calculated as
follows:
Cost Income Ratio = Total Operating Expenses / Total Operating Income
5.8.2 Analyzing Activity:
Activity ratios measure the speed with which accounts are converted into sale or cash. With
regard to current accounts measures of liquidity are generally inadequate because differences
in the composition of a firm’s current accounts can significantly affects its true liquidity.
A number of ratios are available for measuring the activity of the important current accounts,
which includes inventory, accounts receivable, and account payable. The activity (efficiency
of utilization) of total assets can also be assessed.
5.8.2.1 Total Asset Turnover:
The total asset turnover indicates the efficiency with which the firm is able to use all its assets
to generate sales.
Total Asset Turnover = Sales/ Total Asset
5.8.2.2 Investment to Deposit Ratio:
Investment to Deposit Ratio shows the operating efficiency of a particular Bank in promoting
its investment product by measuring the percentage of the total deposit disbursed by the Bank
as long and advance or as investment. The ratio is calculated as follows:
Investment to Deposit Ratio = Total Investments / Total Deposits
5.8.2.3 Inventory Turnover:
A ratio showing how many times a company's inventory is sold and replaced over a period.
“Financial Performance Analysis: AStudyonJanataBank Ltd.”
Department of Accounting and Information Systems, Comilla University. Page | 28
Inventory Turnover= Cost of goods sold/ Average Inventory
The days in the period can then be divided by the inventory turnover formula to calculate the
days it takes to sell the inventory on hand or "inventory turnover days". This ratio should be
compared against industry averages. A low turnover implies poor sales and, therefore, excess
inventory. A high ratio implies either strong sales or ineffective buying. High inventory
levels are unhealthy because they represent an investment with a rate of return of zero. It also
opens the company up to trouble should prices begin to fall.
5.8.2.4 Average Collection Period:
Average collection period is useful in evaluating credit and collection policies. This ratio also
measures the quality of debtors. It is arrived at by dividing the average daily sales into the
accounts receivable balance: Average Collection Period=Accounts receivable/ (Credit
sales/365)
A short collection period implies prompt payment by debtors. It reduces the chances of bad
debts. Similarly, a longer collection period implies too liberal and inefficient credit collection
performance. It is difficult to provide a standard collection period of debtors.
5.8.2.5 Average Payment Period:
Average payment period ratio gives the average credit period enjoyed from the creditors that
means it represents the number of days by the firm to pay its creditors. A high creditor’s
turnover ratio or a lower credit period ratio signifies that the creditors are being paid
promptly. This situation enhances the credit worthiness of the company. However a very
favorable ratio to this effect also shows that the business is not taking the full advantage of
credit facilities allowed by the creditors. It can be calculated using the following formula:
Average Payment Period=Accounts payable/ Average purchase per day
5.8.2.6 Fixed Asset Turnover:
A financial ratio of net sales to fixed assets. The fixed-asset turnover ratio measures a
company's ability to generate net sales from fixed-asset investments - specifically property,
plant and equipment (Paande) - net of depreciation. A higher fixed-asset turnover ratio shows
that the company has been more effective in using the investment in fixed assets to generate
revenues. The fixed-asset turnover ratio is calculated as:
Fixed Asset Turnover=Gross Turnover/ Net fixed assets
“Financial Performance Analysis: AStudyonJanataBank Ltd.”
Department of Accounting and Information Systems, Comilla University. Page | 29
Importance of Activity Ratios:
Credit to Deposit Ratio: A commonly used statistic for assessing a bank's liquidity by
dividing the banks total loans by its total deposits. This number, also known as the LTD ratio,
is expressed as a percentage. If the ratio is too high, it means that banks might not have
enough liquidity to cover any unforeseen fund requirements; if the ratio is too low, banks
may not be earning as much as they could be.
Cost Income Ratio: Cost/Income ratio is the ratio between operating expenses and operating
income. It is a measure of how costs are changing compared to income. It is one of the main
key performance indicators of a bank's efficiency: the lower the ratio the more efficient the
bank.
Calculation of Average Collection Period: Also termed as Accounts receivable turnover,
Average Collection Period is used to determine the duration of the average sales that a
particular customer holds. A company can hope for larger investment in assets if the duration
of collection period is longer. To measure the Average Collection period, net sales for each
day or average daily sales should be calculated for a year. Now the average collection period
will be calculated by diving each Average Daily sales into the account receivable.
Definition for Inventory Turnover: Inventory turnover also falls under Activity Ratio
which is used to calculate how many times investments or a firm in inventory turns over
during a particular year. This ratio can be used to calculate the industry average. Companies
prefer to choose High turnover ratios as it requires smaller investments in inventory. A firm
must divide its cost of goods sold by inventory to calculate the inventory turnover.
Definition for Fixed Asset Turnover: This is also termed as Total Asset Turnover which is
basically used to calculate how a company’s fixed asset generates sales. Fixed assets can
include buildings and land. An organization will have much investment in fixed sales if they
opt for a low fixed asset turnover. A company should divide its sales by fixed assets in order
to calculate its Fixed Asset Turnover.
Usage in Activity Ratios in Business: Activity ratios help investors and managers to
understand the current performance of their company. It also provides them necessary
comparisons with competitors in the industry to understand where they are standing right
now. Activity Ratio also provides a firm with successful historical trends followed in order to
execute any change for business improvement. Activity Ratios also reduce the job of Fixed
Asset management, which in turn helps the auditors to perform audits faster.
5.8.3 Analyzing Debt:
The debt position indicates the amount of other people’s money being used in attempting to
generate profits. In general, the more debt a firm uses in relation to its total assets, the greater
its financial leverage, a term use to describe the magnification of risk and return introduced
through the use of fixed-cost financing such as debt and preferred stock.
“Financial Performance Analysis: AStudyonJanataBank Ltd.”
Department of Accounting and Information Systems, Comilla University. Page | 30
5.8.3.1 Debt Ratio:
The debt ratio measures the proportion of total assets provided by the firm’s creditors.
Debt Ratio = Total Liabilities / Total Assets
5.8.3.2 Equity Capital Ratio:
The ratio shows the position of the Bank’s owner’s equity by measuring the portion of total
asset financed by the shareholders invested funds and it is calculated as follows:
Equity Capital Ratio = Total Shareholder’s Equity / Total Assets
The Ability to Service Debt:
It refers the ability of a firm to meet the contractual payments required on a scheduled basis
over the life of a debt. The firm’s ability to meet certain fixed charges is measured using
coverage ratios.
5.8.3.3 Time Interest Earned Ratio:
This ratio measures the ability to meet contractual interest payment that means how much the
company able to pay interest from their income.
Time Interest Earned Ratio=EBIT/ Interest
The Importance of Debt in an Investment:
When it comes to investing in dividend stocks, most people focus on things like growth
levels, valuation (P/E), and stock dividends. A wise investor, however, also considers the
debt levels of the company that he or she invests in. Debt levels in an organization are not
emphasized enough in my opinion so this article shows a few things on the subject.
5.8.4 Analyzing Profitability:
These measures evaluate the bank’s earnings with respect to a given level of sales, a certain
level of assets, the owner’s investment, or share value. Without profits, a firm could not
attract outside capital. Moreover, present owners and creditors would become concerned
about the company’s future and attempt to recover their funds. Owners, creditors, and
management pay close attention to boosting profits due to the great importance placed on
earnings in the marketplace.
5.8.4.1 Operating Profit Margin:
The Operating Profit Margin represents what are often called the pure profits earned on each
sales dollar. A high operating profit margin is preferred. The operating profit margin is
calculated as follows:
Operating Profit Margin = Operating Profit / Sales
“Financial Performance Analysis: AStudyonJanataBank Ltd.”
Department of Accounting and Information Systems, Comilla University. Page | 31
5.8.4.2 Net Profit Margin:
The net profit margin measures the percentage of each sales dollar remaining after all
expenses, including taxes, have deducted. The higher the net profit margin is better. The net
profit margin is calculated as follows:
Net p rofit Margin = Net profit after Taxes / Sales
5.8.4.3 Return on Asset (ROA):
Return on asset (ROA), which is often called the firms return on total assets, measures the
overall effectiveness of management in generating profits with its available assets. The higher
ratio is better. An indicator of how profitable a company is relative to its total assets. ROA
gives an idea as to how efficient management is at using its assets to generate earnings.
Calculated by dividing a company's annual earnings by its total assets, ROA is displayed as a
percentage. Sometimes this is referred to as "return on investment".
Return on Asset (ROA) = Net profit after Taxes / Total Assets
5.8.4.4 Return on Equity (ROE):
The Return on Equity (ROE) measures the return earned on the owners (both preferred and
common stockholders) investment. Generally, the higher this return, the better off the owners.
The amount of net income returned as a percentage of shareholders equity. Return on equity
measures a corporation's profitability by revealing how much profit a company generates
with the money shareholders have invested.
Return on Equity (ROE) =Net profit after Taxes / Stockholders Equity
5.8.4.5 Price/ Earnings Ratio (P-E ratio):
The Price/ Earnings ratio (price-to-earnings ratio) of a stock is a measure of the price paid for
a share relative to the income or profit earned by the firm per share.
P/E ratio - Price per share / Earnings per share
“Financial Performance Analysis: AStudyonJanataBank Ltd.”
Department of Accounting and Information Systems, Comilla University. Page | 32
5.8.4.6 Earnings per Share (EPS):
Earnings per share (EPS) are the earnings returned on the initial investment amount.
EPS= Net income/No. of shares outstanding
Importance ofProfitability Ratio:
 Simple to use and understand.
 The element of NPV in the venture will indicate which venture is more powerful as
the most profitable venture will have the highest P.I. as the difference or net P.I. will
continue to the company’s profitability.
 It acknowledges time value for money and at the same time the NPV of a venture at
its present value which is consistent with investment appraisal requirements.
“Financial Performance Analysis: AStudyonJanataBank Ltd.”
Department of Accounting and Information Systems, Comilla University. Page | 33
6.1 Ratio Analysis
6.1.1 Liquidity Ratio:
6.1.1.1 Current Ratio:
The current ratio, one of the most commonly cited financial ratios, measures the firm’s ability
to meet its short term obligations. The higher the current ratio, the better the liquidity position
of the firm. It is expressed as:
(Current Assets/Current Liabilities)
Year Ratio
2013 1.05
2012 1.01
2011 1.04
2010 1.03
2009 1.07
Table: Current Ratio of JBL
Graphical Presentation:
Figure: Current Ratio of JBL
Interpretation:
The higher the current ratio; the more liquid the firm is considered to be. But JBL, Current
ratio is good because it maintains 1.05tk current assets against 1tk current liabilities whereas
normally banking industry maintains 2:1 current ratio. This graph shows that, the current
ratio is increased in year 2009 and decreased the following year.
0.95
1
1.05
1.1
2 0 0 9 2 0 1 0 2 0 1 1 2 0 1 2 2 0 1 3
1.07
1.03 1.04
1.01
1.05
Current Ratio
Year
“Financial Performance Analysis: AStudyonJanataBank Ltd.”
Department of Accounting and Information Systems, Comilla University. Page | 34
6.1.1.2 Net Working Capital
Net working capital, although not actually a ratio is a common measure of a firm’s overall
Liquidity a measure of liquidity ratio calculated by.
Net Working capital=Current Asset-Current Liabilities
Table: Net Working Capital of JBL
Graphical Presentation:
Figure: Net Working Capital of JBL
Interpretation:
Net working capital of JBL is slightly decreased during the last two years. However, the bank
faced problems to meet up its current obligations. So the Bank should increase its Current
asset.
3238.93 3423.33 3365.65
2604.31
3147.34
0
500
1000
1500
2000
2500
3000
3500
4000
2009 2010 2011 2012 2013
Net working capital
Years
Year Net working Capital
(taka in Millions)
2013 3147.34
2012 2604.31
2011 3365.65
2010 3423.33
2009 3238.93
“Financial Performance Analysis: AStudyonJanataBank Ltd.”
Department of Accounting and Information Systems, Comilla University. Page | 35
6.1.1.3 Acid Test Ratio:
A stringent indicator that determines whether a firm has enough short-term assets to cover its
immediate liabilities without selling inventory. The acid-test ratio is far more strenuous than
the working capital ratio, primarily because the working capital ratio allows for the inclusion
of inventory assets. It is expressed as:
Acid Test Ratio :( Cash, Short-term Investments & Receivable / Current Liabilities)
Year Ratio
2013 0.34
2012 0.36
2011 0.35
2010 0.29
2009 0.33
Table: Acid Test Ratio of JBL
Graphical Presentation
Figure: Acid Test Ratio of JBL
Interpretation:
Companies with ratios of less than 1 cannot pay their current liabilities and should be looked
at with extreme caution. Furthermore, if the acid-test ratio is much lower than the working
capital ratio, it means current assets are highly dependent on inventory
0.33 0.29
0.35 0.36 0.34
0
0.1
0.2
0.3
0.4
2009 2010 2011 2012 2013
AcidTest Ratio
Year
“Financial Performance Analysis: AStudyonJanataBank Ltd.”
Department of Accounting and Information Systems, Comilla University. Page | 36
The standard ratio is 1:1. But the Acid test ratio of JBL is poor than standard. To improve this
ratio, the JBL has to increase the cash, short-term investments & receivable and reduce the
current liability.
6.1.2 Analyzing Activity Ratio:
6.1.2.1 Operating Expenses to Revenue (OER):
A ratio that shows the efficiency of a company's management by comparing operating
expense to net sales. Calculated as:
Operating Expenses to Revenue =Total Operating Expenses/ Operating Income
(revenue)
Year Ratio
2013 57.16%
2012 62.94%
2011 57.81%
2010 44.00%
2009 36.04%
Table: Operating Expenses to Revenue
Graphical Presentation:
Figure: Operating Expenses to Revenue
Interpretation:
We know that this ratio measures the operating efficiency of the bank by measuring the
portion if the total operating costs relative to the total operating income of that bank and the
36.04%
44.00%
57.81%
62.94%
57.16%
0.00%
20.00%
40.00%
60.00%
80.00%
2009 2010 2011 2012 2013
Operating expense to revenue
Years
“Financial Performance Analysis: AStudyonJanataBank Ltd.”
Department of Accounting and Information Systems, Comilla University. Page | 37
higher the ratio, the lower the operating efficiency. In 2009 the operating cost of JBL is low
but after that it increasing. So it can be said that the operating efficiency of the JBL is not in
good position compared to the past years that is they are not in good position to minimize
their operating cost.
6.1.2.2 Total Asset Turnover Ratios:
The total asset turnover indicates the efficiency with which the firm is able to use all its assets
to generate sales. Calculated as:
Total Asset Turnover= Operating Income/Total Asset
Year Ratio
2013 4.23%
2012 3.48%
2011 3.95%
2010 5.34%
2009 4.48%
Table: Total Asset Turnover of JBL
Figure: Total Asset Turnover of JBL
Interpretation:
0.00%
1.00%
2.00%
3.00%
4.00%
5.00%
6.00%
2009
2010
2011
2012
2013
4.48%
5.34%
3.95%
3.48%
4.23%
Total asset turnover
Years
“Financial Performance Analysis: AStudyonJanataBank Ltd.”
Department of Accounting and Information Systems, Comilla University. Page | 38
The banks total asset turnover ratio in 2009 - 2013 that is 4.5 to 4.2 times. We know the
greater the total asset turnover, it is more efficient and 4 to 6 times is standard position but
also depends on industry. JBL’s total asset turnover ratio is fluctuating year by year but in
2013 it’s increasing which is good sign for the bank.
6.1.2.3 Operating Expenses to Assets Ratio:
The expense ratio of an asset fund is the total percentage of fund assets used for
administrative, management, advertising and all other expenses. An expense ratio of 1% per
annum means that each year 1% of the fund's total assets will be used to cover
expenses. Calculated as:
Operating Expense to Assets (OEA) =Total operating Expenses/ Total Assets
Year Ratio
2013 2.42%
2012 2.19%
2011 2.28%
2010 2.35%
2009 1.74%
Table: Operating Expense to Assets of JBL
Graphical Presentation:
Figure: Operating Expense to Assets of JBL
Interpretation:
1.74%
2.35% 2.28%
2.19%
2.42%
0.00%
0.50%
1.00%
1.50%
2.00%
2.50%
3.00%
2009 2010 2011 2012 2013
Operating expense to assets ratio
Years
“Financial Performance Analysis: AStudyonJanataBank Ltd.”
Department of Accounting and Information Systems, Comilla University. Page | 39
Expense ratios are important to consider when choosing a fund, as they can significantly
affect returns. From the chart we see that there is an increase trend of operating expense to
assets ratio. In 2009 the ratio is only 1.74% but It increased to 2.42% in the year 2013. That
means operating expenses are increasing compared to previous years.
6.1.3 Analyzing Debt Ratio:
6.1.3.1 Debt Ratio:
The debt ratio measures the preparation of total assets provided by the firm’s creditors.
Debt ratio= Total Liabilities/Total Assets
Year Ratio
2013 0.945
2012 0.947
2011 0.936
2010 0.927
2009 0.930
Table: Debt Ratio ofJBL
Graphical Presentation:
Figure: Debt Ratio ofJBL
Interpretation:
0.93
0.927
0.936
0.947
0.945
0.915
0.92
0.925
0.93
0.935
0.94
0.945
0.95
2 0 0 9 2 0 1 0 2 0 1 1 2 0 1 2 2 0 1 3
DEBT RATIO
Years
“Financial Performance Analysis: AStudyonJanataBank Ltd.”
Department of Accounting and Information Systems, Comilla University. Page | 40
The higher the ratio, the greater risk will be associated with the firms operations. In addition,
high debt to asset ratio indicates low borrowing capacity of a firm, which in turn will lower
the firm’s financial flexibility. This graph shows that, the debt ratio was increasing year by
year. The Debt ratio measures the proportion of total assets provides by the firm’s creditors.
Their debt ratio was increasing trend that indicates negative sign.
6.1.3.2 Times Interest Earned Ratio:
The times interest earned ratio, sometimes called the interest coverage ratio, measures the
firm’s ability to make contractual interest payments.
Times Interest Earned Ratio =Earnings before Interest and Taxes/Interest Expense
Year Ratio
2013 1.16
2012 1.10
2011 1.20
2010 1.37
2009 1.40
Table: Times Interest Earned Ratio of JBL
Graphical Presentation:
Table: Times Interest Earned Ratio of JBL
Interpretation:
0
0.2
0.4
0.6
0.8
1
1.2
1.4
2009
2010
2011
2012
2013
1.4
1.37
1.2
1.1 1.16
Times interest earned ratio
Years
“Financial Performance Analysis: AStudyonJanataBank Ltd.”
Department of Accounting and Information Systems, Comilla University. Page | 41
Time Interest earned ratio on JBL’s is satisfying but in last three years it was slightly
decreasing. So JBL should maintain high ratio by minimizing its operating costs in order to
get adequate earnings to satisfying interest obligations. A high ratio can indicate that a
company has an unwanted lack of debt or is paying down too much debt with earnings that
could be used for other projects. It measures the ability to meet interest payments as they
come due.
6.1.4 Analyzing Profitability Ratio:
6.1.4.1 Investment to Deposit Ratio: It is expressed as:
Investment to Deposit Ratio=Total Investment/Total Deposit
Year Ratio
2013 0.303
2012 0.306
2011 0.328
2010 0.198
2009 0.225
Table: Investment to Deposit Ratio of JBL
Graphical Presentation:
Figure: Investment to Deposit Ratio of JBL
Interpretation:
Investment to Deposit Ratio shows that the amount of deposit which is used to as investment.
JBL’s investment to deposit ratio is increasing year by year. That means, Bank is properly
utilizing their deposit.
0.225
0.198
0.324
0.306 0.303
0
0.05
0.1
0.15
0.2
0.25
0.3
0.35
2009 2010 2011 2012 2013
Investment to deposit ratio
Years
“Financial Performance Analysis: AStudyonJanataBank Ltd.”
Department of Accounting and Information Systems, Comilla University. Page | 42
6.1.4.2 Net Profit Margin:
The net profit margin measures the percentage of each sales dollar remaining after all
expenses, including taxes, have deducted. The higher the firm’s net profit margin is better.
The net profit margin is a commonly cited measure of the company’s success with respect to
earnings on sales
Net Profit Margin=Net Profit After Tax/Operating Income
Year Ratio
2013 0.165811
2012 0.147800
2011 0.200434
2010 0.267133
2009 0.352562
Table: Profit Margin Ratio of JBL
Graphical Presentation:
Figure: Profit Margin Ratio of JBL
0.352562
0.267133
0.200434
0.1478
0.165811
0
0.05
0.1
0.15
0.2
0.25
0.3
0.35
0.4
2009 2010 2011 2012 2013
Profit margin Ratio
Years
“Financial Performance Analysis: AStudyonJanataBank Ltd.”
Department of Accounting and Information Systems, Comilla University. Page | 43
Interprétation:
The Bank net profit margin in 2009-2013 that is (0.35-0.16) which indicates that profit
margin is decreasing day by day and it’s not good situation. JBL’s net profit margin is
decreasing which indicates that the banks profit is decreasing. The standard of profit margin
ratio is 0.075, from the above graph we see that the JBL profit margin ratio is higher than the
standard but it is decreasing in nature.
6.1.4.3 Return on Asset (ROA):
The return on asset (ROA), which is often called the firm’s return on total assets, measures
the overall effectiveness of management in generating profits with its available assets. The
higher the ratio is better
Return on Asset (ROA) =Net Profit after Tax/Total Asset
Year Ratio
2013 0.60%
2012 0.30%
2011 0.75%
2010 1.31%
2009 1.50%
Table: Rate of Return on Assets of JBL
Graphical Presentation:
0.00%
0.20%
0.40%
0.60%
0.80%
1.00%
1.20%
1.40%
1.60%
2009
2010
2011
2012
2013
1.50%
1.31%
0.75%
0.30%
0.60%
Return on assets
Years
“Financial Performance Analysis: AStudyonJanataBank Ltd.”
Department of Accounting and Information Systems, Comilla University. Page | 44
Interpretation:
Return on Asset (ROA) as an indicator of managerial efficiency, indicates the capability of
management in converting the institution’s assets into net earnings. The banks return on asset
decreasing from 1.50% to 0.60% in the preceding 5years. So the JBL earn less profit from the
assets. This is not good for the bank. But in 2013 ROA is goes up than in 2012, it’s a good
condition for the bank. To improve the ratio, the JBL has to increase the net income and
control average total asset.
6.1.4.4 Return on Equity (ROE):
The return on equity measures the return earned on the owner’s (both preferred and common
stockholders’) investment. Generally higher the return indicates the better condition of the
owner’s.
Return on Equity=Net Profit after Tax/ Shareholders Equity
Year Ratio
2013 10.61%
2012 7.00%
2011 13.14%
2010 18.57%
2009 22.27%
Table: Return on Equity of JBL
Graphical Presentation:
Figure: Return on Equity of JBL
Interpretation:
22.27%
18.57%
13.14%
7.00%
10.61%
0.00%
5.00%
10.00%
15.00%
20.00%
25.00%
2 0 0 9 2 0 1 0 2 0 1 1 2 0 1 2 2 0 1 3
RETURN ON EQUITY
Years
“Financial Performance Analysis: AStudyonJanataBank Ltd.”
Department of Accounting and Information Systems, Comilla University. Page | 45
ROE is the measurement of rate of return flowing to the bank’s shareholders. It measures the
net benefit that the stockholders have received from investing their capital in the bank.
Higher ROE indicates the favorable position that the company is efficient in generating
income on new investment. The banks return on equity deviates from 7% to 22.27%. In the
preceding 5 years and the highest value can be observed in 2009 and the lowest value can be
observed during the 2012, which is not desirable. The positive side is the ratio is increased by
3.61% from the preceding year. So the management should work hard to increase the return
associated with equity.
6.1.4.5 Earnings per Share:
The firm’s Earning per share (EPS) are generally of interest to present or prospective
stockholders and management. The Earning per share represent the number of dollars earned
on behalf of each outstanding share of common stock. The earnings per share is calculated as
follows
Earnings per Share =Earnings Available for Common stock Holder/No of shares of
Common Stock Outstanding
Year EPS
2013 2.15
2012 1.34
2011 2.75
2010 3.14
2009 3.5
Table: EPS of JBL
Graphical Presentation:
0
1
2
3
4
2009
2010
2011
2012
2013
3.5
3.14
2.75
1.34
2.15
Earning per share
Years
“Financial Performance Analysis: AStudyonJanataBank Ltd.”
Department of Accounting and Information Systems, Comilla University. Page | 46
Figure: EPS of the JBL
Interpretation: EPS represents that it is earned on behalf of each outstanding shares of
common stock equity. EPS is closely watched by investors because it is an important
indicator of corporate success. The graph shows that, in 2009 earnings per share of JBL’s are
higher than 2011 and 2012. EPS is decreasing that means bank’s operating result is also
decreasing. But the year 2013 was the desirable year for the JBL. The year 2013 shows the
increasing nature of EPS that is a good sign for the company.
6.1.4.6 Price Earnings Ratio:
The price or earning (P/E) ratio is commonly used to assess the owners’ appraisal of share
value. The P/E represents the amount investors are willing to pay for each dollar of the firm’s
earnings. The higher the P/E ratio, the greater the investor’s confidence in the firm’s future.
The price Earning (P/E) ratio is calculated as follows:
Price Earnings Ratio=Market Price per Share/Earnings per Share
Year Ratio
2013 8.50
2012 14.55
2011 7.04
2010 5.79
Table: Price Earnings Ratio of JBL
Graphical Presentation:
5.79
7.04
14.55
8.5
0
2
4
6
8
10
12
14
16
2010 2011 2012 2013
Price earnings ratio
Years
“Financial Performance Analysis: AStudyonJanataBank Ltd.”
Department of Accounting and Information Systems, Comilla University. Page | 47
Figure: Price Earnings Ratio of JBL
Interpretation:
The graph shows that, the price earnings ratio of JBL was good in year 2012 which represents
the 14.55%. In the last year 2013 price earnings ratio was decreased to only 8.5% which is
not satisfactory. To improve the ratio, the JBL has to increase market price per share and
reduce earnings per share. This graph shows price earnings ratio that is increasing F.Y 2011 to
2012 and slight decreasing from 2012 to 2013.
6.2 Vertical/ Common Size Analysis
Vertical/Common size statements came from the problems in comparing the financial
statements of firms that differ in size. In the balance sheet, for example, the assets as well as
the liabilities and equity are each expressed as a 100% and each item in these categories is
expressed as a percentage of the respective totals. In the common size income statement,
turnover is expressed as 100% and every item in the income statement is expressed as a
percentage of turnover (sales). Here bank has no sales so that I have considered the
operating income as 100%.
Balance sheet
As on December 31, 2013 & 2012
Common size Balance
sheet
Particulars 2013(In million) 2012(In million) 2013 2012
Property and
Assets
Cash:
Cash in hand
Balance with
Bangladesh
bank& agent
bank
6171.51
27346.37
5840.11
25974.24
1.05%
4.66%
1.14%
5.08%
33517.80 31814.35 5.71% 6.22%
Balance with other
banks and Financial
Institution 13011.20 12776.74 2.22% 2.49%
Money at call and
short notice
1528.57 6581.96 0.26% 1.28%
Investments 193269.67 108342.04 32.97% 21.19%
Loans and Advances 285747.65 305339.58 48.75% 59.73%
Fixed Assets 9724.84 9462.69 1.65% 1.85%
“Financial Performance Analysis: AStudyonJanataBank Ltd.”
Department of Accounting and Information Systems, Comilla University. Page | 48
Other Assets
Non-banking Assets
49283.17 36812.05 8.40% 7.20%
Total Property
and Assets
586082.98 511129.41 100% 100%
Liabilities and
shareholder’s equity
Capital
Borrowing from
other banks
8659.23 11310.47 1.47% 2.21%
Deposit and other
Accounts
478535.57 409767.01 81.64% 80.16%
Other Liabilities 61771.99 72575.25 10.53% 14.19%
Total Liabilities 548966.78 493652.74 92.17% 94.35%
Capital/Shareholders
Equity
37116.20 17476.66 6.33% 3.41%
Total liabilities and
shareholders’ equity
586082.98 511129.41 100% 100%
From the vertical analysis above, we can compare the percentage mark-up of asset items
and how they have been financed. The strategies may include increase/decrease the holding
of certain assets. The analyst may as well observe the trend of the increase in the assets and
liabilities over several years. It can be observed that there is an increase in the holding of the
current assets of the company. The management can seek the reasons of why the holding of
these assets is continuously increasing. Though both the assets and liabilities are increasing
but proportionately liabilities were a little higher than the assets, which may make some
ratio lower. The above analysis also shows that total liabilities has increased so as stock
holder’s equity , which indicates that JBL has more debt financing than equity.
“Financial Performance Analysis: AStudyonJanataBank Ltd.”
Department of Accounting and Information Systems, Comilla University. Page | 49
Profit and Loss Account
For the year ended December 31, 2013 & 2012
Common size Profit and
Loss Account
Particulars 2013 2012 2013 2012
Total Operating
Income
20859.03 22016.47 100% 100%
Less: Total
Operating
Expenditure
8731.92 7482.67 72% 51.48%
Profit Before
Provision
12127.11 14533.8 28% 48.52%
Less: Provision 1501.78 27368.70 7.19% (124.31%)
Profit Before Tax 10625.33 (12834.9) 20.81% (75.79%)
Less: Provision for
Tax
1073.92 2445.43 5.14% 11.10%
Net Profit After Tax 9551.41 (15280.33) 15.67% (86.89%)
Add: Retained
Surplus Brought
Forward
1967.20 7.57 9.43% 0.03%
11518.61 (15272.76) 25.10% (86.86)
A second method of common size analysis is a means of comparing figures within a single
P & L. A common size profit and loss statement, for example, compares all components of
the P & L to total operating income. In other words, Total operating income is defined as
“100%” and all other figures on the statement are expressed as a percentage of that. In this
way, we not only get an automatic indication of approximate profit margin, we also can see
the importance of all of your costs and expenses relative to operating income. Vertical
analysis can also be done on these common size percentages in order to identify trends in
the relative sizes of categories like costs, expenses, or margins. The above analysis shows
that JBL has higher net operating income in 2012 than 2013 and after tax net profit has
increased in 2013 compared to 2012’s negative figure. On the other hand they paid higher
“Financial Performance Analysis: AStudyonJanataBank Ltd.”
Department of Accounting and Information Systems, Comilla University. Page | 50
tax in 2013. In the year 2013 JBL has comparatively higher expenditure, but marginally
lower percentage, which is good sign for the bank.
6.3 Horizontal/ Trend Analysis
It is conducted by setting consecutive balance sheet, income statement or statement of cash
flow side-by-side and reviewing changes in individual categories on a year-to-year or multi
year basis. The most important item revealed by comparative financial statement analysis is
trend.
Percentage change= (recent year-previous year)/previous year
Items (Figure in
million)
2013 % 2012 % 2011
Paid up Capital 19140.00 .74% 11000 0.35% 8125
Shareholders'
Equity
37116.60 1.12 17476.66 (.48%) 34069.20
Total assets 586082.98 .14% 511129.41 .14% 446111.42
Total deposits 478,535.57 .16% 409,767.01 .13% 361702.03
Total loans
&Advances
285,747.65 (.06%) 305,339.57 0.18% 258202.07
Total
Investment
193269.67 .78% 108342.04 .16% 92826.25
Operating
Income
20859.03 (.05%) 22016.47 (.04%) 23084.21
Operating
expenditure
8731.92 .16% 7482.67 .03% 7224.55
Profit Before
Provision
12127.11 (.16%) 14533.8 (.02%) 14859.65
Profit Before
Tax
10625.33 (1.82%) (12834.9) (2.47%) 8684.89
Total Provision 1501.78 (.94%) 27368.70 3.43% 6174.76
Net Profit After
Tax
9551.41 (1.62%) (15280.33) (4.62%) 4214.53
“Financial Performance Analysis: AStudyonJanataBank Ltd.”
Department of Accounting and Information Systems, Comilla University. Page | 51
A comparison of statements over several years reveals direction, speed and extent of a
trend(s). The horizontal financial statements analysis is done by restating amount of each
item or group of items as a percentage. Such percentages are calculated by selecting a base
year and assign a weight of 100 to the amount of each item in the base year statement.
Thereafter, the amounts of similar items or groups of items in prior or subsequent financial
statements are expressed as a percentage of the base year amount. The resulting figures are
called index numbers or trend ratios. The above analysis shows that JBL performance trend
is quite better in 2013. Their capital was higher in 2013 as well as stockholders equity has
also increased compared to 2012.
6.4 Eva Analysis
Statement of Value Added and it’s Distribution Analysis:
This shows that how the wealth is distributed among the stakeholders of JBL as well as how
JBL has generated wealth by providing banking services, by taking into account the amount
retained and re-invested for replacement and improvement of assets operations consequently.
The comparative presentation of value added statement of the bank for the year 2013 and
2012 is illustrated below:
Value added statement
Particulars 2013
(In million)
2012
(In million)
Income from banking
services
Less: Cost of services
Value added from
banking services
Add: Non-banking
income
Less: Provisions made
for the year
Total Value Added
Distribution of Value
Addition:
To employees
(Salary, allowances
and others)
To government
55,071
(36,455)
18,616
(1,502)
17,114
6,104
1,074
49,516
(29,334)
20,182
(27,369)
(7,187)
(7,187)
5,320
“Financial Performance Analysis: AStudyonJanataBank Ltd.”
Department of Accounting and Information Systems, Comilla University. Page | 52
(Income Tax)
To statutory reserve
To expansion & growth
i) Depreciation
ii) Retained Profit
Total distribution
1,967
385
7,584
17,114
2,445
328
(15,288)
(7,187)
Fig: Distribution of value addition in 2013
Economic Value Added Analysis:
Economic value added (EVA) is a performance tool developed to measure the true economic
profit produced by a company. It also frequently refers to as "economic profit", and provides
a measurement of a Bank's economic success (or failure) over period of time. Such a metric is
useful for shareholders’ who wish to determine how well the bank has produced value forts
investors, and it can be compared against the Banks’ peers for a quick analysis of how well
the bank is operating.
Economic Value Added Statement
Particulars 2013 2012 2011
Shareholders’ Equity
Add: Cumulative provision
37,116.20 17,476.66 34,069.20
36%
6%
12%
2%
44%
Distribution of value addition in 2013
Salaries allowance and others Income tax Statutory reserve Depreciation Retained profit
“Financial Performance Analysis: AStudyonJanataBank Ltd.”
Department of Accounting and Information Systems, Comilla University. Page | 53
for loans, investment and off-
balance sheet exposures
Total Invested Fund
Average shareholders’ equity
Earnings :
Profit after tax
Add: Provision for loans and
others during the year
Less: Written-off loan
recovered during the year
Earning for the year :
Average cost of equity
(based on weighted average
rate of 10 years treasury bond
issued by Bangladesh
Government + 2% risk
premium)
Cost of average equity
Economic value added
Growth over last year
23,539.82
60,656.02
25,121.93
9,551.39
1,501.77
(42.62)
11,010,54
13.00%
3,265.85
7,744.69
16.97%
35,260.09
52,736.75
32,745.73
(15,280,34)
27,368,70
(883.10)
11,205.26
14.00%
4,584.40
6,620.86
7.29%
12,797.45
46,866.65
25,368.09
4,444.91
5,846.65
(918.77)
9,372.79
12.75%
3234.43
6,138.36
5.21%
“Financial Performance Analysis: AStudyonJanataBank Ltd.”
Department of Accounting and Information Systems, Comilla University. Page | 54
Fig: Economic Value Added
6.5 MarketValue Analysis
Market value added (MVA) is simply the difference between the current total market value of
a company and the capital contributed by investors. As a wealth metric it measures the level
of value, the bank has accumulated over time. The formula used to find market value added
is:
Market Value Added = Market Value - Capital Invested
Since JBL is not enlisted in share market, so it is not possible to calculate MVA in a regular
method.
Calculation of Market Value Added:
Particulars Number of share Value per share
(Tk.)
Amount
(BDT in million)
Intensive value per
share
Book value
1,91,400,000
1,91,400,000
193.92
100
37,116,202,498
19,140,000,000
0
1000
2000
3000
4000
5000
6000
7000
8000
2011 2012 2013
6138
6621
7745
Economic value added
(In million)
“Financial Performance Analysis: AStudyonJanataBank Ltd.”
Department of Accounting and Information Systems, Comilla University. Page | 55
Market value added 1,91,400,000 93.92 17,976,202,498
6.6 SWOT Analysis
6.6.1 Introduction of SWOT Analysis:
SWOT Analysis is an important tool for evaluating the company’s Strengths, Weaknesses,
Opportunities and Threats. It helps the organization to identify how to evaluate its
performance and can scan the macro environment, which is turn would help the organization
to navigate in the Turbulence Ocean of competition. SWOT analysis is commonly used in
marketing and business in general as a method of identifying opposition for a new venture or
strategy. Short for Strengths, Weaknesses, Opportunities and Threats, this allows
professionals to identify all of the positive and negative elements that may affect any new
proposed actions. SWOT analysis of Janata Bank Ltd is given below:
“Financial Performance Analysis: AStudyonJanataBank Ltd.”
Department of Accounting and Information Systems, Comilla University. Page | 56
6.6.2 Strengths:
 Large customer base.
 Strong capital and asset quality.
 The bank is financially safe.
 Community involvement.
 Speedy foreign remittance payment system with Western Union Money Transfer.
 The Image/Goodwill of the bank is very good.
 The bank has huge amount of deposit and market potentiality.
 Regulatory performance is strong and positive.
6.6.3 Weaknesses:
 Lack of technological resources such as computerized banking as well as Internet
banking.
 Because of manual service, it is more costly and time consuming.
 Lack of promotional activities.
 Poor information based website.
 There is no specific training institute for JBL employees.
 The bank has more non-performing assets.
 Incentive system is very weak than private bank.
 Credit providing procedures are very lengthy. So most of the people fell boring to
take loan.
6.6.4 Opportunities:
“Financial Performance Analysis: AStudyonJanataBank Ltd.”
Department of Accounting and Information Systems, Comilla University. Page | 57
 Opportunity to increase retail banking due to available customer.
 Government has taken some steps against illegal remittances.
 The bank has many branches in the local areas of the country. So it can easily expand
its activities
 It has a good government patronization. So it is trustworthy to the people.
 Janata Bank can attract the people by offering new schemes of deposits to the local
area.
 Government has banned some Jatiya Sanchoy Patras.
6.6.5 Threats:
 Loan defaulter.
 Political instability of the country.
 The continuing increase in non-bank competitors offering similar services.
 A large number of private banks are increasing in Bangladesh day by day by taking
huge capital and skilled human resources.
 Private Banks provide handsome salary to the employees.
 Government facilities may be insufficient when the economic condition of the country
becomes unfavorable.
 Private Banks provide loan very quickly to the customers but JBL takes long time to
do it. But at present, most of the people are very punctual.
.
7.1 Findings
Every study belongs some specific findings, my report is not exception to this. Throughout
my internship period I had an opportunity to observe some unnoticed things of Janata Bank
Limited (JBL). Those are given below:
 The Liquidity Condition of Janata Bank Limited is quite Satisfactory. Its Liquidity
Ratios are around its standard level and it has amount of loans as compared to total
assets is average which resulted in an average risk.
 The bank’s ROA has increased to 0.60% in 2013 than the year 2012 which is within
moderate satisfactory level because it was much better in the year 2009 and 2010.
“Financial Performance Analysis: AStudyonJanataBank Ltd.”
Department of Accounting and Information Systems, Comilla University. Page | 58
 The bank’s return on equity is in decreasing trend. In the previous year 2009 and 2010
the ratio was very satisfactory. It decreased in 2012 but in 2013 it increased to
10.61%.
 Its operating expenses have increased to 8731.92 million from 7482.67 million in
2013 due to increase of branches and employees. And for this its net interest margin,
net operating margin are also decreasing.
 The debt ratio has increased year by year. The Debt ratio measures, the proportion of
total assets provides by the firm’s creditors. Their debt ratio was increasing to 0.945
in 2013 that indicates negative sign for the bank.
 EPS is closely watched by investors because it is an important indicator of corporate
success. Analysis shows that, in 2009 earnings per share of JBL’s were higher than
2011 and 2012. Net profit margin decreasing that means bank’s operating result is
decreasing. The year 2013 shows that EPS increased to 2.15 that is a good sign for the
company.
 The banks earning assets to total assets are quite satisfactory and its fixed assets
turnover is 4.23% in 2013 which indicates a good asset management of JBL.
 From the vertical analysis we see that both the assets and liabilities have increased to
586082.98 million in 2013 but proportionately liabilities were a little higher than the
assets, which may make some ratio lower. The analysis also shows that total liabilities
and stock holder’s equity have increased to 548966.78 million and 37116.60 million
which indicates that JBL has more debt financing than equity. Profit and loss account
shows that JBL After tax net profit has increased to 9551.41 million in 2013 by
recovering the negative income of 2012. On the other hand they paid higher tax in
2013. In the year 2013 JBL has comparatively higher expenditure which is 8731.92
million, but ultimately it reaches its positive income figure.
 The horizontal analysis shows that JBL performance trend is quite better in 2013.
Their capital and stockholders equity has increased to 19140 million and 37116.60
million in 2013.
 Economic value added (EVA) analysis confirm us the sound operation of Janata bank
limited as its economic profit is increasing throughout last three years from 6138.36
million to 7744.69 million in 2013 which is very satisfactory for any bank.
 The market value analysis shows that the bank’s market performance is increasing
which is indicated by increasing market value per share of Tk 193.92 from Tk 100.
 Overall the financial position of JBL is quite satisfactory compare to other
government commercial bank. Despite of severe unfavorable economic condition of
“Financial Performance Analysis: AStudyonJanataBank Ltd.”
Department of Accounting and Information Systems, Comilla University. Page | 59
last few years, JBL achieved worthy performance in all core areas of banking
operation.
7.2 Recommendations
This report is prepared on the basis of financial performance analysis. The report has
attempted to give details of financial performance. In preparing the report it is understood
that financial performance is not a simple matter, rather it is the parents of all analysis of a
bank. During my internship period it has become easy to understand each and every part of
this section.
Nevertheless it will again recommend some issues that will be useful for the operation of
financial performance.
“Financial Performance Analysis: AStudyonJanataBank Ltd.”
Department of Accounting and Information Systems, Comilla University. Page | 60
 Operational efficiency should be increased by reducing cost and wastage and
improving operating and management performance. Supply of working capital should
be adequate.
 Changing in deposit showing lower trend it should be taken under consideration.
 To concentrate more to increase return on asset and return on equity ratios by
ensuring maximum utilization of its assets.
 To ensure the continuous upward movement of net interest income by raising
efficiency and proper utilization of deposit.
 In the branch, most of the employees are working so many extra times, so
management should provide some extra incentives to motivate the employee.
 The training evaluation process and form is to be more modernized.
 Number of branches can be increased to create employment opportunity.
 The Banks should regularly make use of ratio analysis and measure should be taken to
improve undesirable ratios.
 Qualified, trained and experienced management personnel should be appointed.
 Government regulations should be flexible and policy should be realistic.
 Liquidity position of the Bank should be improved by reducing current liabilities.
 A reasonable credit policy should be implemented, so that the main portion of profit
does not spend in payment of fixed charges.
 Accountability and motivation for achievement of performance should be fixed up.
7.3 Conclusion
Janata Bank Limited (JBL), setting new standards in the banking arena in the time of
turbulent economic conditions. As part of the long-term financial reform and modernization
plan of the government, the bank had been converted into a public limited company. JBL
helps to mobilize the resources to stay strong in the key areas of operation. In the areas of
treasury operation, JBL remains the key player in the country’s foreign exchange and money
market enhancing profitability through careful pricing and assessment of risk and return on
investment, the treasury dealing is being strengthened to facilitate transactions requiring more
sophisticated products and services for larger institutional and corporate clients. Though it
Financial Performance Analysis Of Janata Bank Limited

Mais conteúdo relacionado

Mais procurados

Internship report on electronic banking activities of Rupali Bank Ltd._2018_I...
Internship report on electronic banking activities of Rupali Bank Ltd._2018_I...Internship report on electronic banking activities of Rupali Bank Ltd._2018_I...
Internship report on electronic banking activities of Rupali Bank Ltd._2018_I...ImranSheikh72
 
A study on npa of SBI
A study on npa of SBIA study on npa of SBI
A study on npa of SBIAman Rajak
 
An Internship report on Evaluation of Credit Risk management
An Internship report on Evaluation of Credit Risk managementAn Internship report on Evaluation of Credit Risk management
An Internship report on Evaluation of Credit Risk managementSohag Jafrul
 
Financial Analysis of Axis Bank Services (MBA Finance)
Financial Analysis of Axis Bank Services (MBA Finance)Financial Analysis of Axis Bank Services (MBA Finance)
Financial Analysis of Axis Bank Services (MBA Finance)Avinash Labade
 
Summer internship project on hdfc
Summer internship project on hdfcSummer internship project on hdfc
Summer internship project on hdfcProjects Kart
 
Project report on ratio analysis of axis bank
Project report on ratio analysis of axis bankProject report on ratio analysis of axis bank
Project report on ratio analysis of axis bankSukhchain Aggarwal
 
“Analysis of Financial Performance of Jamuna Bank Limited”.ppt
“Analysis of Financial Performance of Jamuna Bank Limited”.ppt“Analysis of Financial Performance of Jamuna Bank Limited”.ppt
“Analysis of Financial Performance of Jamuna Bank Limited”.pptfaqrul islam
 
Internship Report
Internship Report Internship Report
Internship Report zahurul88
 
A project report on analysis of financial statement of icici bank
A project report on analysis of financial statement of  icici bankA project report on analysis of financial statement of  icici bank
A project report on analysis of financial statement of icici bankProjects Kart
 
ECONOMIC AND FINANCIAL ANALYSIS OF SBI AND BOB
ECONOMIC AND FINANCIAL ANALYSIS OF SBI AND BOB ECONOMIC AND FINANCIAL ANALYSIS OF SBI AND BOB
ECONOMIC AND FINANCIAL ANALYSIS OF SBI AND BOB Jeetu Matta
 
Summer Internship Report 2019 ppt
Summer Internship Report 2019 pptSummer Internship Report 2019 ppt
Summer Internship Report 2019 pptmayank mulchandani
 
General Banking Activities
General Banking ActivitiesGeneral Banking Activities
General Banking ActivitiesMahfuzAhmed35
 
Internship Report
Internship ReportInternship Report
Internship Reportzahurul88
 
Bank of Baroda- Summer Internship Report
Bank of Baroda- Summer Internship ReportBank of Baroda- Summer Internship Report
Bank of Baroda- Summer Internship ReportAnkit Kumar
 
Study of of working capital management in kotak mahindra bank
Study of of working capital management in kotak mahindra bankStudy of of working capital management in kotak mahindra bank
Study of of working capital management in kotak mahindra bankManali Tendolkar
 
Financial analysis of banks
Financial analysis of banksFinancial analysis of banks
Financial analysis of banksSahim Khan
 

Mais procurados (20)

Internship report on electronic banking activities of Rupali Bank Ltd._2018_I...
Internship report on electronic banking activities of Rupali Bank Ltd._2018_I...Internship report on electronic banking activities of Rupali Bank Ltd._2018_I...
Internship report on electronic banking activities of Rupali Bank Ltd._2018_I...
 
A study on npa of SBI
A study on npa of SBIA study on npa of SBI
A study on npa of SBI
 
An Internship report on Evaluation of Credit Risk management
An Internship report on Evaluation of Credit Risk managementAn Internship report on Evaluation of Credit Risk management
An Internship report on Evaluation of Credit Risk management
 
Financial Analysis of Axis Bank Services (MBA Finance)
Financial Analysis of Axis Bank Services (MBA Finance)Financial Analysis of Axis Bank Services (MBA Finance)
Financial Analysis of Axis Bank Services (MBA Finance)
 
Summer internship project on hdfc
Summer internship project on hdfcSummer internship project on hdfc
Summer internship project on hdfc
 
Project report on ratio analysis of axis bank
Project report on ratio analysis of axis bankProject report on ratio analysis of axis bank
Project report on ratio analysis of axis bank
 
“Analysis of Financial Performance of Jamuna Bank Limited”.ppt
“Analysis of Financial Performance of Jamuna Bank Limited”.ppt“Analysis of Financial Performance of Jamuna Bank Limited”.ppt
“Analysis of Financial Performance of Jamuna Bank Limited”.ppt
 
Summer Internship Report 2019
Summer Internship Report 2019Summer Internship Report 2019
Summer Internship Report 2019
 
Internship report on retail banking activities of city bank ltd by lectureshe...
Internship report on retail banking activities of city bank ltd by lectureshe...Internship report on retail banking activities of city bank ltd by lectureshe...
Internship report on retail banking activities of city bank ltd by lectureshe...
 
Internship Report
Internship Report Internship Report
Internship Report
 
A project report on analysis of financial statement of icici bank
A project report on analysis of financial statement of  icici bankA project report on analysis of financial statement of  icici bank
A project report on analysis of financial statement of icici bank
 
Internship report-on-nrb-commercial-bank-ltd
Internship report-on-nrb-commercial-bank-ltdInternship report-on-nrb-commercial-bank-ltd
Internship report-on-nrb-commercial-bank-ltd
 
ECONOMIC AND FINANCIAL ANALYSIS OF SBI AND BOB
ECONOMIC AND FINANCIAL ANALYSIS OF SBI AND BOB ECONOMIC AND FINANCIAL ANALYSIS OF SBI AND BOB
ECONOMIC AND FINANCIAL ANALYSIS OF SBI AND BOB
 
Summer Internship Report 2019 ppt
Summer Internship Report 2019 pptSummer Internship Report 2019 ppt
Summer Internship Report 2019 ppt
 
General Banking Activities
General Banking ActivitiesGeneral Banking Activities
General Banking Activities
 
Internship Report
Internship ReportInternship Report
Internship Report
 
Bank of Baroda- Summer Internship Report
Bank of Baroda- Summer Internship ReportBank of Baroda- Summer Internship Report
Bank of Baroda- Summer Internship Report
 
Study of of working capital management in kotak mahindra bank
Study of of working capital management in kotak mahindra bankStudy of of working capital management in kotak mahindra bank
Study of of working capital management in kotak mahindra bank
 
Internship report on general banking of MTB bank by lecturesheets & lecturesh...
Internship report on general banking of MTB bank by lecturesheets & lecturesh...Internship report on general banking of MTB bank by lecturesheets & lecturesh...
Internship report on general banking of MTB bank by lecturesheets & lecturesh...
 
Financial analysis of banks
Financial analysis of banksFinancial analysis of banks
Financial analysis of banks
 

Destaque

FINANCIAL STATEMENT ANALYSIS AND STUDY OF BANK FINANCE FOR WORKING CAPITAL RE...
FINANCIAL STATEMENT ANALYSIS AND STUDY OF BANK FINANCE FOR WORKING CAPITAL RE...FINANCIAL STATEMENT ANALYSIS AND STUDY OF BANK FINANCE FOR WORKING CAPITAL RE...
FINANCIAL STATEMENT ANALYSIS AND STUDY OF BANK FINANCE FOR WORKING CAPITAL RE...Rajeshwar Ojha
 
Profitability & Growth Analysis of SPL & OPL
Profitability & Growth Analysis of SPL & OPLProfitability & Growth Analysis of SPL & OPL
Profitability & Growth Analysis of SPL & OPLDebabrata Barman
 
Accounting Practices in ACI
Accounting Practices in ACIAccounting Practices in ACI
Accounting Practices in ACITarek Musanna
 
Financial Statement Analysis of ICICI Bank Ltd.
Financial Statement Analysis of ICICI Bank Ltd.Financial Statement Analysis of ICICI Bank Ltd.
Financial Statement Analysis of ICICI Bank Ltd.Bishnu Panda
 
A study on financial analysis of hdfc bank
A study on financial analysis of hdfc bankA study on financial analysis of hdfc bank
A study on financial analysis of hdfc bankMehul Rasadiya
 
Financial Accounting
Financial AccountingFinancial Accounting
Financial Accountingashu1983
 

Destaque (7)

FINANCIAL STATEMENT ANALYSIS AND STUDY OF BANK FINANCE FOR WORKING CAPITAL RE...
FINANCIAL STATEMENT ANALYSIS AND STUDY OF BANK FINANCE FOR WORKING CAPITAL RE...FINANCIAL STATEMENT ANALYSIS AND STUDY OF BANK FINANCE FOR WORKING CAPITAL RE...
FINANCIAL STATEMENT ANALYSIS AND STUDY OF BANK FINANCE FOR WORKING CAPITAL RE...
 
Profitability & Growth Analysis of SPL & OPL
Profitability & Growth Analysis of SPL & OPLProfitability & Growth Analysis of SPL & OPL
Profitability & Growth Analysis of SPL & OPL
 
Accounting Practices in ACI
Accounting Practices in ACIAccounting Practices in ACI
Accounting Practices in ACI
 
Assignment of banking
Assignment of bankingAssignment of banking
Assignment of banking
 
Financial Statement Analysis of ICICI Bank Ltd.
Financial Statement Analysis of ICICI Bank Ltd.Financial Statement Analysis of ICICI Bank Ltd.
Financial Statement Analysis of ICICI Bank Ltd.
 
A study on financial analysis of hdfc bank
A study on financial analysis of hdfc bankA study on financial analysis of hdfc bank
A study on financial analysis of hdfc bank
 
Financial Accounting
Financial AccountingFinancial Accounting
Financial Accounting
 

Semelhante a Financial Performance Analysis Of Janata Bank Limited

Doon business school pnb
Doon business school pnbDoon business school pnb
Doon business school pnbRagneeChauhan
 
Total Banking System of Jamuna Bank Limited
Total Banking System of Jamuna Bank LimitedTotal Banking System of Jamuna Bank Limited
Total Banking System of Jamuna Bank LimitedMd. Samiul Islam
 
F 310 report on performance evaluation of banking sector of bangladesh
F   310 report on performance evaluation of banking sector of bangladeshF   310 report on performance evaluation of banking sector of bangladesh
F 310 report on performance evaluation of banking sector of bangladeshMahmudur Rahman
 
An internship report on evaluation of credit risk management
An internship report on evaluation of credit risk managementAn internship report on evaluation of credit risk management
An internship report on evaluation of credit risk managementSohag Jafrul
 
Financial performance analysis of sonali bank limited
Financial performance analysis of sonali bank limitedFinancial performance analysis of sonali bank limited
Financial performance analysis of sonali bank limitedrifat raihan
 
Financial Performance Analysis of Conventional and Non – Conventional Banks
Financial Performance Analysis of Conventional and Non – Conventional BanksFinancial Performance Analysis of Conventional and Non – Conventional Banks
Financial Performance Analysis of Conventional and Non – Conventional BanksAN_Rajin
 
InternshipReport_Sabiha_DIIT (1).pdf
InternshipReport_Sabiha_DIIT (1).pdfInternshipReport_Sabiha_DIIT (1).pdf
InternshipReport_Sabiha_DIIT (1).pdfMdSalimHossain4
 
1411-Article Text-5914-1-10-20220221.pdf
1411-Article Text-5914-1-10-20220221.pdf1411-Article Text-5914-1-10-20220221.pdf
1411-Article Text-5914-1-10-20220221.pdfDR BHADRAPPA HARALAYYA
 
Letter of Transmittal.docx
Letter of Transmittal.docxLetter of Transmittal.docx
Letter of Transmittal.docxPayelBasak4
 
Internship Report on Risk Management Assessment of JBL
Internship Report on Risk Management Assessment of JBLInternship Report on Risk Management Assessment of JBL
Internship Report on Risk Management Assessment of JBLKazi Mahmud Mohiuddin
 
best capital project report jaipur
best capital project report jaipurbest capital project report jaipur
best capital project report jaipurAmitDoraya
 
Internship Report on Financial Statements Analysis of FSIBL by Moez Ansary
Internship Report on Financial Statements Analysis of FSIBL by Moez Ansary Internship Report on Financial Statements Analysis of FSIBL by Moez Ansary
Internship Report on Financial Statements Analysis of FSIBL by Moez Ansary Moez Ansary
 
Internship Report on Financial Statements Analysis of FSIBL by Moez Ansary
Internship Report on Financial Statements Analysis of FSIBL by Moez AnsaryInternship Report on Financial Statements Analysis of FSIBL by Moez Ansary
Internship Report on Financial Statements Analysis of FSIBL by Moez AnsaryMoez Ansary
 
Report on Credit risk management
Report on Credit risk managementReport on Credit risk management
Report on Credit risk managementNishatTasnim54
 
Internship report proposal on comapany performance analysis
Internship report proposal on comapany performance analysisInternship report proposal on comapany performance analysis
Internship report proposal on comapany performance analysisGalibur Rahman
 

Semelhante a Financial Performance Analysis Of Janata Bank Limited (20)

Doon business school pnb
Doon business school pnbDoon business school pnb
Doon business school pnb
 
Total Banking System of Jamuna Bank Limited
Total Banking System of Jamuna Bank LimitedTotal Banking System of Jamuna Bank Limited
Total Banking System of Jamuna Bank Limited
 
F 310 report on performance evaluation of banking sector of bangladesh
F   310 report on performance evaluation of banking sector of bangladeshF   310 report on performance evaluation of banking sector of bangladesh
F 310 report on performance evaluation of banking sector of bangladesh
 
An internship report on evaluation of credit risk management
An internship report on evaluation of credit risk managementAn internship report on evaluation of credit risk management
An internship report on evaluation of credit risk management
 
Financial performance analysis of sonali bank limited
Financial performance analysis of sonali bank limitedFinancial performance analysis of sonali bank limited
Financial performance analysis of sonali bank limited
 
Report city bank
Report city bankReport city bank
Report city bank
 
Fahmida rahman
Fahmida rahmanFahmida rahman
Fahmida rahman
 
Financial Performance Analysis of Conventional and Non – Conventional Banks
Financial Performance Analysis of Conventional and Non – Conventional BanksFinancial Performance Analysis of Conventional and Non – Conventional Banks
Financial Performance Analysis of Conventional and Non – Conventional Banks
 
UBL main report
UBL main reportUBL main report
UBL main report
 
InternshipReport_Sabiha_DIIT (1).pdf
InternshipReport_Sabiha_DIIT (1).pdfInternshipReport_Sabiha_DIIT (1).pdf
InternshipReport_Sabiha_DIIT (1).pdf
 
1411-Article Text-5914-1-10-20220221.pdf
1411-Article Text-5914-1-10-20220221.pdf1411-Article Text-5914-1-10-20220221.pdf
1411-Article Text-5914-1-10-20220221.pdf
 
Letter of Transmittal.docx
Letter of Transmittal.docxLetter of Transmittal.docx
Letter of Transmittal.docx
 
Internship Report on Risk Management Assessment of JBL
Internship Report on Risk Management Assessment of JBLInternship Report on Risk Management Assessment of JBL
Internship Report on Risk Management Assessment of JBL
 
best capital project report jaipur
best capital project report jaipurbest capital project report jaipur
best capital project report jaipur
 
Internship Report on Financial Statements Analysis of FSIBL by Moez Ansary
Internship Report on Financial Statements Analysis of FSIBL by Moez Ansary Internship Report on Financial Statements Analysis of FSIBL by Moez Ansary
Internship Report on Financial Statements Analysis of FSIBL by Moez Ansary
 
Internship Report on Financial Statements Analysis of FSIBL by Moez Ansary
Internship Report on Financial Statements Analysis of FSIBL by Moez AnsaryInternship Report on Financial Statements Analysis of FSIBL by Moez Ansary
Internship Report on Financial Statements Analysis of FSIBL by Moez Ansary
 
Internship Report on Financial Statements Analysis of FSIBL by Moez Ansary
Internship Report on Financial Statements Analysis of FSIBL by Moez AnsaryInternship Report on Financial Statements Analysis of FSIBL by Moez Ansary
Internship Report on Financial Statements Analysis of FSIBL by Moez Ansary
 
Report on Credit risk management
Report on Credit risk managementReport on Credit risk management
Report on Credit risk management
 
Nishat report
Nishat reportNishat report
Nishat report
 
Internship report proposal on comapany performance analysis
Internship report proposal on comapany performance analysisInternship report proposal on comapany performance analysis
Internship report proposal on comapany performance analysis
 

Financial Performance Analysis Of Janata Bank Limited

  • 1. “Financial Performance Analysis: AStudyonJanataBank Ltd.” Department of Accounting and Information Systems, Comilla University. Page | 1 1.1 Introduction The process of economic development needs capital formation besides other structural changes like improvement in skill and efficiency of manpower, better organization, health and education system, etc. An efficient and well-organized financial system contributes to the much-desired economic development through capital formation which can be divided into three stages viz., savings, financing and investment. Banks constitute the most important functionary in the whole network of the financial system for mobilization of savings, intermediation between savers and investors and allocation of credit to productive sectors and thus play a dynamic role in the economic development of a nation. The health of Bangladesh Economy is closely related to the banking systems. Banking is one of the highly leveraged businesses. Financial statements for banks present a different analytical problem than statements for manufacturing and service companies. As a result analysis of bank’s financial performance requires a distinct approach that recognizes a bank’s unique risks. Janata Bank Limited is a first generation bank in Bangladesh. It is playing an important role in developing the business sector of the country. It has implemented well-structured online banking systems that make it easier to provide prompt banking services to the customer. Financial performance analysis is the process of identifying the financial strengths and weaknesses of the Bank by properly establishing the relationship between the items of balance sheet and profit and loss account. It also helps in short-term and long term forecasting and growth can be identified with the help of financial performance analysis. It is the structural and logical way to represent overall financial performance of a financial institution. 1.2 Origin of the Report Theoretical and practical knowledge both are important phases of learning. Perfect combination of both practical and theoretical methods is necessary for holistic learning. Theoretical knowledge has its own importance in the learning. It is the base of doing anything practically. Practical knowledge assists us to attain the exact techniques that become the tools of our job. Learning during internship is the best way of acquiring knowledge by using both practical and theoretical aspects of a thing or situation. To relate the theoretical knowledge with the practice Bachelor of Business Administration (BBA) course requires 3 months attachment with an organization followed by a report assigned by the supervisor in the organization and endorsed by the faculty. Students are placed in enterprises, organizations, research institutions as well as development projects. Since practical orientation is an integral part of the BBA degree requirement, I was deputed by the Department of Accounting & Information Systems (AIS), Comilla University to Janata
  • 2. “Financial Performance Analysis: AStudyonJanataBank Ltd.” Department of Accounting and Information Systems, Comilla University. Page | 2 Bank Limited, Corporate Branch, Comilla to take real life exposure of the activities of the organization as a financial institution. After completion of the internship program report submission is essential. I have assigned a topic “Financial Performance Analysis of Janata Bank Limited.” The topic was selected with able guidance of the respective supervisor. The Janata Bank Ltd. authority gave me the opportunity to work at the three months on the topic. My faculty supervisor Shuvabrata Saha, Assistant Professor of AIS department, Comilla University, approved the topic and authorized me to prepare this report as a part of the fulfillment of internship requirement. 1.3 Rationale of the Report Banking in Bangladesh has to keep pace with the global change. The economy of the country has a lot left to be desired and there are lots of scopes for massive improvement. In an economy like this, banking sector can play a vital role to improve the overall social-economic condition of the country. Now, Banks must compete in the market place both with local institution as well as foreign ones. The management of the bank is responsible for taking decisions and formulating plans and policies for the future. They, therefore, always need to evaluate its performance and effectiveness of their action to realize the company’s goal in the past. For the purpose financial performance analysis is important to the company’s management. It’s very important to have an effective and sound credit risk management system in place which will help the bank mitigate its risk factors and carry out successful financing service or lending. Financial performance analysis helps to provide important information to the management regarding extension of credit. Shareholders, who are the owners of the bank, can also get meaningful information through the financial performance analysis. Thus, performance analysis helps to highlight the facts and relationships concerning managerial performance, corporate efficiency, financial strength and weakness, credit worthiness of the bank. With these issues in mind, the topic “Financial Performance Analysis” has been undertaken as my topic for internship report. 1.4 Objectives of the Report The following report has two types of objectives which are described as follows: 1.4.1 Broad Objectives:  To get an overall idea about the financial performance of Janata Bank Limited.  To relate the theoretical knowledge to the original financial data of Janata Bank Limited. 1.4.2 Specific Objectives:  To understand the theoretical aspect of financial performance.
  • 3. “Financial Performance Analysis: AStudyonJanataBank Ltd.” Department of Accounting and Information Systems, Comilla University. Page | 3  To analyze the financial statements of Janata Bank Limited by using financial tools.  To know about different ratios applicable for measuring financial performance of a bank.  To identify the strength and weakness of the bank based on the financial performance in the last five years (2009-2013).  Finally, to make some recommendations and suitable conclusion regarding financial performance of Janata Bank limited. 1.5 Methodology of the Report 1.5.1 Introduction: This report is the reflection of three months internship program in Janata Bank Limited corporate Branch, Comilla. Banking sector is a fast going sector in Bangladesh. All banks are facing tremendous competition from each other. So, the officers remain very busy to provide a better customer service. As an intern, I had to collect data and information from that busy corporate environment. Information collected to furnish this report is both from primary and secondary sources. 1.5.2 Researchtype: This is a “Descriptive Research”, which briefly reveals the overall activities of the bank. This Internship report has been prepared based on the information extracted from different sources collected by using a specific methodology. 1.5.3 Choice of the Year: I have selected the last five years (2009-2013) for my analysis. I have collected data and financial papers of these five years to prepare this report. 1.5.4 Method of Data Collection: To make this report presentable and effective, the necessary information has been collected from two sources:
  • 4. “Financial Performance Analysis: AStudyonJanataBank Ltd.” Department of Accounting and Information Systems, Comilla University. Page | 4 The primary sources are:  Face to face conversation with the clients.  Taking initial lectures from Branch Manager and Senior Officers.  Consulting with the supervisor.  Practical work experience at different desk.  Close observation of the several tasks by the different department’s officers. The secondary sources are:  Annual Report of Janata Bank Limited (2009-2013).  Brochures of Janata Bank Limited.  Prospectus of Janata Bank Limited.  Relevant file study as provided by the officers concerned.  Working Papers.  Different circulars issued by the Head office of Janata Bank Limited.  Unpublished data received from the corporate Branch, Comilla.  Different Financing and Accounting related text books.
  • 5. “Financial Performance Analysis: AStudyonJanataBank Ltd.” Department of Accounting and Information Systems, Comilla University. Page | 5 1.5.5 Data Analysis & Reporting: To analyze the gathered data I have used Ratio analysis, Vertical/Common size analysis, Horizontal/Trend analysis, Economic value added analysis (EVA), Market value analysis. Some necessary number of table, chart, and graph are also used to present the report. Ms- Word, Excel or any required computer programs used to process the data. 1.6 Scope of the report There is a certain boundary to cover this report. To achieve the objective of the report, i.e. to get an overall idea about the financial performance of Janata Bank Limited, it is not possible to cover each and every activity performed in the organization. The report has covered only the data which are published in the annual reports. Moreover the company itself and financial institutions have got some confidential information which is not possible to disclose publicly, so those data and information had to be ignored for this report. The report is divided into six parts. Chapter one contains “Introduction” which includes origin, objectives, scope, methodology, justifications and limitations of the report. Chapter two contains “An Overview of the Organization”, which includes history of JBL, its management and function, vision, mission. Chapter three describes “Practical Experience as an Intern”. Chapter four contains the “Literature review”. Chapter five of my report is about “Theoretical Discussion”. Chapter six contains Financial Performance Analysis of JBL and Chapter seven includes “Findings, Recommendation and Conclusion”. 1.7 Limitations of the Report To make a report various aspects and experiences are needed. But I have faced some barriers for making a complete and perfect report. These barriers or limitations, which hinder my work, are as follows: Confidentiality: The bank’s policy of not disclosing some data and information for obvious reasons, which would have been very much useful for the report. Random changing system: As the bank is continuously changing its system is also changing time to time, it will be difficult to ascertain the true performance of the bank each time. Extreme workload: Few officers sometime felt disturbed, as they were busy with their job. Sometime they didn’t want to supervise me out of their official work. Sometimes it was difficult to collect data important files are kept in volt for safety. Lack of time: Time constraint was one of the major drawbacks in the report. The duration of the Report was only three months which was very short. So, I could not go in depth analysis. Other limitation: There was non-availability of some preceding and latest data. As I am a newcomer, there is a lack of previous experience in this concern. And many practical matters have been written from my own observation that may vary from person to person.
  • 6. “Financial Performance Analysis: AStudyonJanataBank Ltd.” Department of Accounting and Information Systems, Comilla University. Page | 6 2.1 Backgroundof Janata Bank Limited Janata Bank Limited is one of the state owned commercial banks in Bangladesh, has an authorized capital of Tk. 20000 million (approx. US$ 289.85 million), paid up capital of Tk. 5000.00 million, reserve of Tk.8202.00 million and retained surplus Tk. 2737.00 million. The Bank has a total asset of Tk. 282423.00 million as on 30th November 2008. Immediately after the emergence of Bangladesh in 1971, the erstwhile United Bank Limited and Union Bank Limited were renamed as Janata Bank. On 15th November, 2007 the bank has been Corporatized and renamed as Janata Bank Limited. Janata Bank Limited operates through 860 branches including 4 overseas branches at United Arab Emirates. It is linked with 1202 foreign correspondents all over the world. The Bank employs more than 13(Thirteen) thousand persons. The mission of the bank is to actively participate in the socio- economic development of the nation by operating a commercially sound banking organization, providing credit to viable borrowers, efficiently delivered and competitively priced, simultaneously protecting depositor’s funds and providing a satisfactory return on equity to the owners. The Board of Directors is composed of 13 (Thirteen) members headed by a Chairman. The Directors are representatives from both public and private sectors. The Bank is headed by the Chief Executive Officer & Managing Director, who is a reputed banker. The corporate head office is located at Dhaka with 10 (ten) Divisions comprising of 37 (thirty seven) Departments. The Company started its banking operation and entitled to carry out the following types of banking business: All types of commercial banking activities including Money Market operation:  Investment in Merchant Banking activities.  Investment in Company activities.  Financiers, Promoters, Capitalists etc.  Financial Intermediary Services.  Any related Financial Services 2.2 Vision of Janata Bank Limited To become the effective largest commercial bank in Bangladesh to support socio- economic development of the country and to be a leading bank in South Asia. 2.3 Missionof Janata Bank Limited Janata Bank Limited will be an effective commercial bank by maintaining a stable growth strategy, delivering high quality financial products, providing excellent customer service through an experienced management team and ensuring good corporate governance in every step of banking network.
  • 7. “Financial Performance Analysis: AStudyonJanataBank Ltd.” Department of Accounting and Information Systems, Comilla University. Page | 7 2.4 Corporate Profile Name of Company Janata Bank Limited RegisteredOffice Janata Bhaban110, Motijheel C/A Dhaka- 1000, Bangladesh Legal Status 21 May 2007 Date of Commencement of Business 21 May 2007 Banking license obtained from Bangladesh Bank 31 May 2007 Authorized Capital BDT 20,000 Million Paid up Capital BDT 19,140 Million Face value per share BDT 100 Shareholding Pattern 100% Share owned by Government of the People’s Republic of Bangladesh Tax Identification No 001-200-2732 Vat Registration No 9011050160 Chairman of the Board of Directors Professor Dr. AbulBarkat CEO & Managing Director Mr. S M Aminur Rahman Corporate Rating Status: Entity Rating (2012) As Government owned Bank A+ in the long run AR-2 in the short run AAA in the long run AR-1 in the short run Telex 675840JBDBJ, 671288 JBHOBJ Phone PABX 9560000, 9566020, 9556245-49, 9565041- 43, 9560027-30 Fax 88-02-9564644, 9560869 E-mail md@janatabank-bd.com Website www. janatabank-bd.com Swift Code JANB BD DH
  • 8. “Financial Performance Analysis: AStudyonJanataBank Ltd.” Department of Accounting and Information Systems, Comilla University. Page | 8 2.5 Core Values of Janata Bank Limited Fig: Core values of Janata bank limited 2.6 Core strengths  Transparent and Quick Decision Making.  Efficient Team of Performer.  Satisfied Customers.  Internal Control.  Skilled Risk Management.  Diversification. 2.7 Core competencies  Knowledge.  Experience & Expertise.  Customer Orientation/ Focus.  Transparency.  Determination.  Zeal for Improvement. 2.8 Objectives of Janata Bank Limited The objectives for which the bank is established are as follows:  To carry on, transact, undertake and conduct the business of banking in all branches.  To receive, borrow or to raise money on deposit, loan or otherwise upon such terms as the company may approve.  To carry on the business of discounting and dealing in exchange of specie and securities and all kinds of mercantile banking.  To provide for safe-deposit vaults and the safe custody of valuables of all kinds. Professinalism Accountability Intrigity Quality Transparency Commitment Diversity Dignity Growth
  • 9. “Financial Performance Analysis: AStudyonJanataBank Ltd.” Department of Accounting and Information Systems, Comilla University. Page | 9  To carry on business as financiers, promoters, capitalists, financial and monitory agents, concessionaires and brokers.  To act as agents for sale and purchase of any stock, shares or securities or for any other momentary or mercantile transaction.  To establish and open offices and branches to carry on all or any of the business abroad and within the country provided prior permission is obtained from Bangladesh bank.  To ensure optimum utilization of all available resources.  To remain one of the best banks in Bangladesh in terms of profitability and asset quality. 2.9 Business Prospects of Janata Bank Limited  Surplus Capital Adequacy after IPO subscription.  Business expansion in capital market.  Gradual expansion of branch network.  Progressive automation of the branches.  Real online banking software will be in function soon.  Expansion of ATM and Credit Card.  Consideration of prime customers. 2.10 International Award of Janata Bank Limited Recently The Bank has been recognized internationally and domestically for its good performance.  International Award -"World's Best Bank Award-2010 in Bangladesh.  International Award -"World's Best Bank Award-2009 in Bangladesh.  International Award -"World's Best Bank Award-2007 in Bangladesh.  International Award -"World's Best Bank Award-2006 in Bangladesh.  Janata Bank Limited receives "Asian Banking Awards 2005" on Credit Scheme for Handicapped People.  International Award -The Bank of the Year-2004 in Bangladesh.
  • 10. “Financial Performance Analysis: AStudyonJanataBank Ltd.” Department of Accounting and Information Systems, Comilla University. Page | 10 2.11 Services of Janata Bank Ltd Fig: various services provide by Janata bank limited 2.12 Branches of Janata Bank Limited Branches No. of Branches Local Office 1 Corporate-1 Branch 10 Corporate-2 Branch 40 Overseas Branch 04 Grade-1 Branch 204 Grade-2 Branch 205 Grade-3 Branch 291 Grade-4 Branch 104 NRB Branch 01 Total Branches 860 2.13 New/ Special Products of Janata Bank Limited  Financing IT Sector.  Financing of Industries.  Ready Cash.  Windows for SMEs.  Loan to Travel Agencies. Current Services • customer Credit Scheme • Secured Overdraft • Cash Credit • Curent Deposit A/C • Deposit Services Deposit Services • Savings A/C • Curent Deposit A/C • Short Term Deposit • Fixed Deposit Received • Monthly Savings Scheme Others • DD • TT • L/C • PO • Credit Cards • Online Banking
  • 11. “Financial Performance Analysis: AStudyonJanataBank Ltd.” Department of Accounting and Information Systems, Comilla University. Page | 11  Loan to Diagnostic Centers.  NRB Escrow Account.  NRB Gift Cheque. 2.14 Ethical Principles Bank deals with public money where ethics, integrity and trust are the most essential. Janata Bank protects and upholds these principle issues in every area of its management activities and customer services. The basic characteristics of employee’s code of ethics and business conduct are as follows:  Ensure customer service with utmost care, respect, dedication, integrity and unwavering responsibility.  Protect privacy and confidentiality of customer’s information.  Prevent money laundering and fraud forgery.  Protects and upholds corporate value. 2.15 Strategic objectives of JBL We Have:  Concern.  Commitment.  Competence. Our Strengths:  Nationwide networks, 893 branches.  Foreign network, 4 branches and.  1239 foreign corospondence.  State-owned image.  Goodwill.  Received globally recognized awards.  Strong deposit base.  No capital shortfall.  No provision shortfall .  Skilled manpower.  Experienced higher level management.  Newly recruited talents.  Friendly board of directors. Our Brand:  Quality and responsive staff.  Efficient service.
  • 12. “Financial Performance Analysis: AStudyonJanataBank Ltd.” Department of Accounting and Information Systems, Comilla University. Page | 12  High and sustained growth (depositadvance, import, export, foreign remittance non interest income and recovery).  Good quality loan.  Low classified loan.  Timely recovery.  Business diversification.  Attract low cost deposit.  Participate in capital market.  Improve agricultural loan(disbursement, recovery etc.).  High impact of CSR.  Aesthetic infrastructure. We Need:  Sense of belonging (ownership).  Improve service mentality.  Human touch with clients.  Proactive, team spirit.  Loosing branches make profitable.  Chronic weak branches make strengthen.  Managerial efficiency (GIS of good customer/ borrowers; meeting each within 1 km radius).  Strong cash recovery.  Strategic thinking.  More agricultural loan.  Broadening of deposit base; reaching all.  Automation, on-line banking.  Need based training.  More remittance.  Discipline, chain of command.  Hygienic bank premises.  Avoid intermediary between management and clients.
  • 13. “Financial Performance Analysis: AStudyonJanataBank Ltd.” Department of Accounting and Information Systems, Comilla University. Page | 13 2.16 ORGANOGRAM OF JBL Board of Director Managing Director Deputy Managing Director General Managers Deputy General Managers Senior Principle Officer Principle Officers Senior Officers Officers Assistant Officer Management Trainee Officer
  • 14. “Financial Performance Analysis: AStudyonJanataBank Ltd.” Department of Accounting and Information Systems, Comilla University. Page | 14 2.17 Corporate Governance Boardof Directors Designation ProfessorDr. Abul Barkat Chairman Dr. Jamal uddin Ahmed, FCA Mr. Md. Emdadul Hoque Mr. Nagibul Islam Dipu Dr. R M Debnath Syed Bazlul Karim, B.P.M. Prof. Mohammad Moinuddin Mr. Md. Abu Naser Mrs. Sangita Ahmed Prof. Dr. Nitai Chandra Nag Mr. A.K.M Kamrul Islam, FCA Member Member Member Member Member Member Member Member Member Member Corporate Governance Culture Business Planning Compliance Risk Management
  • 15. “Financial Performance Analysis: AStudyonJanataBank Ltd.” Department of Accounting and Information Systems, Comilla University. Page | 15 2.18 Financial highlights of JBL
  • 16. “Financial Performance Analysis: AStudyonJanataBank Ltd.” Department of Accounting and Information Systems, Comilla University. Page | 16 2.19 CSR Activities of Janata Bank Limited For bringing dynamism in CSR activities and including the most part of the deprived people, the total activities have been categorized and sub-categorized in the following ways:  Education & Research.  Health & Treatment.  Poverty reduction & rehabilitation.  Combat against natural calamity.  A try to bring the marginal agriculturists and the poor out of the grip of loan.  Preservation of history-tradition, culture and sports.  Preservation of environment.  Expansion of technology.  Invention. SL Description Contribution (In Million) 1. Cash donation to the PM’s relief fund for the victims of Rana Plaza accident at Savar and maintenance of two relief camps for three weeks at Savar. 20.00 2. Donation to the University of Dhaka for establishing a new department named “Department of Oceanology” 19.00 3. Donation to “Proyash”, Comilla for running a school for the disabled. 10.00 4. Donation to establish “Muktijuddha Smriti Zadughar” at Segunbagicha, Dhaka 10.00 5. Donation to Hokey Federation for development of the sector 6.90 6. Providing a bus for the teachers of the University of Dhaka. 6.80 7. Providing a bus for the teachers/doctors of Bongobondhu Medical University, Dhaka. 6.80 8. Providing a bus for the teachers of Jahangir Nagar University 3.80 9. Providing a bus for the students of Shahjalal Science & Technology University, Sylhet. 3.80 10. Providing a bus for the teachers of Chittagong University. 3.80 11. Providing an ambulance to CRP at Savar. 3.20 12. Distribution of blankets among the poor. 3.00 13. Donation to Dhaka Ahsania Mission for establishing Cancer Hospital. 2.00 14. Donation to Begum Rokeya University in Rangpur for foundation of “Shahid Minar”. 1.00 15. Donation for establishing Bondor Badhy Bhumi Smriti Complex in Chittagong. 0.80 16. Providing an ambulance to Kushtia General Hospital. 0.70 17. Donation to Dhaka Shishu Hospital for setting up Thalassemia Centre. 0.67 18 Donation for establishing “Shahid Minar” at Borguna. 0.65 19 Donation to Shamima Akhter for artificial leg. 0.50
  • 17. “Financial Performance Analysis: AStudyonJanataBank Ltd.” Department of Accounting and Information Systems, Comilla University. Page | 17 3.1 Positionand Duties as an Intern: An internship is work-related learning experience for individuals who wish to develop hands on work experience in certain occupation field. An internship is position which allows a student to gain professional experience in an occupational area which they are considering. An internship is a supervised pre professional learning experience in which students apply their skills knowledge in a professional setting. It provides students with a full and realistic view of workplace culture and experience. As a part of the Internship program of Bachelor of Business Administration (BBA) course requirement, I was assigned to do my internship at JBL, Comilla branch for period of three months. 3.1.1 Internship Position: As an intern I was act as an intern of the organization. My job was to gain the practical knowledge from the bank. For this reason I observed practical works done by the officers of the JBL Comilla branch. I did some work to familiar the work. My learning experiences from the various departments are given in the following table. A short summary of my duties and responsibilities are also stated below: Placement Area Working Days Cash section 8 days Accounting section 20 days Loan and advance section 14 days Clearing section 12 days Remittance section 10 days 3.1.2 The Nature of the Job and My Specific Responsibilities: General Banking Division: In General banking division I had lots of duties. Those are containing Cash Counter Section, Front Desk and Accounts Department. About a week I was in the cash department. The bank does not usually put intern nevertheless they allowed me and I was lucky to experience first-hand what happens behind the counter. My responsibilities in this department have been just to assist them in a small and possibly way.  Use the Xerox machine to help them.  Counting vouchers.  Checking the individual EOD (End of day journal report) of each cashier.  Learn about Money Laundering Act. Although the activities were very small, they helped me understand the nature of work. Then I was assign to Front desk and Account’s Department.
  • 18. “Financial Performance Analysis: AStudyonJanataBank Ltd.” Department of Accounting and Information Systems, Comilla University. Page | 18 I had a wide variety of responsibilities:  Account opening.  Demand Deposit.  Fixed deposit.  Give the information to customer about our product.  Bringing out the cheque books for customers, receiving them from courier.  Recording the issuance cheque books in the recording paper.  Finding FD, DPS, and old account opening forms.  Putting different seals for clearing.  Writing the later on printing pay orders.  Numbering shares and putting seals on them during IPO’s.  Give the balance statement.  Signature verification etc. Advance & Loan Division: It is really hard to work in this department for the first time and I become very disappointed by later on I worked hard and learned how to deal with this. I was in this division for the next 2 weeks. Although much work was not assigned me, I assist this section in the following way:  Accept customer loan offer.  Discuss with person about loan.  Create new file for loan application.  Prepare Documentation form.  Observe evaluation paper.  Fill up CIB inquiry form.  Sorting the loan form and put that form in according to customers file.  Create sanction letter.  Observe cheque list. 3.1.3 My Observation: As internship is an important learning experience so I completed my internship at Janata Bank Ltd. I had a lot of pleasurable moment but more importantly finally understood working by actually being there. This practical orientation is really necessary for the development and preparation of personnel before entering in any professional area. The things that I have learned and experienced at JBL are:  Meaning and understanding the responsibilities.  Necessity of commitment.  Punctuality and regularity is important.  Ability to interact with different sorts of people.  Accumulated valuable work-related skills.
  • 19. “Financial Performance Analysis: AStudyonJanataBank Ltd.” Department of Accounting and Information Systems, Comilla University. Page | 19 4.1 Literature Review Financial performance analysis is the process of determining the operating and financial characteristics of a firm from accounting and financial statements. The goal of such analysis is to determine the efficiency and performance of firm’s management, as reflected in the financial records and reports. Finance always being disregarded in financial decision making since it involves investment and financing in short-term period. Further, also act as a restrain in financial performance, since it does not contribute to return on equity (Rafuse, 1996). Dilemma in financial management is to achieve desired trade off between liquidity, solvency and profitability (Lazaridis et al., 2007). Management of working capital in terms of liquidity and profitability management is essential for sound financial recital as it has a direct impact on profitability of the company (Rajesh and Ramana Reddy, 2011). The crucial part in managing working capital is required maintaining its liquidity in day-to-day operation to ensure its smooth running and meets its obligation (Eljelly, 2004). Ultimate goal of profitability can be achieved by efficient use of resources. It is concerned with maximization of shareholders or owners wealth (Panwala, 2009). It can be attained through financial performance analysis. Note that the terms ‘performance’ and ‘effectiveness’ are used interchangeably because problems related to their definition, measurement and explanation are virtually identical (March and Sutton 1997). Financial analysis offers a system of appraisal and evaluation of a firm’s performance and operations; it is the analysis of the financial statement of an enterprise. Financial analysis is the process of identifying the financial strengths and weaknesses of the firm by properly establishing relationship between the items of the balance sheet and the profit and loss account (Pandey ,1979). The analysis of financial statement can be best done by various yardsticks of which, the important is known as ratio or percentage analysis. Financial Statements (income statement, cash flow statement, owners’ equity statement and balance sheet) contain a wealth of information which, if properly analyzed and interpreted, can provide valuable insights into a firm’s performance and position. Performance measurement of public enterprises has been the subject matter of discussion for planners, administrators, managers, economists and academics since long. But some lack of clarity about performance and the existence of defensive attitude on the part of those who have to take responsibility for inefficient operations have the effect of inhibiting both frame discussion and decisive action in this regard Bunnett(1987). Trade creditors are interested in the firm’s ability to meet their claims.The suppliers are concerned with the firm’s solvency and survival. They analyze the firm’s profitability over time. Long term creditors place more emphasis on the firm’s solvency and profitability. The investors are most concerned about the firm’s earnings.
  • 20. “Financial Performance Analysis: AStudyonJanataBank Ltd.” Department of Accounting and Information Systems, Comilla University. Page | 20 The concept of financial performance of the banks based on the financial ratio is applied by different researcher and the following is the summary of past studies and their results about the performance of the banks: In his study, (Tarawneh, 2006) divided the commercial banks in Oman in cohesive categories depending on their financial characteristics revealed by financial ratios. Financial ratios are the simplest tools for evaluating the financial performance of the firm Wen-Cheng LIN ET. Al (2005). One can employ financial ratios to determine a firm’s liquidity, profitability, solvency, and capital structure and assets turnover. Altman (1968) used financial ratios to predict corporate bankruptcy. He found that the bankruptcy model has an accuracy rate of 93% and is very successful in predicting failed and non-failed firms. Ohlson (1980) employed financial ratios to predict a firm’s crisis. He found that there are four factors affecting a firm’s vulnerability. These factors are the firm’s scale, financial structure, performance and liquidity. The operational efficiency and asset management, in adding to the bank size, positively influenced the financial performance of these banks Khizer et.al. (2011), in his study about profitability indicators of banks in Pakistan for the period of 2006-2009 find that profitability is directly and positively affected by operating efficiency, assets management ratios, and size when using ROA as profitability indicator. The association between profitability and other indicators is different, when using ROE as profitability indicator. ROE is positively related with assets management and negative association is finding with size and operating efficiency. Sidqui and Shoaib, (2011) concluded in their study “Measuring performance through capital structure in Pakistan” that size of the bank plays an important role in determining the profitability of the bank using ROE as profitability measure. The comparative financial performance of banking sector conducted by using CAMELS rating system (Nimalathasan, 2008). The performance of Malaysian Islamic bank carried out by using financial ratios(Samad and Hassan).The south African commercial banks performance measured by financial ratios analysis (kumbiari and Webb,2010). Performance of selected Indian commercial banks has done by view growth in asset, profit, revenue, investment and deposit (Jaladhar, Anchula and Achari, 2011).
  • 21. “Financial Performance Analysis: AStudyonJanataBank Ltd.” Department of Accounting and Information Systems, Comilla University. Page | 21 5.1 Performance Performance refers to both quantity & quality of work done. The accomplishment of a given task measured against present standards of accuracy, completeness, cost and speed. In a contract, performance is deemed to be the fulfillment of an obligation, in a manner that releases the performer from all liabilities under the contract. Performance measures the total return of an investment provides over a specific period. It can be positive, representing a gain in value, or negative representing a loss. 5.2 Financial Performance Financial Performance is a subjective measure of how well a firm can use assets from its primary mode of business and generate revenues. This term is also used as a general measure of a firm's overall financial health over a given period of time, and can be used to compare similar firms across the same industry or to compare industries or sectors in aggregation. 5.3 Financial Performance Analysis Financial performance analysis is the process of identifying the financial strengths and weaknesses of the firm by properly establishing the relationship between the items of balance sheet and profit and loss account. It also helps in short-term and long term forecasting and growth can be identified with the help of financial performance analysis. The dictionary meaning of ‘analysis’ is to resolve or separate a thing in to its element or components parts for tracing their relation to the things as whole and to each other. The analysis of financial statement is a process of evaluating the relationship between the component parts of financial statement to obtain a better understanding of the firm’s position and performance. This analysis can be undertaken by management of the firm or by parties outside the namely, owners, creditors, investors. Standards also require auditors to obtain an understanding of the measurement and review of the entity’s financial performance, including both internal and external measures. Such measures might include:  Key ratios and operating statistics.  Key performance indicators.  Employee performance measures and incentive compensations plan.  Industry trends.  The use of forecast, budgets, and variance analysis.  Analyst reports and credit rating reports. 5.4 Major Steps of Financial Performance Analysis Financial performance analysis is something of an art. Experienced managers, investors and analysts develop a data bank of information over time, and after doing many such analyses, that they bring to bear every time they review a company.
  • 22. “Financial Performance Analysis: AStudyonJanataBank Ltd.” Department of Accounting and Information Systems, Comilla University. Page | 22 Step 1: Acquire the company’s financial statements for several years. As a minimum, get the following statements, for at least 3 to 5 years.  Statement of Financial Position.  Statement of Comprehensive Income.  Statement of Changes in Owners’ Equity.  Statement of Cash Flows. Step 2: Quickly scan all of the statements to look for large movements in specific items from one year to the next. For example, did revenues have a big jump, or a big fall, from one particular year to the next? Did total or fixed assets grow or fall? If there is anything that looks very suspicious, research the information about the company to find out why. Step 3: Review the notes accompanying the financial statements for additional information that may be significant to analysis. Step 4: Examine the Statement of Financial Position. Look for large changes in the overall components of the company's assets, liabilities or equity. Step 5: Examine the Statement of Comprehensive Income. Look for trends over time. Calculate and graph the growth of the following entries over the past several years.  Revenues (sales)  Net income (profit, earnings) Step 6: Examine the Statement of Changes in Owners’ Equity. Has the company issued new shares, or bought some back? Has the retained earnings account been growing or shrinking? Why? Are there signals about the company's long-term strategy here? Step 7: Examine the Statement of Cash Flows, which gives information about the cash inflows and outflows from operations, financing, and investing. Step 8: Calculate financial ratios in several categories, for each year. Step 9: Obtain data for the company’s key competitors, and data about the industry. Step 10: Finally, the result obtained by means of application of financial tools is evaluated. 5.5 Financial Statements Financial Statements refers to formal and original statements prepared by a business concern to disclose its financial information. According to John.N.Meyer, “The financial statement provides summary of accounts of a business enterprise, the balance sheet reflecting assets, liabilities and capital as on a certain date and the income statement showing the result of operation during a certain period”. The financial statements are prepared with a view to
  • 23. “Financial Performance Analysis: AStudyonJanataBank Ltd.” Department of Accounting and Information Systems, Comilla University. Page | 23 depict the financial position of the concern. They are based on the recorded facts and are usually expressed in monetary terms. The financial statement are prepared periodically that is generally for the accounting period. The term financial statement has been widely used to represent four statements prepared by accountants at the end of specific period. They are:  Statement of Financial Position.  Statement of Comprehensive Income.  Statement of Changes in Owner’s Equity.  Statement of Cash Flows. 5.6 Objectives of Financial Performance Analysis and Interpretation The users of financial statement have definite objectives to analysis and interpret. Therefore; there are variations in the objectives of interpretation by various classes of people. However, there are certain specific and common objectives which are listed below:  To interpret the profitability and efficiency of various business activities with the help of profit and loss account.  To measure managerial efficiency of the firm.  To ascertain earning capacity in future period.  To measure short-term and long -term solvency of the business.  To determine future positional of the concern.  To measure utilization of various assets during the period.  To compare operational efficiency of similar concerns engaged in the same industry. 5.7 Financial Analysis Tools Financial analysis tools are one of the most efficient ways that can be used for ensuring good profit from investments. These financial analysis tools are highly helpful in evaluating the market and investing in a way so as to maximize the profit from the investments made. These financial analysis tools are useful for deciphering both internal and external information related to a specific business organization. The analysis and interpretation of financial statement is used to determine the financial position and result of operation as well. The following are the tools that are used for analyzing the financial position of the company:  Horizontal Analysis  Vertical Analysis  Ratio Analysis  Economic value added (EVA) Analysis  Market value analysis
  • 24. “Financial Performance Analysis: AStudyonJanataBank Ltd.” Department of Accounting and Information Systems, Comilla University. Page | 24 5.7.1 Horizontal Analysis: Horizontal analysis involves calculating the percentage change of the categories of financial statements over time. For example, one may be interested in the trend of a company's operating expenses. By examining the percentage change from year one to year two in operating expenses, he/she can determine whether costs are shrinking or growing. However, horizontal analysis has its drawbacks. This technique does not take into account the changing size of v business. Going back to the expense example, a manager may be concerned that the company's expenses are growing every year, but if the business is growing, there is no cause for concern. 5.7.2 Vertical Analysis: Vertical analysis is the process of reporting each item on a set of financial statements as a percentage of a larger item. On the income statement, items are usually reported as a percentage of sales, and on the balance sheet items are usually reported as a percentage of total assets. A single vertical analysis is not very useful to most managers, but using the results of a vertical analysis to compare ratios across time or to see how a company measures up to industry benchmarks can help a management team determine areas of strength and weakness. 5.7.3 Ratio Analysis: Ratio analysis is a family of techniques that involves computing common ratios of different balance sheet and income statement categories and comparing these ratios to those of other companies or widely established benchmarks. Some ratios, such as profit margin or return on assets, are so common that they are part of the business vernacular. Others, such as day’s sales outstanding or collection cycle, may be initially unfamiliar but quite useful. A ratio exists for nearly every business metric, so learning these tools can be daunting; however, the ability to precisely gauge performance is useful when investigating specific concerns about a firm. 5.7.4 Economic value added (Eva) Analysis: EVA (Economic Value Added) is modern financial measurement tool that determines if a business is earning more than its true cost of capital (Gabriela et al, 2009). While analyzing performance of AXIS bank in terms of capital adequacy ratios and correlation analysis is used (Shrivastava et al, 2011). The analysis includes CAMELS rating and multivariate regression analysis for comparing financial performance commercial banks (Jha and Hui, 2012). Using data for Taiwan Province of China, Lin, Penm, Garg, and Chang (2005) study the direct effects of capital regulations and capital requirements.
  • 25. “Financial Performance Analysis: AStudyonJanataBank Ltd.” Department of Accounting and Information Systems, Comilla University. Page | 25 5.7.5 MarketValue Analysis: Market value analysis (MVA) is simply the difference between the current total market value of a company and the capital contributed by investors. As a wealth metric it measures the level of value, the bank has accumulated over time. 5.8 Groups of FinancialRatios Financial ratios can be divided into four basic groups or categories: i. Liquidity ratios ii. Activity ratios iii. Debt ratios iv. Profitability ratios Liquidity, activity, and debt ratios primarily measure risk, profitability ratios measure return. In the near term, the important categories are liquidity, activity, and profitability; because these provide the information that is critical to the short fully weather the short run. 5.8.1 Analyzing Liquidity: The liquidity of a business firm is measured by its ability to satisfy its short term obligations as they come due. Liquidity refers to the solvency of the firm’s overall financial position. Importance of Liquidity Ratios: 1. Cash Flow: A company's cash flow is the money in profits that it is taking in at any one time. This money is available for immediate spending by the company without any need to go through a process of liquidation or selling. Any company's cash flow is subject to change as demand rises and falls as part of the basic economic process. High cash flows allow businesses to take on greater debt without lowering their liquidity ratios. 2. Assets: Private companies typically have a variety of assets that have different degrees of liquidity. It is easier, for instance, to sell and make a profit off of land than it is to sell a department. Assets can be counted as part of a typical liquidity ratio based on what they would sell for on the immediate common market. Often, assets will be undervalued by the market at any time, which makes them less certain. 3. Financing: It is a part of the basic functioning of the modern business. Without the ability to take out debt, even large businesses would find it very difficult to operate. Debt is necessary not only to finance new projects but often to manage the everyday expenses of a business. Financing allows businesses to expand while also providing them with flexibility as regards to shifts in demand. The higher a business' liquidity ratio, the more it can do.
  • 26. “Financial Performance Analysis: AStudyonJanataBank Ltd.” Department of Accounting and Information Systems, Comilla University. Page | 26 4. Controversy: Controversy has followed in the wake of certain financial scandals over how much liquidity private institutions such as banks should be required to maintain. Certain major banks failed due to the lack of funds they had available to pay their debts. The failure of financial institutions threatens not only their investors but the entire economy for which they form an infrastructure. Various countries around the world have begun to require higher liquidity in private banking. The three basic measures of liquidity are:  Net working capital = Current Assets – Current Liability  Current ratio = Current Assets / Current Liability  Quick Ratio = Cash + Government Securities + Receivable / Total Current Liabilities 5.8.1. 1 Net Working Capital: Net Working Capital, although not actually a ratio is a common measure of a firm’s overall liquidity. A measure of liquidity is calculated by subtracting total current liabilities from total current assets. Net Working Capital =Total Current Assets –Total Current Liabilities. 5.8.1. 2 Current Ratio: One of the most general and frequently used of these liquidity ratios is the current ratio. Organizations use current ratio to measure the firm’s ability to meet short-term obligations. It shows the bank’s ability to cover its current liabilities with its current assets. The current ratio is equal to (current assets) / (current liabilities). Current assets are assets that should be convertible to cash within a year. Current liabilities are debt obligations that are due within a year. The current ratio is current assets divided by current liabilities, and measures the liquidity of a company over a short time period. Even if a company has a great business, no long-term debt, tons of cash flow, and a great brand, it can still fall into a lot of trouble if it doesn’t keep enough short-term cash available to cover its immediate needs. The higher the current ratio, the safer and more liquid the company is in terms of short-term needs. Current Ratio = Current Asset/Current Liabilities Standard ratio: 2:1 5.10.1.3 Quick Ratio: The quick ratio is a much more exacting measure than current ratio. This ratio shows a firm’s ability to meet current liabilities with its most liquid assets. The quick ratio is equal to (current assets – inventories) / current liabilities. It’s the same as the current ratio except that it doesn’t count inventories in the asset category. This means that the quick ratio is a more
  • 27. “Financial Performance Analysis: AStudyonJanataBank Ltd.” Department of Accounting and Information Systems, Comilla University. Page | 27 conservative estimate of liquidity than the current ratio. The reason inventories are excluded is because depending on the company and its products, inventories may not be readily convertible into cash. The higher the quick ratio, the safer and more liquid the company is in terms of short-term needs. Quick Ratio=Cash + Government Securities + Receivable / Total Current Liabilities. Standard ratio: 1:1 5.8.1.4 Operating Cost to Income Ratio: It measures a particular Bank’s operating efficiency by measuring the percent of the total operating income that the Bank spends to operate its daily activities. It is calculated as follows: Cost Income Ratio = Total Operating Expenses / Total Operating Income 5.8.2 Analyzing Activity: Activity ratios measure the speed with which accounts are converted into sale or cash. With regard to current accounts measures of liquidity are generally inadequate because differences in the composition of a firm’s current accounts can significantly affects its true liquidity. A number of ratios are available for measuring the activity of the important current accounts, which includes inventory, accounts receivable, and account payable. The activity (efficiency of utilization) of total assets can also be assessed. 5.8.2.1 Total Asset Turnover: The total asset turnover indicates the efficiency with which the firm is able to use all its assets to generate sales. Total Asset Turnover = Sales/ Total Asset 5.8.2.2 Investment to Deposit Ratio: Investment to Deposit Ratio shows the operating efficiency of a particular Bank in promoting its investment product by measuring the percentage of the total deposit disbursed by the Bank as long and advance or as investment. The ratio is calculated as follows: Investment to Deposit Ratio = Total Investments / Total Deposits 5.8.2.3 Inventory Turnover: A ratio showing how many times a company's inventory is sold and replaced over a period.
  • 28. “Financial Performance Analysis: AStudyonJanataBank Ltd.” Department of Accounting and Information Systems, Comilla University. Page | 28 Inventory Turnover= Cost of goods sold/ Average Inventory The days in the period can then be divided by the inventory turnover formula to calculate the days it takes to sell the inventory on hand or "inventory turnover days". This ratio should be compared against industry averages. A low turnover implies poor sales and, therefore, excess inventory. A high ratio implies either strong sales or ineffective buying. High inventory levels are unhealthy because they represent an investment with a rate of return of zero. It also opens the company up to trouble should prices begin to fall. 5.8.2.4 Average Collection Period: Average collection period is useful in evaluating credit and collection policies. This ratio also measures the quality of debtors. It is arrived at by dividing the average daily sales into the accounts receivable balance: Average Collection Period=Accounts receivable/ (Credit sales/365) A short collection period implies prompt payment by debtors. It reduces the chances of bad debts. Similarly, a longer collection period implies too liberal and inefficient credit collection performance. It is difficult to provide a standard collection period of debtors. 5.8.2.5 Average Payment Period: Average payment period ratio gives the average credit period enjoyed from the creditors that means it represents the number of days by the firm to pay its creditors. A high creditor’s turnover ratio or a lower credit period ratio signifies that the creditors are being paid promptly. This situation enhances the credit worthiness of the company. However a very favorable ratio to this effect also shows that the business is not taking the full advantage of credit facilities allowed by the creditors. It can be calculated using the following formula: Average Payment Period=Accounts payable/ Average purchase per day 5.8.2.6 Fixed Asset Turnover: A financial ratio of net sales to fixed assets. The fixed-asset turnover ratio measures a company's ability to generate net sales from fixed-asset investments - specifically property, plant and equipment (Paande) - net of depreciation. A higher fixed-asset turnover ratio shows that the company has been more effective in using the investment in fixed assets to generate revenues. The fixed-asset turnover ratio is calculated as: Fixed Asset Turnover=Gross Turnover/ Net fixed assets
  • 29. “Financial Performance Analysis: AStudyonJanataBank Ltd.” Department of Accounting and Information Systems, Comilla University. Page | 29 Importance of Activity Ratios: Credit to Deposit Ratio: A commonly used statistic for assessing a bank's liquidity by dividing the banks total loans by its total deposits. This number, also known as the LTD ratio, is expressed as a percentage. If the ratio is too high, it means that banks might not have enough liquidity to cover any unforeseen fund requirements; if the ratio is too low, banks may not be earning as much as they could be. Cost Income Ratio: Cost/Income ratio is the ratio between operating expenses and operating income. It is a measure of how costs are changing compared to income. It is one of the main key performance indicators of a bank's efficiency: the lower the ratio the more efficient the bank. Calculation of Average Collection Period: Also termed as Accounts receivable turnover, Average Collection Period is used to determine the duration of the average sales that a particular customer holds. A company can hope for larger investment in assets if the duration of collection period is longer. To measure the Average Collection period, net sales for each day or average daily sales should be calculated for a year. Now the average collection period will be calculated by diving each Average Daily sales into the account receivable. Definition for Inventory Turnover: Inventory turnover also falls under Activity Ratio which is used to calculate how many times investments or a firm in inventory turns over during a particular year. This ratio can be used to calculate the industry average. Companies prefer to choose High turnover ratios as it requires smaller investments in inventory. A firm must divide its cost of goods sold by inventory to calculate the inventory turnover. Definition for Fixed Asset Turnover: This is also termed as Total Asset Turnover which is basically used to calculate how a company’s fixed asset generates sales. Fixed assets can include buildings and land. An organization will have much investment in fixed sales if they opt for a low fixed asset turnover. A company should divide its sales by fixed assets in order to calculate its Fixed Asset Turnover. Usage in Activity Ratios in Business: Activity ratios help investors and managers to understand the current performance of their company. It also provides them necessary comparisons with competitors in the industry to understand where they are standing right now. Activity Ratio also provides a firm with successful historical trends followed in order to execute any change for business improvement. Activity Ratios also reduce the job of Fixed Asset management, which in turn helps the auditors to perform audits faster. 5.8.3 Analyzing Debt: The debt position indicates the amount of other people’s money being used in attempting to generate profits. In general, the more debt a firm uses in relation to its total assets, the greater its financial leverage, a term use to describe the magnification of risk and return introduced through the use of fixed-cost financing such as debt and preferred stock.
  • 30. “Financial Performance Analysis: AStudyonJanataBank Ltd.” Department of Accounting and Information Systems, Comilla University. Page | 30 5.8.3.1 Debt Ratio: The debt ratio measures the proportion of total assets provided by the firm’s creditors. Debt Ratio = Total Liabilities / Total Assets 5.8.3.2 Equity Capital Ratio: The ratio shows the position of the Bank’s owner’s equity by measuring the portion of total asset financed by the shareholders invested funds and it is calculated as follows: Equity Capital Ratio = Total Shareholder’s Equity / Total Assets The Ability to Service Debt: It refers the ability of a firm to meet the contractual payments required on a scheduled basis over the life of a debt. The firm’s ability to meet certain fixed charges is measured using coverage ratios. 5.8.3.3 Time Interest Earned Ratio: This ratio measures the ability to meet contractual interest payment that means how much the company able to pay interest from their income. Time Interest Earned Ratio=EBIT/ Interest The Importance of Debt in an Investment: When it comes to investing in dividend stocks, most people focus on things like growth levels, valuation (P/E), and stock dividends. A wise investor, however, also considers the debt levels of the company that he or she invests in. Debt levels in an organization are not emphasized enough in my opinion so this article shows a few things on the subject. 5.8.4 Analyzing Profitability: These measures evaluate the bank’s earnings with respect to a given level of sales, a certain level of assets, the owner’s investment, or share value. Without profits, a firm could not attract outside capital. Moreover, present owners and creditors would become concerned about the company’s future and attempt to recover their funds. Owners, creditors, and management pay close attention to boosting profits due to the great importance placed on earnings in the marketplace. 5.8.4.1 Operating Profit Margin: The Operating Profit Margin represents what are often called the pure profits earned on each sales dollar. A high operating profit margin is preferred. The operating profit margin is calculated as follows: Operating Profit Margin = Operating Profit / Sales
  • 31. “Financial Performance Analysis: AStudyonJanataBank Ltd.” Department of Accounting and Information Systems, Comilla University. Page | 31 5.8.4.2 Net Profit Margin: The net profit margin measures the percentage of each sales dollar remaining after all expenses, including taxes, have deducted. The higher the net profit margin is better. The net profit margin is calculated as follows: Net p rofit Margin = Net profit after Taxes / Sales 5.8.4.3 Return on Asset (ROA): Return on asset (ROA), which is often called the firms return on total assets, measures the overall effectiveness of management in generating profits with its available assets. The higher ratio is better. An indicator of how profitable a company is relative to its total assets. ROA gives an idea as to how efficient management is at using its assets to generate earnings. Calculated by dividing a company's annual earnings by its total assets, ROA is displayed as a percentage. Sometimes this is referred to as "return on investment". Return on Asset (ROA) = Net profit after Taxes / Total Assets 5.8.4.4 Return on Equity (ROE): The Return on Equity (ROE) measures the return earned on the owners (both preferred and common stockholders) investment. Generally, the higher this return, the better off the owners. The amount of net income returned as a percentage of shareholders equity. Return on equity measures a corporation's profitability by revealing how much profit a company generates with the money shareholders have invested. Return on Equity (ROE) =Net profit after Taxes / Stockholders Equity 5.8.4.5 Price/ Earnings Ratio (P-E ratio): The Price/ Earnings ratio (price-to-earnings ratio) of a stock is a measure of the price paid for a share relative to the income or profit earned by the firm per share. P/E ratio - Price per share / Earnings per share
  • 32. “Financial Performance Analysis: AStudyonJanataBank Ltd.” Department of Accounting and Information Systems, Comilla University. Page | 32 5.8.4.6 Earnings per Share (EPS): Earnings per share (EPS) are the earnings returned on the initial investment amount. EPS= Net income/No. of shares outstanding Importance ofProfitability Ratio:  Simple to use and understand.  The element of NPV in the venture will indicate which venture is more powerful as the most profitable venture will have the highest P.I. as the difference or net P.I. will continue to the company’s profitability.  It acknowledges time value for money and at the same time the NPV of a venture at its present value which is consistent with investment appraisal requirements.
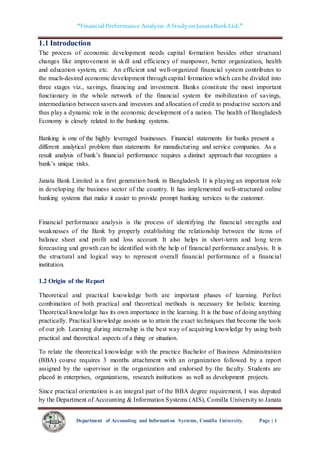
  • 33. “Financial Performance Analysis: AStudyonJanataBank Ltd.” Department of Accounting and Information Systems, Comilla University. Page | 33 6.1 Ratio Analysis 6.1.1 Liquidity Ratio: 6.1.1.1 Current Ratio: The current ratio, one of the most commonly cited financial ratios, measures the firm’s ability to meet its short term obligations. The higher the current ratio, the better the liquidity position of the firm. It is expressed as: (Current Assets/Current Liabilities) Year Ratio 2013 1.05 2012 1.01 2011 1.04 2010 1.03 2009 1.07 Table: Current Ratio of JBL Graphical Presentation: Figure: Current Ratio of JBL Interpretation: The higher the current ratio; the more liquid the firm is considered to be. But JBL, Current ratio is good because it maintains 1.05tk current assets against 1tk current liabilities whereas normally banking industry maintains 2:1 current ratio. This graph shows that, the current ratio is increased in year 2009 and decreased the following year. 0.95 1 1.05 1.1 2 0 0 9 2 0 1 0 2 0 1 1 2 0 1 2 2 0 1 3 1.07 1.03 1.04 1.01 1.05 Current Ratio Year
  • 34. “Financial Performance Analysis: AStudyonJanataBank Ltd.” Department of Accounting and Information Systems, Comilla University. Page | 34 6.1.1.2 Net Working Capital Net working capital, although not actually a ratio is a common measure of a firm’s overall Liquidity a measure of liquidity ratio calculated by. Net Working capital=Current Asset-Current Liabilities Table: Net Working Capital of JBL Graphical Presentation: Figure: Net Working Capital of JBL Interpretation: Net working capital of JBL is slightly decreased during the last two years. However, the bank faced problems to meet up its current obligations. So the Bank should increase its Current asset. 3238.93 3423.33 3365.65 2604.31 3147.34 0 500 1000 1500 2000 2500 3000 3500 4000 2009 2010 2011 2012 2013 Net working capital Years Year Net working Capital (taka in Millions) 2013 3147.34 2012 2604.31 2011 3365.65 2010 3423.33 2009 3238.93
  • 35. “Financial Performance Analysis: AStudyonJanataBank Ltd.” Department of Accounting and Information Systems, Comilla University. Page | 35 6.1.1.3 Acid Test Ratio: A stringent indicator that determines whether a firm has enough short-term assets to cover its immediate liabilities without selling inventory. The acid-test ratio is far more strenuous than the working capital ratio, primarily because the working capital ratio allows for the inclusion of inventory assets. It is expressed as: Acid Test Ratio :( Cash, Short-term Investments & Receivable / Current Liabilities) Year Ratio 2013 0.34 2012 0.36 2011 0.35 2010 0.29 2009 0.33 Table: Acid Test Ratio of JBL Graphical Presentation Figure: Acid Test Ratio of JBL Interpretation: Companies with ratios of less than 1 cannot pay their current liabilities and should be looked at with extreme caution. Furthermore, if the acid-test ratio is much lower than the working capital ratio, it means current assets are highly dependent on inventory 0.33 0.29 0.35 0.36 0.34 0 0.1 0.2 0.3 0.4 2009 2010 2011 2012 2013 AcidTest Ratio Year
  • 36. “Financial Performance Analysis: AStudyonJanataBank Ltd.” Department of Accounting and Information Systems, Comilla University. Page | 36 The standard ratio is 1:1. But the Acid test ratio of JBL is poor than standard. To improve this ratio, the JBL has to increase the cash, short-term investments & receivable and reduce the current liability. 6.1.2 Analyzing Activity Ratio: 6.1.2.1 Operating Expenses to Revenue (OER): A ratio that shows the efficiency of a company's management by comparing operating expense to net sales. Calculated as: Operating Expenses to Revenue =Total Operating Expenses/ Operating Income (revenue) Year Ratio 2013 57.16% 2012 62.94% 2011 57.81% 2010 44.00% 2009 36.04% Table: Operating Expenses to Revenue Graphical Presentation: Figure: Operating Expenses to Revenue Interpretation: We know that this ratio measures the operating efficiency of the bank by measuring the portion if the total operating costs relative to the total operating income of that bank and the 36.04% 44.00% 57.81% 62.94% 57.16% 0.00% 20.00% 40.00% 60.00% 80.00% 2009 2010 2011 2012 2013 Operating expense to revenue Years
  • 37. “Financial Performance Analysis: AStudyonJanataBank Ltd.” Department of Accounting and Information Systems, Comilla University. Page | 37 higher the ratio, the lower the operating efficiency. In 2009 the operating cost of JBL is low but after that it increasing. So it can be said that the operating efficiency of the JBL is not in good position compared to the past years that is they are not in good position to minimize their operating cost. 6.1.2.2 Total Asset Turnover Ratios: The total asset turnover indicates the efficiency with which the firm is able to use all its assets to generate sales. Calculated as: Total Asset Turnover= Operating Income/Total Asset Year Ratio 2013 4.23% 2012 3.48% 2011 3.95% 2010 5.34% 2009 4.48% Table: Total Asset Turnover of JBL Figure: Total Asset Turnover of JBL Interpretation: 0.00% 1.00% 2.00% 3.00% 4.00% 5.00% 6.00% 2009 2010 2011 2012 2013 4.48% 5.34% 3.95% 3.48% 4.23% Total asset turnover Years
  • 38. “Financial Performance Analysis: AStudyonJanataBank Ltd.” Department of Accounting and Information Systems, Comilla University. Page | 38 The banks total asset turnover ratio in 2009 - 2013 that is 4.5 to 4.2 times. We know the greater the total asset turnover, it is more efficient and 4 to 6 times is standard position but also depends on industry. JBL’s total asset turnover ratio is fluctuating year by year but in 2013 it’s increasing which is good sign for the bank. 6.1.2.3 Operating Expenses to Assets Ratio: The expense ratio of an asset fund is the total percentage of fund assets used for administrative, management, advertising and all other expenses. An expense ratio of 1% per annum means that each year 1% of the fund's total assets will be used to cover expenses. Calculated as: Operating Expense to Assets (OEA) =Total operating Expenses/ Total Assets Year Ratio 2013 2.42% 2012 2.19% 2011 2.28% 2010 2.35% 2009 1.74% Table: Operating Expense to Assets of JBL Graphical Presentation: Figure: Operating Expense to Assets of JBL Interpretation: 1.74% 2.35% 2.28% 2.19% 2.42% 0.00% 0.50% 1.00% 1.50% 2.00% 2.50% 3.00% 2009 2010 2011 2012 2013 Operating expense to assets ratio Years
  • 39. “Financial Performance Analysis: AStudyonJanataBank Ltd.” Department of Accounting and Information Systems, Comilla University. Page | 39 Expense ratios are important to consider when choosing a fund, as they can significantly affect returns. From the chart we see that there is an increase trend of operating expense to assets ratio. In 2009 the ratio is only 1.74% but It increased to 2.42% in the year 2013. That means operating expenses are increasing compared to previous years. 6.1.3 Analyzing Debt Ratio: 6.1.3.1 Debt Ratio: The debt ratio measures the preparation of total assets provided by the firm’s creditors. Debt ratio= Total Liabilities/Total Assets Year Ratio 2013 0.945 2012 0.947 2011 0.936 2010 0.927 2009 0.930 Table: Debt Ratio ofJBL Graphical Presentation: Figure: Debt Ratio ofJBL Interpretation: 0.93 0.927 0.936 0.947 0.945 0.915 0.92 0.925 0.93 0.935 0.94 0.945 0.95 2 0 0 9 2 0 1 0 2 0 1 1 2 0 1 2 2 0 1 3 DEBT RATIO Years
  • 40. “Financial Performance Analysis: AStudyonJanataBank Ltd.” Department of Accounting and Information Systems, Comilla University. Page | 40 The higher the ratio, the greater risk will be associated with the firms operations. In addition, high debt to asset ratio indicates low borrowing capacity of a firm, which in turn will lower the firm’s financial flexibility. This graph shows that, the debt ratio was increasing year by year. The Debt ratio measures the proportion of total assets provides by the firm’s creditors. Their debt ratio was increasing trend that indicates negative sign. 6.1.3.2 Times Interest Earned Ratio: The times interest earned ratio, sometimes called the interest coverage ratio, measures the firm’s ability to make contractual interest payments. Times Interest Earned Ratio =Earnings before Interest and Taxes/Interest Expense Year Ratio 2013 1.16 2012 1.10 2011 1.20 2010 1.37 2009 1.40 Table: Times Interest Earned Ratio of JBL Graphical Presentation: Table: Times Interest Earned Ratio of JBL Interpretation: 0 0.2 0.4 0.6 0.8 1 1.2 1.4 2009 2010 2011 2012 2013 1.4 1.37 1.2 1.1 1.16 Times interest earned ratio Years
  • 41. “Financial Performance Analysis: AStudyonJanataBank Ltd.” Department of Accounting and Information Systems, Comilla University. Page | 41 Time Interest earned ratio on JBL’s is satisfying but in last three years it was slightly decreasing. So JBL should maintain high ratio by minimizing its operating costs in order to get adequate earnings to satisfying interest obligations. A high ratio can indicate that a company has an unwanted lack of debt or is paying down too much debt with earnings that could be used for other projects. It measures the ability to meet interest payments as they come due. 6.1.4 Analyzing Profitability Ratio: 6.1.4.1 Investment to Deposit Ratio: It is expressed as: Investment to Deposit Ratio=Total Investment/Total Deposit Year Ratio 2013 0.303 2012 0.306 2011 0.328 2010 0.198 2009 0.225 Table: Investment to Deposit Ratio of JBL Graphical Presentation: Figure: Investment to Deposit Ratio of JBL Interpretation: Investment to Deposit Ratio shows that the amount of deposit which is used to as investment. JBL’s investment to deposit ratio is increasing year by year. That means, Bank is properly utilizing their deposit. 0.225 0.198 0.324 0.306 0.303 0 0.05 0.1 0.15 0.2 0.25 0.3 0.35 2009 2010 2011 2012 2013 Investment to deposit ratio Years
  • 42. “Financial Performance Analysis: AStudyonJanataBank Ltd.” Department of Accounting and Information Systems, Comilla University. Page | 42 6.1.4.2 Net Profit Margin: The net profit margin measures the percentage of each sales dollar remaining after all expenses, including taxes, have deducted. The higher the firm’s net profit margin is better. The net profit margin is a commonly cited measure of the company’s success with respect to earnings on sales Net Profit Margin=Net Profit After Tax/Operating Income Year Ratio 2013 0.165811 2012 0.147800 2011 0.200434 2010 0.267133 2009 0.352562 Table: Profit Margin Ratio of JBL Graphical Presentation: Figure: Profit Margin Ratio of JBL 0.352562 0.267133 0.200434 0.1478 0.165811 0 0.05 0.1 0.15 0.2 0.25 0.3 0.35 0.4 2009 2010 2011 2012 2013 Profit margin Ratio Years
  • 43. “Financial Performance Analysis: AStudyonJanataBank Ltd.” Department of Accounting and Information Systems, Comilla University. Page | 43 Interprétation: The Bank net profit margin in 2009-2013 that is (0.35-0.16) which indicates that profit margin is decreasing day by day and it’s not good situation. JBL’s net profit margin is decreasing which indicates that the banks profit is decreasing. The standard of profit margin ratio is 0.075, from the above graph we see that the JBL profit margin ratio is higher than the standard but it is decreasing in nature. 6.1.4.3 Return on Asset (ROA): The return on asset (ROA), which is often called the firm’s return on total assets, measures the overall effectiveness of management in generating profits with its available assets. The higher the ratio is better Return on Asset (ROA) =Net Profit after Tax/Total Asset Year Ratio 2013 0.60% 2012 0.30% 2011 0.75% 2010 1.31% 2009 1.50% Table: Rate of Return on Assets of JBL Graphical Presentation: 0.00% 0.20% 0.40% 0.60% 0.80% 1.00% 1.20% 1.40% 1.60% 2009 2010 2011 2012 2013 1.50% 1.31% 0.75% 0.30% 0.60% Return on assets Years
  • 44. “Financial Performance Analysis: AStudyonJanataBank Ltd.” Department of Accounting and Information Systems, Comilla University. Page | 44 Interpretation: Return on Asset (ROA) as an indicator of managerial efficiency, indicates the capability of management in converting the institution’s assets into net earnings. The banks return on asset decreasing from 1.50% to 0.60% in the preceding 5years. So the JBL earn less profit from the assets. This is not good for the bank. But in 2013 ROA is goes up than in 2012, it’s a good condition for the bank. To improve the ratio, the JBL has to increase the net income and control average total asset. 6.1.4.4 Return on Equity (ROE): The return on equity measures the return earned on the owner’s (both preferred and common stockholders’) investment. Generally higher the return indicates the better condition of the owner’s. Return on Equity=Net Profit after Tax/ Shareholders Equity Year Ratio 2013 10.61% 2012 7.00% 2011 13.14% 2010 18.57% 2009 22.27% Table: Return on Equity of JBL Graphical Presentation: Figure: Return on Equity of JBL Interpretation: 22.27% 18.57% 13.14% 7.00% 10.61% 0.00% 5.00% 10.00% 15.00% 20.00% 25.00% 2 0 0 9 2 0 1 0 2 0 1 1 2 0 1 2 2 0 1 3 RETURN ON EQUITY Years
  • 45. “Financial Performance Analysis: AStudyonJanataBank Ltd.” Department of Accounting and Information Systems, Comilla University. Page | 45 ROE is the measurement of rate of return flowing to the bank’s shareholders. It measures the net benefit that the stockholders have received from investing their capital in the bank. Higher ROE indicates the favorable position that the company is efficient in generating income on new investment. The banks return on equity deviates from 7% to 22.27%. In the preceding 5 years and the highest value can be observed in 2009 and the lowest value can be observed during the 2012, which is not desirable. The positive side is the ratio is increased by 3.61% from the preceding year. So the management should work hard to increase the return associated with equity. 6.1.4.5 Earnings per Share: The firm’s Earning per share (EPS) are generally of interest to present or prospective stockholders and management. The Earning per share represent the number of dollars earned on behalf of each outstanding share of common stock. The earnings per share is calculated as follows Earnings per Share =Earnings Available for Common stock Holder/No of shares of Common Stock Outstanding Year EPS 2013 2.15 2012 1.34 2011 2.75 2010 3.14 2009 3.5 Table: EPS of JBL Graphical Presentation: 0 1 2 3 4 2009 2010 2011 2012 2013 3.5 3.14 2.75 1.34 2.15 Earning per share Years
  • 46. “Financial Performance Analysis: AStudyonJanataBank Ltd.” Department of Accounting and Information Systems, Comilla University. Page | 46 Figure: EPS of the JBL Interpretation: EPS represents that it is earned on behalf of each outstanding shares of common stock equity. EPS is closely watched by investors because it is an important indicator of corporate success. The graph shows that, in 2009 earnings per share of JBL’s are higher than 2011 and 2012. EPS is decreasing that means bank’s operating result is also decreasing. But the year 2013 was the desirable year for the JBL. The year 2013 shows the increasing nature of EPS that is a good sign for the company. 6.1.4.6 Price Earnings Ratio: The price or earning (P/E) ratio is commonly used to assess the owners’ appraisal of share value. The P/E represents the amount investors are willing to pay for each dollar of the firm’s earnings. The higher the P/E ratio, the greater the investor’s confidence in the firm’s future. The price Earning (P/E) ratio is calculated as follows: Price Earnings Ratio=Market Price per Share/Earnings per Share Year Ratio 2013 8.50 2012 14.55 2011 7.04 2010 5.79 Table: Price Earnings Ratio of JBL Graphical Presentation: 5.79 7.04 14.55 8.5 0 2 4 6 8 10 12 14 16 2010 2011 2012 2013 Price earnings ratio Years
  • 47. “Financial Performance Analysis: AStudyonJanataBank Ltd.” Department of Accounting and Information Systems, Comilla University. Page | 47 Figure: Price Earnings Ratio of JBL Interpretation: The graph shows that, the price earnings ratio of JBL was good in year 2012 which represents the 14.55%. In the last year 2013 price earnings ratio was decreased to only 8.5% which is not satisfactory. To improve the ratio, the JBL has to increase market price per share and reduce earnings per share. This graph shows price earnings ratio that is increasing F.Y 2011 to 2012 and slight decreasing from 2012 to 2013. 6.2 Vertical/ Common Size Analysis Vertical/Common size statements came from the problems in comparing the financial statements of firms that differ in size. In the balance sheet, for example, the assets as well as the liabilities and equity are each expressed as a 100% and each item in these categories is expressed as a percentage of the respective totals. In the common size income statement, turnover is expressed as 100% and every item in the income statement is expressed as a percentage of turnover (sales). Here bank has no sales so that I have considered the operating income as 100%. Balance sheet As on December 31, 2013 & 2012 Common size Balance sheet Particulars 2013(In million) 2012(In million) 2013 2012 Property and Assets Cash: Cash in hand Balance with Bangladesh bank& agent bank 6171.51 27346.37 5840.11 25974.24 1.05% 4.66% 1.14% 5.08% 33517.80 31814.35 5.71% 6.22% Balance with other banks and Financial Institution 13011.20 12776.74 2.22% 2.49% Money at call and short notice 1528.57 6581.96 0.26% 1.28% Investments 193269.67 108342.04 32.97% 21.19% Loans and Advances 285747.65 305339.58 48.75% 59.73% Fixed Assets 9724.84 9462.69 1.65% 1.85%
  • 48. “Financial Performance Analysis: AStudyonJanataBank Ltd.” Department of Accounting and Information Systems, Comilla University. Page | 48 Other Assets Non-banking Assets 49283.17 36812.05 8.40% 7.20% Total Property and Assets 586082.98 511129.41 100% 100% Liabilities and shareholder’s equity Capital Borrowing from other banks 8659.23 11310.47 1.47% 2.21% Deposit and other Accounts 478535.57 409767.01 81.64% 80.16% Other Liabilities 61771.99 72575.25 10.53% 14.19% Total Liabilities 548966.78 493652.74 92.17% 94.35% Capital/Shareholders Equity 37116.20 17476.66 6.33% 3.41% Total liabilities and shareholders’ equity 586082.98 511129.41 100% 100% From the vertical analysis above, we can compare the percentage mark-up of asset items and how they have been financed. The strategies may include increase/decrease the holding of certain assets. The analyst may as well observe the trend of the increase in the assets and liabilities over several years. It can be observed that there is an increase in the holding of the current assets of the company. The management can seek the reasons of why the holding of these assets is continuously increasing. Though both the assets and liabilities are increasing but proportionately liabilities were a little higher than the assets, which may make some ratio lower. The above analysis also shows that total liabilities has increased so as stock holder’s equity , which indicates that JBL has more debt financing than equity.
  • 49. “Financial Performance Analysis: AStudyonJanataBank Ltd.” Department of Accounting and Information Systems, Comilla University. Page | 49 Profit and Loss Account For the year ended December 31, 2013 & 2012 Common size Profit and Loss Account Particulars 2013 2012 2013 2012 Total Operating Income 20859.03 22016.47 100% 100% Less: Total Operating Expenditure 8731.92 7482.67 72% 51.48% Profit Before Provision 12127.11 14533.8 28% 48.52% Less: Provision 1501.78 27368.70 7.19% (124.31%) Profit Before Tax 10625.33 (12834.9) 20.81% (75.79%) Less: Provision for Tax 1073.92 2445.43 5.14% 11.10% Net Profit After Tax 9551.41 (15280.33) 15.67% (86.89%) Add: Retained Surplus Brought Forward 1967.20 7.57 9.43% 0.03% 11518.61 (15272.76) 25.10% (86.86) A second method of common size analysis is a means of comparing figures within a single P & L. A common size profit and loss statement, for example, compares all components of the P & L to total operating income. In other words, Total operating income is defined as “100%” and all other figures on the statement are expressed as a percentage of that. In this way, we not only get an automatic indication of approximate profit margin, we also can see the importance of all of your costs and expenses relative to operating income. Vertical analysis can also be done on these common size percentages in order to identify trends in the relative sizes of categories like costs, expenses, or margins. The above analysis shows that JBL has higher net operating income in 2012 than 2013 and after tax net profit has increased in 2013 compared to 2012’s negative figure. On the other hand they paid higher
  • 50. “Financial Performance Analysis: AStudyonJanataBank Ltd.” Department of Accounting and Information Systems, Comilla University. Page | 50 tax in 2013. In the year 2013 JBL has comparatively higher expenditure, but marginally lower percentage, which is good sign for the bank. 6.3 Horizontal/ Trend Analysis It is conducted by setting consecutive balance sheet, income statement or statement of cash flow side-by-side and reviewing changes in individual categories on a year-to-year or multi year basis. The most important item revealed by comparative financial statement analysis is trend. Percentage change= (recent year-previous year)/previous year Items (Figure in million) 2013 % 2012 % 2011 Paid up Capital 19140.00 .74% 11000 0.35% 8125 Shareholders' Equity 37116.60 1.12 17476.66 (.48%) 34069.20 Total assets 586082.98 .14% 511129.41 .14% 446111.42 Total deposits 478,535.57 .16% 409,767.01 .13% 361702.03 Total loans &Advances 285,747.65 (.06%) 305,339.57 0.18% 258202.07 Total Investment 193269.67 .78% 108342.04 .16% 92826.25 Operating Income 20859.03 (.05%) 22016.47 (.04%) 23084.21 Operating expenditure 8731.92 .16% 7482.67 .03% 7224.55 Profit Before Provision 12127.11 (.16%) 14533.8 (.02%) 14859.65 Profit Before Tax 10625.33 (1.82%) (12834.9) (2.47%) 8684.89 Total Provision 1501.78 (.94%) 27368.70 3.43% 6174.76 Net Profit After Tax 9551.41 (1.62%) (15280.33) (4.62%) 4214.53
  • 51. “Financial Performance Analysis: AStudyonJanataBank Ltd.” Department of Accounting and Information Systems, Comilla University. Page | 51 A comparison of statements over several years reveals direction, speed and extent of a trend(s). The horizontal financial statements analysis is done by restating amount of each item or group of items as a percentage. Such percentages are calculated by selecting a base year and assign a weight of 100 to the amount of each item in the base year statement. Thereafter, the amounts of similar items or groups of items in prior or subsequent financial statements are expressed as a percentage of the base year amount. The resulting figures are called index numbers or trend ratios. The above analysis shows that JBL performance trend is quite better in 2013. Their capital was higher in 2013 as well as stockholders equity has also increased compared to 2012. 6.4 Eva Analysis Statement of Value Added and it’s Distribution Analysis: This shows that how the wealth is distributed among the stakeholders of JBL as well as how JBL has generated wealth by providing banking services, by taking into account the amount retained and re-invested for replacement and improvement of assets operations consequently. The comparative presentation of value added statement of the bank for the year 2013 and 2012 is illustrated below: Value added statement Particulars 2013 (In million) 2012 (In million) Income from banking services Less: Cost of services Value added from banking services Add: Non-banking income Less: Provisions made for the year Total Value Added Distribution of Value Addition: To employees (Salary, allowances and others) To government 55,071 (36,455) 18,616 (1,502) 17,114 6,104 1,074 49,516 (29,334) 20,182 (27,369) (7,187) (7,187) 5,320
  • 52. “Financial Performance Analysis: AStudyonJanataBank Ltd.” Department of Accounting and Information Systems, Comilla University. Page | 52 (Income Tax) To statutory reserve To expansion & growth i) Depreciation ii) Retained Profit Total distribution 1,967 385 7,584 17,114 2,445 328 (15,288) (7,187) Fig: Distribution of value addition in 2013 Economic Value Added Analysis: Economic value added (EVA) is a performance tool developed to measure the true economic profit produced by a company. It also frequently refers to as "economic profit", and provides a measurement of a Bank's economic success (or failure) over period of time. Such a metric is useful for shareholders’ who wish to determine how well the bank has produced value forts investors, and it can be compared against the Banks’ peers for a quick analysis of how well the bank is operating. Economic Value Added Statement Particulars 2013 2012 2011 Shareholders’ Equity Add: Cumulative provision 37,116.20 17,476.66 34,069.20 36% 6% 12% 2% 44% Distribution of value addition in 2013 Salaries allowance and others Income tax Statutory reserve Depreciation Retained profit
  • 53. “Financial Performance Analysis: AStudyonJanataBank Ltd.” Department of Accounting and Information Systems, Comilla University. Page | 53 for loans, investment and off- balance sheet exposures Total Invested Fund Average shareholders’ equity Earnings : Profit after tax Add: Provision for loans and others during the year Less: Written-off loan recovered during the year Earning for the year : Average cost of equity (based on weighted average rate of 10 years treasury bond issued by Bangladesh Government + 2% risk premium) Cost of average equity Economic value added Growth over last year 23,539.82 60,656.02 25,121.93 9,551.39 1,501.77 (42.62) 11,010,54 13.00% 3,265.85 7,744.69 16.97% 35,260.09 52,736.75 32,745.73 (15,280,34) 27,368,70 (883.10) 11,205.26 14.00% 4,584.40 6,620.86 7.29% 12,797.45 46,866.65 25,368.09 4,444.91 5,846.65 (918.77) 9,372.79 12.75% 3234.43 6,138.36 5.21%
  • 54. “Financial Performance Analysis: AStudyonJanataBank Ltd.” Department of Accounting and Information Systems, Comilla University. Page | 54 Fig: Economic Value Added 6.5 MarketValue Analysis Market value added (MVA) is simply the difference between the current total market value of a company and the capital contributed by investors. As a wealth metric it measures the level of value, the bank has accumulated over time. The formula used to find market value added is: Market Value Added = Market Value - Capital Invested Since JBL is not enlisted in share market, so it is not possible to calculate MVA in a regular method. Calculation of Market Value Added: Particulars Number of share Value per share (Tk.) Amount (BDT in million) Intensive value per share Book value 1,91,400,000 1,91,400,000 193.92 100 37,116,202,498 19,140,000,000 0 1000 2000 3000 4000 5000 6000 7000 8000 2011 2012 2013 6138 6621 7745 Economic value added (In million)
  • 55. “Financial Performance Analysis: AStudyonJanataBank Ltd.” Department of Accounting and Information Systems, Comilla University. Page | 55 Market value added 1,91,400,000 93.92 17,976,202,498 6.6 SWOT Analysis 6.6.1 Introduction of SWOT Analysis: SWOT Analysis is an important tool for evaluating the company’s Strengths, Weaknesses, Opportunities and Threats. It helps the organization to identify how to evaluate its performance and can scan the macro environment, which is turn would help the organization to navigate in the Turbulence Ocean of competition. SWOT analysis is commonly used in marketing and business in general as a method of identifying opposition for a new venture or strategy. Short for Strengths, Weaknesses, Opportunities and Threats, this allows professionals to identify all of the positive and negative elements that may affect any new proposed actions. SWOT analysis of Janata Bank Ltd is given below:
  • 56. “Financial Performance Analysis: AStudyonJanataBank Ltd.” Department of Accounting and Information Systems, Comilla University. Page | 56 6.6.2 Strengths:  Large customer base.  Strong capital and asset quality.  The bank is financially safe.  Community involvement.  Speedy foreign remittance payment system with Western Union Money Transfer.  The Image/Goodwill of the bank is very good.  The bank has huge amount of deposit and market potentiality.  Regulatory performance is strong and positive. 6.6.3 Weaknesses:  Lack of technological resources such as computerized banking as well as Internet banking.  Because of manual service, it is more costly and time consuming.  Lack of promotional activities.  Poor information based website.  There is no specific training institute for JBL employees.  The bank has more non-performing assets.  Incentive system is very weak than private bank.  Credit providing procedures are very lengthy. So most of the people fell boring to take loan. 6.6.4 Opportunities:
  • 57. “Financial Performance Analysis: AStudyonJanataBank Ltd.” Department of Accounting and Information Systems, Comilla University. Page | 57  Opportunity to increase retail banking due to available customer.  Government has taken some steps against illegal remittances.  The bank has many branches in the local areas of the country. So it can easily expand its activities  It has a good government patronization. So it is trustworthy to the people.  Janata Bank can attract the people by offering new schemes of deposits to the local area.  Government has banned some Jatiya Sanchoy Patras. 6.6.5 Threats:  Loan defaulter.  Political instability of the country.  The continuing increase in non-bank competitors offering similar services.  A large number of private banks are increasing in Bangladesh day by day by taking huge capital and skilled human resources.  Private Banks provide handsome salary to the employees.  Government facilities may be insufficient when the economic condition of the country becomes unfavorable.  Private Banks provide loan very quickly to the customers but JBL takes long time to do it. But at present, most of the people are very punctual. . 7.1 Findings Every study belongs some specific findings, my report is not exception to this. Throughout my internship period I had an opportunity to observe some unnoticed things of Janata Bank Limited (JBL). Those are given below:  The Liquidity Condition of Janata Bank Limited is quite Satisfactory. Its Liquidity Ratios are around its standard level and it has amount of loans as compared to total assets is average which resulted in an average risk.  The bank’s ROA has increased to 0.60% in 2013 than the year 2012 which is within moderate satisfactory level because it was much better in the year 2009 and 2010.
  • 58. “Financial Performance Analysis: AStudyonJanataBank Ltd.” Department of Accounting and Information Systems, Comilla University. Page | 58  The bank’s return on equity is in decreasing trend. In the previous year 2009 and 2010 the ratio was very satisfactory. It decreased in 2012 but in 2013 it increased to 10.61%.  Its operating expenses have increased to 8731.92 million from 7482.67 million in 2013 due to increase of branches and employees. And for this its net interest margin, net operating margin are also decreasing.  The debt ratio has increased year by year. The Debt ratio measures, the proportion of total assets provides by the firm’s creditors. Their debt ratio was increasing to 0.945 in 2013 that indicates negative sign for the bank.  EPS is closely watched by investors because it is an important indicator of corporate success. Analysis shows that, in 2009 earnings per share of JBL’s were higher than 2011 and 2012. Net profit margin decreasing that means bank’s operating result is decreasing. The year 2013 shows that EPS increased to 2.15 that is a good sign for the company.  The banks earning assets to total assets are quite satisfactory and its fixed assets turnover is 4.23% in 2013 which indicates a good asset management of JBL.  From the vertical analysis we see that both the assets and liabilities have increased to 586082.98 million in 2013 but proportionately liabilities were a little higher than the assets, which may make some ratio lower. The analysis also shows that total liabilities and stock holder’s equity have increased to 548966.78 million and 37116.60 million which indicates that JBL has more debt financing than equity. Profit and loss account shows that JBL After tax net profit has increased to 9551.41 million in 2013 by recovering the negative income of 2012. On the other hand they paid higher tax in 2013. In the year 2013 JBL has comparatively higher expenditure which is 8731.92 million, but ultimately it reaches its positive income figure.  The horizontal analysis shows that JBL performance trend is quite better in 2013. Their capital and stockholders equity has increased to 19140 million and 37116.60 million in 2013.  Economic value added (EVA) analysis confirm us the sound operation of Janata bank limited as its economic profit is increasing throughout last three years from 6138.36 million to 7744.69 million in 2013 which is very satisfactory for any bank.  The market value analysis shows that the bank’s market performance is increasing which is indicated by increasing market value per share of Tk 193.92 from Tk 100.  Overall the financial position of JBL is quite satisfactory compare to other government commercial bank. Despite of severe unfavorable economic condition of
  • 59. “Financial Performance Analysis: AStudyonJanataBank Ltd.” Department of Accounting and Information Systems, Comilla University. Page | 59 last few years, JBL achieved worthy performance in all core areas of banking operation. 7.2 Recommendations This report is prepared on the basis of financial performance analysis. The report has attempted to give details of financial performance. In preparing the report it is understood that financial performance is not a simple matter, rather it is the parents of all analysis of a bank. During my internship period it has become easy to understand each and every part of this section. Nevertheless it will again recommend some issues that will be useful for the operation of financial performance.
  • 60. “Financial Performance Analysis: AStudyonJanataBank Ltd.” Department of Accounting and Information Systems, Comilla University. Page | 60  Operational efficiency should be increased by reducing cost and wastage and improving operating and management performance. Supply of working capital should be adequate.  Changing in deposit showing lower trend it should be taken under consideration.  To concentrate more to increase return on asset and return on equity ratios by ensuring maximum utilization of its assets.  To ensure the continuous upward movement of net interest income by raising efficiency and proper utilization of deposit.  In the branch, most of the employees are working so many extra times, so management should provide some extra incentives to motivate the employee.  The training evaluation process and form is to be more modernized.  Number of branches can be increased to create employment opportunity.  The Banks should regularly make use of ratio analysis and measure should be taken to improve undesirable ratios.  Qualified, trained and experienced management personnel should be appointed.  Government regulations should be flexible and policy should be realistic.  Liquidity position of the Bank should be improved by reducing current liabilities.  A reasonable credit policy should be implemented, so that the main portion of profit does not spend in payment of fixed charges.  Accountability and motivation for achievement of performance should be fixed up. 7.3 Conclusion Janata Bank Limited (JBL), setting new standards in the banking arena in the time of turbulent economic conditions. As part of the long-term financial reform and modernization plan of the government, the bank had been converted into a public limited company. JBL helps to mobilize the resources to stay strong in the key areas of operation. In the areas of treasury operation, JBL remains the key player in the country’s foreign exchange and money market enhancing profitability through careful pricing and assessment of risk and return on investment, the treasury dealing is being strengthened to facilitate transactions requiring more sophisticated products and services for larger institutional and corporate clients. Though it