SlideShare uma empresa Scribd logo
1 de 14
Baixar para ler offline
INVESTMENT MANAGEMENT
Purchase Recommendation
Verisk Analytics, Inc.
September 26, 2016
Current Ratings:
Moody's S&P Egan-Jones Fitch Internal NAIC
Baa3 BBB- BBB BBB+ Baa2 2
Range ofinternal Rating: Baa3 to Baa1
Status: Current Holdings: No
Recommendation
Verisk Analytics (VRSK) operates in the broadly defined business and consumer services industry
i
, primarily
providing data and decision support solutions that enable customers to better understand and manage risk.
This industry consists of many sub-markets, which are generally dominated by a few (in many cases by 1 or
2) major players and many small ones offering point product solutions. This is primarily due to inherent
barriers to entry in that industry, which include: 1) proprietary database sets, which are hard, in some cases
virtually impossible, to replicate; 2) sticky customer relationships due to contractual-based revenues,
limited vendor choice, and products and services which are embedded in customers’ work flows; 3) and as a
result of 1 and 2, high switching costs.
VRSK has established leading positions in sub-markets, primarily serving customers in the Insurance,
Financial Services, and Energy industries. This position is the result of 1) its industry leading proprietary
databases, which are constantly growing, making it harder for potential competitors to enter and customers
to switch; 2) high customer retention, underpinned by a diverse customer base; 3) emphasis on improving
its product offerings and services (in many cases in close collaboration with customers
ii
); and 4) acquiring
companies with complementary products and business models.
Moody’s and S&P rate the company at a low triple B level due to the company’s history of acquisitions and
shareholder friendly policy (stock buyback, no dividends, which provides more flexibility). The internal
rating is a notch higher than Moody’s’ and S&P’s ratings due to the company’s strong defensible,
competitive position, thus resulting in strong cash flow generation and exceptionally high EBITDA margins
(approximately 45%), and management’s commitment and demonstrated ability to de-lever quickly
following acquisitions and curtail stock buybacks when leverage spikes above the company’s target 2.5x
(limited by its bank agreement to go up to up to 3.75x for 12 months following an acquisition
iii
).
Company Profile
VRSK was founded in 1971 in Jersey City, New Jersey, under the name Insurance Services Office, Inc. (ISO
1
)
and went public in 2008. The impetus for the company’s formation was the need to centralize
(underwriting) data gathering from the property and casualty insurance industry in order to help the
industry fulfill regulatory reporting requirements and to help individual companies determine insurance
premium pricing (vital functions determining insurance companies’ profitability).
1
Verisk was initially formed as a wholly-owned subsidiary of ISO. On October 6, 2009, in connection with the IPO, the Company
2
An important aspect of the database business model, and VRSK’s in particular, is the overlap between the
suppliers and customers, in other words data suppliers are also customers of the resulting aggregated data
and resulting solutions. This leads to the following self reinforcing dynamic: every time a new
customer/data supplier joins, the overall utility/value of the database increases to each individual
customer; consequently this tends to limit competition and in certain cases leads to winner take all
situations; this dynamic is also known as network effects or demand-side economies of scale, defined as
follows—when a product or a service becomes more valuable to its users as more people use it
iv
.
Currently, the company has two reporting segments as follows:
The company’s Risk Assessment segment (33%/48% of consolidated 2015 revenues/operating income) is
its legacy business, and serves the property and casualty (P&C) insurance industry primarily in the U.S. Main
services include: prediction of loss and selection, and pricing of risk. These solutions provide industry-
standard insurance programs that help P&C insurers define coverage (policy language) and issue policies.
The company also acts as a middleman by reporting premium and loss data from the insurers to the
regulators (mandated by law; VRSK is a designated “statistical agent” in all 50 states, Puerto Rico and the
District of Columbia). In addition to its industry-standard insurance program, the company also provides
property-specific services for its clients to evaluate and price personal and commercial property insurance,
as well as commercial liability insurance. Its customers utilize a proprietary database that contains loss
costs on more than 3.6 million commercial buildings in the U.S. and holds information on more than 6.4
million individual businesses occupying those buildings.
The company’s Decision Analytics segment (67%/52% of consolidated 2015 revenues/operating income)
develops predictive models to help predict loss, price risk, and detect fraud before or after an event. The
company built on its insurance background (the Risk Assessment segment), and ventured into
complementary markets via acquisitions
2
. VRSK’s services include: fraud detection, catastrophe modeling,
and building repair cost estimation (insurance clients); leading benchmarking tools, marketing and media
effectiveness solutions, and fraud solutions (financial services clients); supply chain solutions, climate
analytics, geopolitical risk analytics (specialized markets), and data analytics for the energy, chemicals and
mining verticals (energy markets).
Analysis Behind the Recommendation
 VRSK has established leading positions in a growing industry with high-barriers to entry
 Sticky customer relationships underpinned by a diverse customer base, contractual-based
revenues, collaborative product development, and high switching costs resulting in stable cash
flows and sustainably strong pricing power
 History of successful complementary acquisitions, in line with VRSK’s high margin business model
VRSK has established leading positions in a growing industry with high-barriers to entry
Based on one’s definition, the business services industry could vary widely in terms of the companies
comprising it, and consequently of the industry’s size. Interactive Data Corporation (IDC) estimated the
industry at approximately $59BN in 2015 (up from over $40BN in 2011), projecting it to grow at an annual
compounded growth rate of over 14% through 2019 to over $100BN
v
. IDC expects that this substantial
growth will be developing as a result of: 1) adoption of new technologies in combination with 2) a lack of
internal skill sets and data sets (such as overall industry wide technical or proprietary data).
The industry is fragmented and comprised of established companies, many of which have been around for
decades. VRSK does not have a direct competitor (on a product and services offering basis) but many point
product/solutions competitors (most of them smaller companies; many of which are privately owned or in
2
The expansion into analytics began with the acquisitions of American Insurance Services Group and certain operations and assets of
the National Insurance Crime Bureau in 1997 and 1998, respectively.
3
PEER GROUP CAPITAL ALLOCATION 10 YEAR AGGREGATE HISTORY
FICO 400$ 226$ 295$ 830$
I.H.S. 943$ 549$ 4,039$ n.a.
MSCI Inc 648$ 256$ 164$ 603$
Equafax Inc 1,695$ 955$ 2,347$ n.a.
The Dun & Bradstreet Corporation* 238$ 104$ 988$ 334$
S&P Global, Inc 1,646$ 1,322$ 3,822$ n.a.
FactSet Research Systems Inc 346$ 279$ 355$ n.a.
Moody's Corporation * 762$ 817$ 964$ 156$
Corporate Executive Board Inc* 302$ 232$ 879$ n.a.
Gartner Inc* 288$ 336$ 569$ 59$
Verisk Analytics Inc* 910$ 784$ 4,561$ 298$
Total 8,175$ 5,859$ 18,984$ 2,279$
Source: S&P Capital IQ, based on companies' 10-K filings
Depreciation
and
Amortization
Capital
Expenditures
Cash
Acquisitions
Research and
Development
Expenditures
some cases non-profit entities, such as the National Independent Statistical Service). However, there are
public companies which benefit from similar economic positions (proprietary databases, sticky customer
relationships, market leadership, and barriers to entry).
A couple of ways to observe/assess an industry’s barriers to entry and competitive dynamics quantitatively
are: 1) to compare the industry’s return on equity to the one of business in general; and 2) to observe how
participants achieve growth (internal development versus acquisition).
The first table below shows returns on equity and in some cases returns on capital for publicly traded
companies, which have similar economic models as VRSK’s. Return on capital was used in cases where
companies have bought back most or all of its equity capital, leaving some participants in a negative or very
low equity position. Highlighted in green is the key take away from this table, which shows the difference
between the peer group’s average return on equity and that of the S&P 500 group of companies (figures are
not adjusted for impairments and other items that could be considered transitory). Over the past decade,
this difference or excess return on capital/economic goodwill has been consistently substantial, indicating
barriers to entry and pricing power.
The table to the left shows the same group of
companies’ maintenance and growth capital
spend over the past decade. The key take
away is that industry participants have grown
by way of acquisition, which was over 3 times
higher than capital expenditures, in the
aggregate, over the past decade. This is
primarily the result of incumbents’ strong
competitive positions in their niches, which
are underpinned by proprietary datasets and
sticky customer relationships (it is easier to
enter a new market by way of acquisition than
to start from scratch). Of note, this
acquisition activity has resulted in significant
accounting goodwill on those companies’
balance sheets; over $17BN or 66% of the
26BN capital employed (debt and equity) in
the industry in 2015 (compared to approximately 18% of accounting goodwill to capital employed for the
S&P 500 group of companies
vi
) . This leads to a significant understatement of the peer group’s return on
equity figures in the top chart.
PEER GROUP RETURN ON EQUITY & *INVESTED CAPITAL HISTORY
2015 2014 2013 2012 2011 2010 2009 2008 2007 2006 2005
FICO 19.4% 19.3% 17.9% 19.6% 15.2% 12.0% 11.3% 14.4% 16.7% 13.3% 15.6%
I.H.S. 8.7% 8.8% 6.7% 10.7% 10.6% 12.2% 13.8% 12.0% 11.9% 11.2% 9.8%
MSCI Inc 19.7% 13.3% 13.4% 12.1% 14.4% 11.6% 20.6% 28.1% 15.8% 8.0% n.a.
Equafax Inc 19.0% 16.3% 15.9% 15.0% 13.9% 14.6% 15.3% 18.7% 24.9% 33.6% 37.4%
The Dun & Bradstreet Corporation* 42.2% 58.1% 78.8% 115.1% 106.3% 99.2% 215.6% 182.5% 161.8% 119.3% 67.4%
S&P Global, Inc 101.0% (10.9%) 46.0% 43.4% 32.3% 28.4% 45.9% 55.4% 47.9% 30.5% 27.7%
FactSet Research Systems Inc 46.2% 40.2% 36.3% 35.4% 33.6% 29.9% 30.0% 28.6% 28.5% 26.5% 33.2%
Moody's Corporation * 32.6% 35.2% 33.2% 41.4% 53.3% 62.0% 80.3% 112.0% 176.6% 127.6% 95.7%
Corporate Executive Board Inc* 16.4% 13.9% 11.9% 18.6% 74.3% 77.9% 161.0% 165.0% 36.3% 18.6% 17.5%
Gartner Inc* 31.0% 33.7% 31.5% 34.0% 33.2% 22.7% 20.0% 25.0% 21.8% 15.8% 12.2%
Verisk Analytics Inc* 15.4% 24.0% 21.7% 26.3% 34.5% 43.0% 172.7% n.a. n.a. n.a. n.a.
Peer Group Average 32.0% 22.9% 28.5% 33.8% 38.3% 37.6% 71.5% 64.2% 54.2% 40.4% 35.2%
Aggregate S&P 500 ROE 11.6% 13.8% 14.2% 13.4% 14.5% 14.2% 11.7% 4.7% 13.6% 16.9% 15.4%
Industry's Economic Goodwill 20.3% 9.1% 14.3% 20.3% 23.8% 23.4% 59.8% 59.5% 40.7% 23.6% 19.8%
Source: S&P Capital IQ, based on companies' 10-K filings
* Return On Invested Capital
4
The information in the table below is related to major products and services the company offers and it
covers the period between 2011 and 2015.
VRSK’s market positions related to the property and casualty market segment (over 64% of 2015 revenues)
are exceptionally strong. Of note, the market shares have been virtually unchanged over the 5 year period,
in mostly growing markets.
Two product offerings
(highlighted in yellow and green)
provide a good view of the
company’s overall competitive
position.
Through its industry standard
programs (highlighted in yellow,
over 25% of 2015 aggregate
revenues), VRSK is the most
comprehensive provider of
solutions to P&C insurers in
defining coverage and issuing
policies. The company serves all
top 100 P&C insurers. VRSK
provides a variety of products, including turnkey solutions that handle policy language rules and regulations
in setting up new coverage. ISO interacts with state regulators and processes over 3,000 regulatory filings
each year. VRSK acts as a “statistical agent” on behalf of P&C insurers when they send out data on
premiums and losses to state regulators. The company also processes 3.4 billion individual records of
insurance transactions. ISO computers store more than 19 billion records on insurance premiums collected
and losses paid. This data also grows by about 2 billion each year. Overall, it captures 70 to 75 percent of
the entire industry’s premium volume data. This database assists clients in pricing their risk to avoid
premium leakage (i.e., undercharging for a specified level of risk). Based on a conversation with Eva Huston,
VRSK’s CFO, ISO’s market share is well over 50%, probably closer to 80%. The competitive landscape in this
segment is minimal. P&C insurers either use VRSK’s solutions or use their own internal risk pricing systems.
Clients typically pay VRSK a yearly subscription fee due in 1Q. One-third of pricing is usually based on the
insurer’s size and two-thirds is based on premiums and the diversity of its clients (i.e., how many states and
lines of business an insurer has).
Through the company’s property-specific and underwriting information product (highlighted in green,~ 8%
of 2015 aggregate revenues), VRSK has data on over 3.6 million commercial buildings and 6.4 million
individual businesses in the U.S. These datasets assist companies in pricing and evaluating personal,
commercial property, and commercial liability insurance policies. This data is maintained by over 600 field
representatives located throughout the U.S. who visit over 300k commercial properties a year to collect
information on new buildings in the U.S. VRSK also provides peril-specific information to insurers based in
individual communities (i.e., a community’s firefighting capabilities). The key differentiator is VRSK’s
multiple peril datasets, such as crime, windstorm, earthquake, wildfire, and flood risk. These data sets allow
the company to be on both sides of an insurable event: 1) before the event, underwriting, and 2) after
the event for cost estimation. Insurers and commercial real estate lenders use the information to price
polices and analyze risk concentration in particular areas. This segment is 70% transaction driven (i.e., per-
click) and 30% subscription driven. Brokers use VRSK’s dataset to vet the risk of underwriting an insurance
policy on a specific commercial building or a residential property in a specific community. VRSK has more
than an 85% market share in this segment, with the rest of the space handled by more regional niche
players or P&C insurer’s internal systems.
VERISK ANALYTICS, INC. P&C RELATED MARKET SHARE & COMPETITORS
Product/Services Competitors Verisk's Share* Revenue Model
Industry Standard Programs (ISO) Internal Very High (>50%) Subscription
Specific Property Information Internal >85% Subscription/Transaction
Claim Fraud Detection Internal ~ 93% Subscription
Property Rebuild & Damage Claims Estimating Marshall & Swift/Boeckh ~ 80% on Claims** Subscription/Transaction
# 2 on underwriting
Catastrophe Modeling RMS, EQECAT #1 In Personal Lines Subscription
#2 In Commercial Lines
Propery & Auto Claims Data REED ELSEVIER <10% Subscription/Transaction
Sources: Analyst Day Presentations, 2011, 2012, 2013
Phone conversation with VRSK's CFO, Eva Huston on August 25, 2016
* Market share refers to merchant market
** It was ~75% in 2011
5
The chart to the left shows VRSK’s organic insurance
related revenue growth, relative to the US property
and casulty industry’s premium growth over a nine
year period. VRSK’s market position is best revealed
during the latest recession, when P&C industry
premium growth turned negative, while VRSK’s
organic revenue growth rate remained positive. More
importantly, organic revenue growth was not only
driven by price increases on old products, but a mix of
new products and services introductions and price
increases (the company does not disclose numeric
break down). Further, the actual VRSK’s insurance
related revenue organic growth rate was actually
higher than the one shown in the chart (based on
company’s past presentations and comments to
analysts, however, in order to provide consistent data on the chart, only traceble data was used). This
financial outcome is primarily the result of: 1) VRSK’s unique databases and resulting analytics solutions; 2)
which are embedded in customers’ workflows; and 3) provided at low cost relative to customers overall cost
base (~80 basis points to 1 percent of P&C insurers’ underwriting expenses
3
, which are generally dominated
by employee related costs and advertising expenses).
Sticky customer relationships underpinned by a diverse customer base, contractual-based revenues,
collaborative product development, and high switching costs resulting in utility like/stable cash flows and
sustainably strong pricing power
The graph to the left shows VRSK’s customer retention
rate over the past 12 years, which has been
consistently over 98%. Per Kevin Stuebe, the Moody’s
analyst covering VRSK, the 2% VRSK does not retain is
either a result of consolidation or the
company/customer simply going out of business. VRSK
does not typically lose customers to competition
vii
.
Additionally, Verisk has very little customer
concentration. The company’s largest customer
contributes only about 5% of total revenues, and the
top 10 customers 21% of total revenues. This prohibits
any one single customer to have buying power leverage
over VRSK.
In addition, the majority of revenues for VRSK are
derived from long-term contracts (3 to 5 year
durations), providing the company stable/predictable
cash flows. In fact, 82% of VRSK’s aggregate revenues
are subscription based. The third graph to the left
shows the cadence of relative subscription based
revenues by VRSK’s business segment. The key take
away from this graph is the increase of the subscription
based revenues in both segments over the past 5 years,
which has been one of the company’s strategic
objectives. Partly as a result of the subscription based
revenues the company generates stable/predictable
3
Assuming underwriting expenses are on average 25% of one dollar of industry’s premium
VRSK SUBSCRIPTION REVENUE RELATIVE CONTRIBUTION
Risk assesmentDecision
Source: Verisk Analytics, Inc. 10-K Filings For Fiscal Years 2012 through 2015
85.7% 87.1% 88.2% 89.6% 90.1%
57% 55%
64% 62%
67%
0.0%
10.0%
20.0%
30.0%
40.0%
50.0%
60.0%
70.0%
80.0%
90.0%
100.0%
2011 2012 2013 2014 2015
Risk Assesment DecisionAnalytics
VERISK ANALYTICS, INC. P&C CUSTOMER RETENTION RATES
Sources: Credit Suisse 2010 Inititation of Coverage for the years 2004 - 2009
2010 - 2015 Figures Based On Management's Comments At Annual Analyst Presentations
98.4% >98%
75%
80%
85%
90%
95%
100%
2004 2005 2006 2007 2008 2009 2010 2011 2012 2013 2014 2015
6
cash flows. In 2015, VRSK generated $458MM in free cash (operating minus capital expenditures); Bank of
America estimates this number to steadily grow to ~$615MM in 2018 (due to higher projected growth in
P&C industry premium volume and new products and services).
The high subscription revenue base combined with the exceptionally high retention rates and unique
datasets makes it difficult for competitors to enter VRSK’s markets. This also makes it costly for customers
to switch (or build internal capabilities).
Even if a customer has VRSK’s database resources (which are continually updated with competitors’
sensitive data), that customer would still have to employ highly skilled professionals. VRSK’s human capital
base (7,647 total full time employees) includes over 170 actuarial professionals, including 35 Fellows and 24
Associates of the Casualty Actuarial Society, as well as 139 Chartered Property Casualty Underwriters, 17
Certified and 15 Associate Insurance Data Managers, and 592 professionals with advanced degrees,
including: PhDs in mathematics and statistical modeling who review both the data and the models; over 107
specialized lawyers and insurance experts reviewing changes in each state’s insurance rules and regulations,
including on average over 16,000 legislative bills, 1,900 regulatory actions and 2,000 court cases per year, to
make any required changes to VRSK’s policy language and rating information products. Further, much of the
company’s technology is developed, maintained and supported by approximately 1,631 employees. A
customer such as American International Group, Inc. (AIG) wanting to build equivalent internal capabilities,
arguably, would have to significantly bolster its fixed costs. AIG’s selling, general, and administrative (SGA)
expenses in 2015 were over $12.6BN and reported net income of over $2.1BN
viii
, compared to VRSK’s
combined costs of revenues and (SG&A) expenses, which are dominated by salaries and wages of over
$1.1BN in 2015. Assuming that replication by a customer results in one third (a conservative estimate) of
VRSK’s total labor and wages costs (the customer would not need a sales force) or over $366MM, in the
case of AIG the after-tax impact on net income (assuming 2015 figures) would be over $248MM or a decline
of over 12%; a significant impact with no offsetting earnings potential (would a competitor want to buy and
submit competitively sensitive data to AIG?).
Furthermore, VRSK has been successful in
innovating and building on its strong incumbent
position. Its Decision Analytics segment is a direct
offshoot of its legacy database business. The
chart to left shows that segment’s organic
revenue growth on a sub-segment basis. The
company achieves this in three principle ways: 1)
raising prices; 2) cross selling; and 3) more
importantly creating new products and services
through collaborative customer relationships.
Often customers give feedback and ask to be
provided new solutions, or VRSK suggests new
solutions. If one company has a need for a
product, chances are high that other companies
are in need of that same (or a similar) offering.
History of successful complementary acquisitions, in line with VRSK’s high margin business model
Since January 1, 2003 VRSK has acquired approximately 44 businesses
ix
. A lot of those were self sourced
transactions
x
. VRSK has a 5 member team that continuously evaluates potential acquisition candidates. Of
note, the company has a list of 50 companies (a lot of them private and relatively small, and not on
investment bankers’ radars) which VRSK would like to add to the fold. The majority of those are not usually
for sale but VRSK actively researches them and in many cases has been in touch with the target’s
management team, developing relationships
xi
years before a transaction materializes.
VRSK DECISION ANALYTICS ORGANIC GROWTH ($MM)
Source: Verisk Analytics, Inc. 10-K Filings For Fiscal Years 2012 through 2015
$8.1%
11.1%
9.0%
9.2%
20.5%
19.3%
20.2%
(3.8)%
5.1%
(1.5)%) 0.3%
8.3%
$(10.0)
$-
$10.0
$20.0
$30.0
$40.0
$50.0
$60.0
$70.0
2015 2014 2013 2012
Insurance Financial Services Energy/Specialized Markets
7
VRSK’s acquisitions throughout the years have proven to be successful as judged by the lack of goodwill
impairment charges over the past 11 years and over $193MM of acquisition earn-out payments during the
same time frame; compared to $1.7BN of cash acquisitions over the past 11 years, excluding the Wood
Mackenzie transaction in 2015. One strategic objective (the healthcare sub-segment), underpinned by
acquisitions, was not meeting the company’s expectations and in 2016 VRSK exited the space. Of note, the
sale resulted in a gain of over $269MM; suggesting that management did not overpay for the acquisitions
making up that segment.
VRSK’s largest acquisition closed in 2015, when the company bought Wood Mackenzie (WM), a global
leader in data analytics and commercial intelligence for the energy, chemicals, metals and mining verticals
for $2.8BN. The company financed the acquisition through an equity offering with proceeds of $722MM,
bond offerings of $900MM, and borrowings of approximately $1.0BN using its revolver (the company used
the proceeds from the healthcare sub-segment sale, over $719MM, to pay down the revolver).
WM’s business model fits VRSK’s mold. WM has been a trusted partner to customers for over 40 years; it
has similar customer retention rates (over 98% in the past 5 years); it has a subscription-based revenue
model (over 80% of the company’s revenue is subscription based); and it has been successful at diversifying
(top 10 clients accounted for ~30% and ~21% total revenues in 2009 and 2015, respectively) and adding
(590 and 900 customers in 2009 and 2015, respectively) to its customer base
xii
.
Given the poor performance of oil and gas over
the past two years, the company has performed
well (see chart to the left). Revenues in this
year’s second quarter for WM were flat on a
constant currency basis. A couple of the main
reasons for WM’s favorable revenue
performance are: 1) the importance of WM’s
product and services to customers; 2) the
relative cheapness of those to the overall cost
structures of its customers; and 3) the mix of
customers, 90% of which are integrated (see
green CAPEX line above) as opposed upstream/independent oil and gas companies (see blue CAPEX line
above)
xiii
. Further, this acquisition has already resulted in unique synergies, strengthening both VRSK’s
insurance related product offerings and the energy related product offerings; this is exemplified by the
recent launch of a new energy insurance unit — drawing on proprietary data from both units— focused on
risk assessment, rating, and risk modeling for the oil and gas, petrochemicals, power generation, and metals
and mining industries
xiv
.
Lastly, another way to observe if acquisitions are working out (and are similar high margin businesses) is to
compare aggregate revenue growth versus aggregate operating income growth; over the past 5 years
revenues and operating income have compounded at over 14% and 12%, respectively. Revenue growth has
outpaced operating income growth due to: 1) the lower margin healthcare business, which the company
sold in 2016; 2) and partly as a result of acquisitions related expenses. Overall, the close compounded
growth rates, on an unadjusted basis, have developed favorably.
UPSTREAM OIL CAPITAL EXPENDITURES & WOODMAC REVENUE GROWTH
Source: Bank of America Merill Lynch, Equity Report, August 3, 2016
8
Primary risks and mitigants include:
1) Reputational risks, including abusing its strong market position with customers (price gouging).
a) Mitigants: History of good client relationships, partly shown by VRSK’s strong customer retention
rates over the years. Commitment to introducing new products and services, many of which are
spurred by VRSK’s collaborative relationship with its customers, which seek out VRSK’s expertise in
solving problems. History of restraint (conservative price increases) and commitment by current
management to continue this practice; as confirmed by Eva Huston, VRSK’s CFO, on a phone
conversation on August 25, 2016.
2) Cyber security risk. Verisk has a large and diverse set of databases which are vital to the daily
workflows of their customers. Security breaches in their facilities, computer networks, and databases
could cause harm to their business and reputation, and could result in a loss of customers. Additionally,
the company runs the risk of computer viruses or attacks by hackers.
a) Mitigants: VRSK has 2 back up data centers located on opposite coasts of the country (New Jersey
and Utah). Verisk essentially holds zero personal information in their datasets. The data they
receive is de-personalized. This drastically limits the incentive for someone to hack the company.
Verisk has adopted a wide range of measures to ensure the security of their IT infrastructure and
data. Security measures generally cover the following key areas: physical security; logical security
of the perimeter; network security such as firewalls; logical access to the operating systems;
deployment of virus detection software; and appropriate policies and procedures relating to
removable media such as laptops. All laptops are encrypted and media leaving VRSK’s premises
that is sent to a third-party storage facility is also encrypted. This commitment has led VRSK to
achieve certification from CyberTrust (an industry leader in information security certification)
since 2002.
3) Financial risk due to high leverage through acquisitions and stock buybacks. VRSK tends to finance its
acquisitions through its revolver, which is considered a “non-investment grade” activity by rating
agencies (Moody’s).
a) Mitigants: After discussing VRSK’s Baa3 rating with Kevin Stuebe, the Moody’s analyst covering
the company, he agreed that the company “deserves an upgrade”; according to Moody’s own
ratings methodology, VRSK’s grid indicated rating maps to Baa2. The two rating grid specific
factors viewed conservatively by the Moody’s analyst are: 1) VRSK’s use of its revolver for
acquisitions; and 2) VRSK scale/revenue base; both of those represent 30% of total rating factors
weight.
i) VRSK aggressively uses its revolver to fund acquisitions due to its quick transaction time, as
opposed to going out into the market to issue debt (lengthy process). VRSK also uses this
strategy to avoid keeping too much idle cash on the balance sheet. This way, VRSK can return
cash to shareholders through share repurchases and still have the capability of acquiring a
company. VRSK has set a Debt/EBITDA target of 2.5x for the end of this fiscal year (and as a
long term objective; the company is limited to 3.75x by its bank facilities). The company’s
commitment to that objective has most recently has been observed during and after the WM
acquisition; when VRSK sold off its healthcare division, used the proceeds to pay down the
revolver and curtailed stock buy backs.
ii) The assigned revenue factor score misses VRSK’s high quality revenue (in terms of stability).
4) Potential to lose access to data from external sources. Verisk is extremely dependent on external
sources for its data collection. These data sources include data received from customers and various
government and public record services. VRSK does not generally own this data, and because they
essentially pay next to nothing for the data, they could be cut off.
a) Mitigants: If a company/customer stopped providing data to Verisk, that customer would lose the
essential services VRSK provides them, which are based on industry data, supplied by competitors
to that customer. Further, VRSK’s services are embedded into its customers’ daily workflows, and
are a necessary component of their business. In addition, VRSK provides good customer as
9
indicated by its stable retention rates (consistently over 98% over the past decade), complemented
by the customer satisfaction tracking (net promoter scoring system), which reported at the Board
level and results in improvement action plans (per VRSK’s CFO, the company does not publicly
disclose those scores)
xv
. Further, customers lack the internal capabilities VRSK has developed over
decades and no single customer accounts for over 5% of revenues.
5) Competition.
a) Mitigants:
i) VRSK strong incumbent proprietary database driven business model
ii) VRSK’s proactive acquisition strategy, which entails keeping a close eye on emerging/potential
and established competitors
iii) Collaborative customer relationships, increasing customer satisfaction
iv) The company’s proactive organic growth strategy, which entails broadening its targeted
market opportunity, underpinned by a 20% target market share framework. This is driven by
the company’s strategy of applying its current products and services to new markets and
customers.
Benchmarks
VRSK will be monitored for achieving the following management-stated benchmarks:
 Normalized debt to EBITDA of 2.5x
VRSK will be monitored for achieving the following analyst-stated benchmarks:
 Continuation of current proactive acquisition policy
 Continued high customer retention>90%
 Continued emphasis on introducing new products and solutions (tracked through how revenues
grow; price increases versus new product offerings)
 Consistent EBITDA margins >40%
Harrison Hessel
Credit Risk Analyst Intern
September 26, 2016
10
VERISK ANALYTICS, INC. SELECT FINANCIAL RATIOS
2011 2012 2013 2014 2015
LTM
12 months
Jun-30-2016
Profitability
Return on Assets % 21.7% 18.4% 15.8% 17.2% 12.0% 9.5%
Return on Capital % 34.5% 26.3% 21.7% 24.0% 15.4% 12.1%
Return on Equity % NM 404.2% 85.2% 97.8% 64.1% 34.8%
Margin Analysis
Gross Margin % 63.0% 63.3% 61.0% 59.2% 61.2% 61.4%
SG&A Margin % 16.7% 15.5% 14.3% 13.0% 13.8% 14.5%
EBITDA Margin % 46.1% 47.5% 46.1% 45.2% 45.7% 45.3%
EBIT Margin % 40.2% 40.8% 38.5% 38.1% 37.0% 35.7%
Short Term Liquidity
Current Ratio 1.3x 0.7x 1.1x 0.5x 0.4x 0.8x
Quick Ratio 1.1x 0.5x 0.9x 0.4x 0.3x 0.7x
Cash from Ops. to Curr. Liab. 1.1x 0.8x 1.2x 0.6x 0.4x 1.1x
Long Term Solvency
Total Debt/Equity NM 571.8% 233.0% 680.9% 230.9% 156.9%
Total Debt/Capital 109.8% 85.1% 70.0% 87.2% 69.8% 61.1%
LT Debt/Equity NM 495.4% 232.2% 521.6% 167.1% 156.8%
LT Debt/Capital 109.2% 73.7% 69.7% 66.8% 50.5% 61.0%
Total Liabilities/Total Assets 106.4% 89.2% 78.1% 91.0% 75.6% 69.3%
EBIT / Interest Exp. 8.9x 7.9x 8.1x 9.5x 6.3x 6.2x
EBITDA / Interest Exp. 10.2x 9.2x 9.7x 11.3x 7.8x 7.9x
(EBITDA-CAPEX) / Interest Exp. 9.1x 8.2x 7.8x 9.2x 6.4x 6.6x
Total Debt/EBITDA 2.0x 2.2x 1.7x 1.8x 3.4x 2.2x
Net Debt/EBITDA 1.7x 2.0x 1.5x 1.8x 3.2x 2.0x
Total Debt/(EBITDA-CAPEX) 2.3x 2.5x 2.2x 2.2x 4.1x 2.7x
Net Debt/(EBITDA-CAPEX) 1.9x 2.3x 1.9x 2.2x 3.9x 2.4x
Source: S&P Capital IQ
11
VERISK ANALYTICS, INC. INCOME STATEMENT
2011 2012 2013 2014 2015
LTM
12 months
Jun-30-2016
Revenue 1,191.4 1,407.8 1,595.7 1,746.7 2,068.0 2,246.1
Cost Of Goods Sold 441.0 516.7 622.5 711.8 803.3 866.6
Gross Profit 750.4 891.1 973.2 1,034.9 1,264.7 1,379.5
Selling General & Admin Exp. 198.5 218.2 229.0 227.0 285.1 326.2
Depreciation & Amort. 40.1 46.6 66.2 85.5 120.6 139.8
Amort. of Goodwill and Intangibles 33.0 52.2 63.7 56.9 94.9 112.2
Other Operating Exp., Total 271.6 317.0 358.9 369.3 500.5 578.2
Operating Income 478.8 574.1 614.3 665.6 764.2 801.3
Interest Expense (53.8) (72.5) (76.1) (70.0) (121.3) (128.9)
Interest and Invest. Income 0.2 0.4 0.7 - 1.6 2.2
Net Interest Exp. (53.7) (72.1) (75.4) (70.0) (119.7) (126.6)
EBT Excl. Unusual Items 425.1 502.0 538.8 595.6 644.5 674.7
Merger & Related Restruct. Charges (1.0) (1.9) - (0.3) 57.6 (1.0)
Impairment of Goodwill - - - - - -
Gain (Loss) On Sale Of Invest. 0.7 (0.3) (0.1) 0.2 15.4 16.4
Other Unusual Items 3.4 - - (4.8) - -
EBT Incl. Unusual Items 428.2 499.8 538.7 590.6 717.4 690.1
Income Tax Expense 165.7 182.4 196.4 219.8 209.9 221.3
Earnings from Continuing Operations 262.5 317.5 342.3 370.9 507.6 468.8
Earnings of Discontinued Ops. 20.3 11.7 6.1 29.2 - 131.2
Extraord. Item & Account. Change - - - - - -
Net Income to Company 282.8 329.1 348.4 400.0 507.6 599.9
Supplemental Items
EBITDA 549.5 669.4 736.0 790.1 944.8 1,018.5
EBITA 513.6 627.7 678.6 722.6 859.1 913.5
Source: S&P Capital IQ
12
VERISK ANALYTICS, INC. STATEMENT OF CASH FLOWS
2011 2012 2013 2014 2015
LTM
12 months
Jun-30-2016
Net Income 282.8 329.1 348.4 400.0 507.6 599.9
Depreciation & Amort. 35.9 41.7 57.5 67.5 85.8 105.0
Amort. of Goodwill and Intangibles 34.8 53.6 64.3 57.0 94.9 112.2
Depreciation & Amort., Total 70.7 95.3 121.8 124.5 180.6 217.2
Other Amortization 9.6 11.3 15.5 21.6 47.7 39.6
(Gain) Loss From Sale Of Assets 0.9 0.6 0.6 1.0 0.4 1.2
(Gain) Loss On Sale Of Invest. (0.7) 0.3 0.1 (0.3) 0.2 0.5
Stock-Based Compensation 35.9 37.8 36.0 35.6 44.6 42.3
Tax Benefit from Stock Options (53.2) (60.7) (109.9) (22.6) (40.1) (38.3)
Provision & Write-off of Bad debts 1.3 1.1 2.5 1.8 1.3 2.2
Net Cash From Discontinued Ops. - - - (65.4) - (280.0)
Other Operating Activities 18.1 63.5 44.6 24.5 (104.3) (5.6)
Working Capital 10.5 (10.0) 47.4 (31.5) (14.2) 67.8
Cash from Ops. 375.7 468.2 506.9 489.5 623.7 646.7
Capital Expenditure (59.8) (74.4) (146.0) (146.8) (166.1) (168.3)
Cash Acquisitions (125.2) (769.8) (1.0) (35.2) (2,858.2) (52.7)
Divestitures - - - 151.2 - -
Invest. in Marketable & Equity Securt. 0.2 (2.1) 1.6 (4.7) 0.1 0.3
Net (Inc.) Dec. in Loans Originated/Sold - - - - - -
Other Investing Activities (19.3) (37.3) (0.3) - 2.3 714.6
Cash from Investing (204.1) (883.6) (145.6) (35.5) (3,021.9) 493.9
Short Term Debt Issued 130.0 357.2 - 160.0 830.0 -
Long-Term Debt Issued 696.6 347.2 - - 1,244.0 -
Total Debt Issued 826.6 704.4 - 160.0 2,074.0 (30.0)
Short Term Debt Repaid (440.0) (347.2) (10.0) - (120.0) -
Long-Term Debt Repaid (125.0) - (180.0) - (220.0) -
Total Debt Repaid (565.0) (347.2) (190.0) - (340.0) (990.0)
Issuance of Common Stock 43.3 68.4 80.4 24.6 775.3 52.7
Repurchase of Common Stock (381.8) (162.3) (277.4) (778.5) (20.5) (136.8)
Total Dividends Paid - - - - - -
Other Financing Activities 42.1 50.2 102.6 14.8 7.8 27.5
Cash from Financing (34.8) 313.6 (284.5) (579.1) 2,496.6 (1,076.7)
Foreign Exchange Rate Adj. (0.2) 0.0 (0.8) (1.3) 0.6 (13.0)
Net Change in Cash 136.6 (101.8) 76.0 (126.4) 99.0 50.9
Supplemental Items
Cash Interest Paid 48.2 61.0 75.1 67.2 106.1 131.0
Cash Taxes Paid 117.7 47.5 126.8 205.5 158.5 220.2
Levered Free Cash Flow 305.6 390.6 391.0 379.5 556.6 643.3
Unlevered Free Cash Flow 337.6 433.6 435.9 420.6 619.5 719.1
Change in Net Working Capital 16.2 (7.1) (27.4) 27.7 (47.9) (92.3)
Net Debt Issued 261.6 357.2 (190.0) 160.0 1,734.0 (1,020.0)
Net Cash From Discontinued Ops. - Investing - - - - - 719.374
Source: S&P Capital IQ
13
VERISK ANALYTICS, INC. BALANCE SHEET
Balance Sheet
2011 2012 2013 2014 2015
LTM
12 months
Jun-30-2016
Currency
ASSETS
Cash And Equivalents 191.6 89.8 165.8 39.4 138.3 196.4
Short Term Investments 5.1 4.9 3.9 3.8 3.6 3.4
Total Cash & ST Investments 196.7 94.7 169.7 43.2 141.9 199.8
Accounts Receivable 153.3 178.4 158.5 220.7 320.1 241.3
Other Receivables 36.7 46.0 67.3 65.5 48.9 5.7
Total Receivables 190.0 224.4 225.9 286.2 369.0 247.1
Prepaid Exp. 21.9 21.9 25.7 31.5 40.7 30.9
Deferred Tax Assets, Curr. 3.8 10.4 5.1 4.8 - -
Other Current Assets 41.2 39.1 48.5 18.9 53.0 19.2
Total Current Assets 453.7 390.6 474.8 384.5 604.6 496.9
Gross Property, Plant & Equipment 175.8 198.6 252.3 297.2 354.8 -
Accumulated Depreciation (115.4) (131.6) (151.8) (185.0) (226.3) -
Net Property, Plant & Equipment 60.4 67.0 100.5 112.2 128.6 334.6
Long-term Investments 3.4 5.0 3.6 8.5 8.5 16.9
Goodwill 709.9 1,247.5 1,181.7 1,207.1 3,134.8 2,629.9
Other Intangibles 285.4 608.0 580.5 596.6 1,666.4 1,104.3
Deferred Tax Assets, LT 10.5 - - - - -
Other Long-Term Assets 17.8 42.3 163.3 36.5 73.1 142.4
Total Assets 1,541.1 2,360.3 2,504.5 2,345.3 5,615.9 4,725.1
LIABILITIES
Accounts Payable 65.7 79.7 81.0 87.4 105.8 163.4
Accrued Exp. 70.4 80.7 81.8 89.6 103.1 1.8
Short-term Borrowings - 10.0 - 160.0 870.0 -
Curr. Port. of LT Debt - 180.0 - 170.0 - -
Curr. Port. of Cap. Leases 5.6 5.3 4.4 6.1 4.8 2.3
Curr. Income Taxes Payable - - - - - 16.5
Unearned Revenue, Current 176.8 200.7 226.6 252.6 357.0 431.2
Other Current Liabilities 31.1 29.0 37.4 5.6 38.6 -
Total Current Liabilities 349.7 585.4 431.2 771.3 1,479.3 615.2
Long-Term Debt 1,096.7 1,264.4 1,265.1 1,095.8 2,290.9 2,271.1
Capital Leases 3.7 1.8 6.3 5.0 2.3 2.0
Pension & Other Post-Retire. Benefits 127.7 41.3 15.1 16.2 15.0 14.6
Def. Tax Liability, Non-Curr. - 133.8 198.6 202.5 396.4 314.7
Other Non-Current Liabilities 61.9 78.2 40.6 43.4 60.1 57.7
Total Liabilities 1,639.6 2,104.7 1,956.9 2,134.3 4,243.9 3,275.2
Common Stock 0.1 0.1 0.1 0.1 0.1 0.1
Additional Paid In Capital 874.8 1,044.7 1,202.1 1,171.2 2,023.4 2,071.5
Retained Earnings 576.6 905.7 1,254.1 1,654.1 2,161.7 2,516.1
Treasury Stock (1,471.0) (1,605.4) (1,865.0) (2,533.8) (2,571.2) (2,680.7)
Comprehensive Inc. and Other (79.0) (89.6) (43.8) (80.7) (242.1) (457.1)
Total Common Equity (98.5) 255.6 547.6 211.0 1,372.0 1,449.9
Total Equity (98.5) 255.6 547.6 211.0 1,372.0 1,449.9
Total Liabilities And Equity 1,541.1 2,360.3 2,504.5 2,345.3 5,615.9 4,725.1
Supplemental Items
Total Shares Out. on Filing Date 164.8 168.1 166.8 157.9 168.0 169.0
Total Shares Out. on Balance Sheet Date 164.3 167.7 167.5 157.9 169.4 168.7
Book Value/Share ($0.6) $1.52 $3.27 $1.34 $8.1 $8.59
Total Debt 1,105.9 1,461.4 1,275.9 1,436.9 3,168.0 2,275.3
Net Debt 909.2 1,366.7 1,106.2 1,393.8 3,026.1 2,075.5
Source: S&P Capital IQ
14
References:
i
Moody’s Versiks Analytics rating methodology, December 8, 2014
ii
Based on telephone conversation with Eva Huston, Verisk Analytics Inc Chief Financial Officer, August 25,
2016
iii
Based on telephone conversation with Eva Huston, Verisk Analytics Inc Chief Financial Officer, August 25,
2016
iv
Andreessen Horowitz: http://a16z.com/2016/03/07/all-about-network-effects/
v
Interactive Data Corporation, press release, November 24, 2015:
https://www.idc.com/getdoc.jsp?containerId=prUS40635515
vi
Accounting good will figures on pages 2 and 3 are based on S&P Capital IQ and Bloomberg data
vii
Based on telephone conversation with Kevin Stuebe from Moody’s on August 23, 2016
viii
American International Group, Inc 2015 10-K
ix
August 12, 2008 S-1 (IPO) filing and 10-K filings 2010 through 2016
x
Credit Suisse: Initiating Coverage With An Outperform Rating by Kelly Flynn, CFA and Norman Young,
December 02, 2010
xi
Based on telephone conversation with Eva Huston, Verisk Analytics Inc Chief Financial Officer, August 25,
2016
xii
2015 Verisk Analytics, Inc. investor day presentation, pages 66 and 67
xiii
Bank of America Merill Lynch: Lowering Forecasts on Margins, But No Change To Verisk’s Top-Line
Outlook, Sara Gubins, Faton Begolli, and David Chu, August 3, 2016
xiv
Versik Analytics Inc. press release, September 19, 2016
xv
Eva Huston August 24, 2016

Mais conteúdo relacionado

Mais procurados

PwC Insurance -Stress-testing
PwC Insurance -Stress-testingPwC Insurance -Stress-testing
PwC Insurance -Stress-testingPwC
 
2017 Top Issues - DOL Fiduciary Rule - January 2017
2017 Top Issues - DOL Fiduciary Rule - January 20172017 Top Issues - DOL Fiduciary Rule - January 2017
2017 Top Issues - DOL Fiduciary Rule - January 2017PwC
 
Building public-trust-eccles-en-2038
Building public-trust-eccles-en-2038Building public-trust-eccles-en-2038
Building public-trust-eccles-en-2038Girma Biresaw
 
ACCT301a_project
ACCT301a_projectACCT301a_project
ACCT301a_projectYung Le
 
FHA Ruling Claim Change
FHA Ruling Claim Change FHA Ruling Claim Change
FHA Ruling Claim Change PwC
 
2014 Property & Casualty Insurance Industry Outlook: Innovation leading the way
2014 Property & Casualty Insurance Industry Outlook: Innovation leading the way2014 Property & Casualty Insurance Industry Outlook: Innovation leading the way
2014 Property & Casualty Insurance Industry Outlook: Innovation leading the wayDeloitte United States
 
Keys to avoid working capital adjustment pitfalls
Keys to avoid working capital adjustment pitfalls Keys to avoid working capital adjustment pitfalls
Keys to avoid working capital adjustment pitfalls Grant Thornton LLP
 
Retail Banking Growth Challenges and Creative Solutions
Retail Banking Growth Challenges and Creative SolutionsRetail Banking Growth Challenges and Creative Solutions
Retail Banking Growth Challenges and Creative SolutionsBoston Consulting Group
 
TIP on Tax: New rules may ease burden for small shareholders in tech acquisit...
TIP on Tax: New rules may ease burden for small shareholders in tech acquisit...TIP on Tax: New rules may ease burden for small shareholders in tech acquisit...
TIP on Tax: New rules may ease burden for small shareholders in tech acquisit...Grant Thornton LLP
 
How Should Financial Institutions Navigate the COVID-19 Crisis?
How Should Financial Institutions Navigate the COVID-19 Crisis?How Should Financial Institutions Navigate the COVID-19 Crisis?
How Should Financial Institutions Navigate the COVID-19 Crisis?Boston Consulting Group
 
MCCO Regulation: Trends and Challenges
MCCO Regulation: Trends and ChallengesMCCO Regulation: Trends and Challenges
MCCO Regulation: Trends and ChallengesICMIF Microinsurance
 
Chapter 5 consumer lending
Chapter 5   consumer lendingChapter 5   consumer lending
Chapter 5 consumer lendingQuan Risk
 
Long arm of the law
Long arm of the lawLong arm of the law
Long arm of the lawnrodelli
 
International Accounting:Reporting and Disclosure
International Accounting:Reporting and DisclosureInternational Accounting:Reporting and Disclosure
International Accounting:Reporting and DisclosureHelpWithAssignment.com
 
Buy-Side System Requirements
Buy-Side System RequirementsBuy-Side System Requirements
Buy-Side System RequirementsQuantifi
 

Mais procurados (20)

PwC Insurance -Stress-testing
PwC Insurance -Stress-testingPwC Insurance -Stress-testing
PwC Insurance -Stress-testing
 
2017 Top Issues - DOL Fiduciary Rule - January 2017
2017 Top Issues - DOL Fiduciary Rule - January 20172017 Top Issues - DOL Fiduciary Rule - January 2017
2017 Top Issues - DOL Fiduciary Rule - January 2017
 
Building public-trust-eccles-en-2038
Building public-trust-eccles-en-2038Building public-trust-eccles-en-2038
Building public-trust-eccles-en-2038
 
ACCT301a_project
ACCT301a_projectACCT301a_project
ACCT301a_project
 
FHA Ruling Claim Change
FHA Ruling Claim Change FHA Ruling Claim Change
FHA Ruling Claim Change
 
2014 Property & Casualty Insurance Industry Outlook: Innovation leading the way
2014 Property & Casualty Insurance Industry Outlook: Innovation leading the way2014 Property & Casualty Insurance Industry Outlook: Innovation leading the way
2014 Property & Casualty Insurance Industry Outlook: Innovation leading the way
 
Keys to avoid working capital adjustment pitfalls
Keys to avoid working capital adjustment pitfalls Keys to avoid working capital adjustment pitfalls
Keys to avoid working capital adjustment pitfalls
 
Retail Banking Growth Challenges and Creative Solutions
Retail Banking Growth Challenges and Creative SolutionsRetail Banking Growth Challenges and Creative Solutions
Retail Banking Growth Challenges and Creative Solutions
 
TIP on Tax: New rules may ease burden for small shareholders in tech acquisit...
TIP on Tax: New rules may ease burden for small shareholders in tech acquisit...TIP on Tax: New rules may ease burden for small shareholders in tech acquisit...
TIP on Tax: New rules may ease burden for small shareholders in tech acquisit...
 
Balance sheet items
Balance sheet itemsBalance sheet items
Balance sheet items
 
Ssrn id1534186
Ssrn id1534186Ssrn id1534186
Ssrn id1534186
 
DeFi Technologies Deck - September 2021
DeFi Technologies Deck - September 2021DeFi Technologies Deck - September 2021
DeFi Technologies Deck - September 2021
 
653770
653770653770
653770
 
How Should Financial Institutions Navigate the COVID-19 Crisis?
How Should Financial Institutions Navigate the COVID-19 Crisis?How Should Financial Institutions Navigate the COVID-19 Crisis?
How Should Financial Institutions Navigate the COVID-19 Crisis?
 
MCCO Regulation: Trends and Challenges
MCCO Regulation: Trends and ChallengesMCCO Regulation: Trends and Challenges
MCCO Regulation: Trends and Challenges
 
Chapter 5 consumer lending
Chapter 5   consumer lendingChapter 5   consumer lending
Chapter 5 consumer lending
 
Long arm of the law
Long arm of the lawLong arm of the law
Long arm of the law
 
International Accounting:Reporting and Disclosure
International Accounting:Reporting and DisclosureInternational Accounting:Reporting and Disclosure
International Accounting:Reporting and Disclosure
 
forging-consensus-tlac (1)
forging-consensus-tlac (1)forging-consensus-tlac (1)
forging-consensus-tlac (1)
 
Buy-Side System Requirements
Buy-Side System RequirementsBuy-Side System Requirements
Buy-Side System Requirements
 

Semelhante a Purchase Recommendation Versik Analytics Inc - 09-23-16

How P&C Insurers Can Unlock Value from Mergers & Acquisitions
How P&C Insurers Can Unlock Value from Mergers & AcquisitionsHow P&C Insurers Can Unlock Value from Mergers & Acquisitions
How P&C Insurers Can Unlock Value from Mergers & AcquisitionsCognizant
 
Arc Sight Info Documents 7 2009
Arc Sight Info Documents 7 2009Arc Sight Info Documents 7 2009
Arc Sight Info Documents 7 2009mattdriscoll
 
Brookside energy ltd
Brookside energy ltdBrookside energy ltd
Brookside energy ltdGagan Dharwal
 
Analytics in Insurance Value Chain
Analytics in Insurance Value ChainAnalytics in Insurance Value Chain
Analytics in Insurance Value ChainNIIT Technologies
 
CBIZ Quarterly Manufacturing & Distribution “Hot Topics” Newsletter (Sep-Oct ...
CBIZ Quarterly Manufacturing & Distribution “Hot Topics” Newsletter (Sep-Oct ...CBIZ Quarterly Manufacturing & Distribution “Hot Topics” Newsletter (Sep-Oct ...
CBIZ Quarterly Manufacturing & Distribution “Hot Topics” Newsletter (Sep-Oct ...CBIZ, Inc.
 
Understand the Value of Your InsurTech Company
Understand the Value of Your InsurTech CompanyUnderstand the Value of Your InsurTech Company
Understand the Value of Your InsurTech CompanyMercer Capital
 
Managing Big Data: A Big Problem for Brokerages
Managing Big Data: A Big Problem for BrokeragesManaging Big Data: A Big Problem for Brokerages
Managing Big Data: A Big Problem for BrokeragesBroadridge
 
Symantec Corporate Presentation May 31, 2013
Symantec Corporate Presentation May 31, 2013Symantec Corporate Presentation May 31, 2013
Symantec Corporate Presentation May 31, 2013InvestorSymantec
 
Research the following area pertaining to File Systems· How vir.docx
Research the following area pertaining to File Systems· How vir.docxResearch the following area pertaining to File Systems· How vir.docx
Research the following area pertaining to File Systems· How vir.docxgholly1
 
200806 inn quoted_ingeneration
200806 inn quoted_ingeneration200806 inn quoted_ingeneration
200806 inn quoted_ingenerationSteven Callahan
 
ExampleEmerging Trends in Global MarketsIN
ExampleEmerging Trends in Global MarketsINExampleEmerging Trends in Global MarketsIN
ExampleEmerging Trends in Global MarketsINBetseyCalderon89
 
Why should I do SOC2?
Why should I do SOC2?Why should I do SOC2?
Why should I do SOC2?VISTA InfoSec
 
Symantec Corporate Presentation
Symantec Corporate PresentationSymantec Corporate Presentation
Symantec Corporate PresentationInvestorSymantec
 
Insurance Industry 2016: PwC Top Issues
Insurance Industry 2016: PwC Top Issues Insurance Industry 2016: PwC Top Issues
Insurance Industry 2016: PwC Top Issues PwC
 
The GIC Investment Ideas: SMAC vs. FANG
The GIC Investment Ideas: SMAC vs. FANGThe GIC Investment Ideas: SMAC vs. FANG
The GIC Investment Ideas: SMAC vs. FANGMarqus J Freeman
 
Chart bookslides 20151229_142542_155_marqus.freeman
Chart bookslides 20151229_142542_155_marqus.freemanChart bookslides 20151229_142542_155_marqus.freeman
Chart bookslides 20151229_142542_155_marqus.freemanMarqus J Freeman
 
Focus group industry challenges for prospective sellers (Repaired)
Focus group industry challenges for prospective sellers (Repaired)Focus group industry challenges for prospective sellers (Repaired)
Focus group industry challenges for prospective sellers (Repaired)Brett Watkins
 
Mercer Capital's Investment Management Industry Newsletter | Q2 2022 | Segmen...
Mercer Capital's Investment Management Industry Newsletter | Q2 2022 | Segmen...Mercer Capital's Investment Management Industry Newsletter | Q2 2022 | Segmen...
Mercer Capital's Investment Management Industry Newsletter | Q2 2022 | Segmen...Mercer Capital
 
Using an Integrated Approach to Guide Your Insurance Services Transformation
Using an Integrated Approach to Guide Your Insurance Services TransformationUsing an Integrated Approach to Guide Your Insurance Services Transformation
Using an Integrated Approach to Guide Your Insurance Services TransformationTory Ragsdale, MS, MBA, PMP
 

Semelhante a Purchase Recommendation Versik Analytics Inc - 09-23-16 (20)

How P&C Insurers Can Unlock Value from Mergers & Acquisitions
How P&C Insurers Can Unlock Value from Mergers & AcquisitionsHow P&C Insurers Can Unlock Value from Mergers & Acquisitions
How P&C Insurers Can Unlock Value from Mergers & Acquisitions
 
Arc Sight Info Documents 7 2009
Arc Sight Info Documents 7 2009Arc Sight Info Documents 7 2009
Arc Sight Info Documents 7 2009
 
Brookside energy ltd
Brookside energy ltdBrookside energy ltd
Brookside energy ltd
 
Analytics in Insurance Value Chain
Analytics in Insurance Value ChainAnalytics in Insurance Value Chain
Analytics in Insurance Value Chain
 
CBIZ Quarterly Manufacturing & Distribution “Hot Topics” Newsletter (Sep-Oct ...
CBIZ Quarterly Manufacturing & Distribution “Hot Topics” Newsletter (Sep-Oct ...CBIZ Quarterly Manufacturing & Distribution “Hot Topics” Newsletter (Sep-Oct ...
CBIZ Quarterly Manufacturing & Distribution “Hot Topics” Newsletter (Sep-Oct ...
 
Understand the Value of Your InsurTech Company
Understand the Value of Your InsurTech CompanyUnderstand the Value of Your InsurTech Company
Understand the Value of Your InsurTech Company
 
Managing Big Data: A Big Problem for Brokerages
Managing Big Data: A Big Problem for BrokeragesManaging Big Data: A Big Problem for Brokerages
Managing Big Data: A Big Problem for Brokerages
 
Symantec Corporate Presentation May 31, 2013
Symantec Corporate Presentation May 31, 2013Symantec Corporate Presentation May 31, 2013
Symantec Corporate Presentation May 31, 2013
 
Research the following area pertaining to File Systems· How vir.docx
Research the following area pertaining to File Systems· How vir.docxResearch the following area pertaining to File Systems· How vir.docx
Research the following area pertaining to File Systems· How vir.docx
 
200806 inn quoted_ingeneration
200806 inn quoted_ingeneration200806 inn quoted_ingeneration
200806 inn quoted_ingeneration
 
ExampleEmerging Trends in Global MarketsIN
ExampleEmerging Trends in Global MarketsINExampleEmerging Trends in Global MarketsIN
ExampleEmerging Trends in Global MarketsIN
 
DSS Presentation Deck Dec 2021
DSS Presentation Deck  Dec 2021DSS Presentation Deck  Dec 2021
DSS Presentation Deck Dec 2021
 
Why should I do SOC2?
Why should I do SOC2?Why should I do SOC2?
Why should I do SOC2?
 
Symantec Corporate Presentation
Symantec Corporate PresentationSymantec Corporate Presentation
Symantec Corporate Presentation
 
Insurance Industry 2016: PwC Top Issues
Insurance Industry 2016: PwC Top Issues Insurance Industry 2016: PwC Top Issues
Insurance Industry 2016: PwC Top Issues
 
The GIC Investment Ideas: SMAC vs. FANG
The GIC Investment Ideas: SMAC vs. FANGThe GIC Investment Ideas: SMAC vs. FANG
The GIC Investment Ideas: SMAC vs. FANG
 
Chart bookslides 20151229_142542_155_marqus.freeman
Chart bookslides 20151229_142542_155_marqus.freemanChart bookslides 20151229_142542_155_marqus.freeman
Chart bookslides 20151229_142542_155_marqus.freeman
 
Focus group industry challenges for prospective sellers (Repaired)
Focus group industry challenges for prospective sellers (Repaired)Focus group industry challenges for prospective sellers (Repaired)
Focus group industry challenges for prospective sellers (Repaired)
 
Mercer Capital's Investment Management Industry Newsletter | Q2 2022 | Segmen...
Mercer Capital's Investment Management Industry Newsletter | Q2 2022 | Segmen...Mercer Capital's Investment Management Industry Newsletter | Q2 2022 | Segmen...
Mercer Capital's Investment Management Industry Newsletter | Q2 2022 | Segmen...
 
Using an Integrated Approach to Guide Your Insurance Services Transformation
Using an Integrated Approach to Guide Your Insurance Services TransformationUsing an Integrated Approach to Guide Your Insurance Services Transformation
Using an Integrated Approach to Guide Your Insurance Services Transformation
 

Purchase Recommendation Versik Analytics Inc - 09-23-16

  • 1. INVESTMENT MANAGEMENT Purchase Recommendation Verisk Analytics, Inc. September 26, 2016 Current Ratings: Moody's S&P Egan-Jones Fitch Internal NAIC Baa3 BBB- BBB BBB+ Baa2 2 Range ofinternal Rating: Baa3 to Baa1 Status: Current Holdings: No Recommendation Verisk Analytics (VRSK) operates in the broadly defined business and consumer services industry i , primarily providing data and decision support solutions that enable customers to better understand and manage risk. This industry consists of many sub-markets, which are generally dominated by a few (in many cases by 1 or 2) major players and many small ones offering point product solutions. This is primarily due to inherent barriers to entry in that industry, which include: 1) proprietary database sets, which are hard, in some cases virtually impossible, to replicate; 2) sticky customer relationships due to contractual-based revenues, limited vendor choice, and products and services which are embedded in customers’ work flows; 3) and as a result of 1 and 2, high switching costs. VRSK has established leading positions in sub-markets, primarily serving customers in the Insurance, Financial Services, and Energy industries. This position is the result of 1) its industry leading proprietary databases, which are constantly growing, making it harder for potential competitors to enter and customers to switch; 2) high customer retention, underpinned by a diverse customer base; 3) emphasis on improving its product offerings and services (in many cases in close collaboration with customers ii ); and 4) acquiring companies with complementary products and business models. Moody’s and S&P rate the company at a low triple B level due to the company’s history of acquisitions and shareholder friendly policy (stock buyback, no dividends, which provides more flexibility). The internal rating is a notch higher than Moody’s’ and S&P’s ratings due to the company’s strong defensible, competitive position, thus resulting in strong cash flow generation and exceptionally high EBITDA margins (approximately 45%), and management’s commitment and demonstrated ability to de-lever quickly following acquisitions and curtail stock buybacks when leverage spikes above the company’s target 2.5x (limited by its bank agreement to go up to up to 3.75x for 12 months following an acquisition iii ). Company Profile VRSK was founded in 1971 in Jersey City, New Jersey, under the name Insurance Services Office, Inc. (ISO 1 ) and went public in 2008. The impetus for the company’s formation was the need to centralize (underwriting) data gathering from the property and casualty insurance industry in order to help the industry fulfill regulatory reporting requirements and to help individual companies determine insurance premium pricing (vital functions determining insurance companies’ profitability). 1 Verisk was initially formed as a wholly-owned subsidiary of ISO. On October 6, 2009, in connection with the IPO, the Company
  • 2. 2 An important aspect of the database business model, and VRSK’s in particular, is the overlap between the suppliers and customers, in other words data suppliers are also customers of the resulting aggregated data and resulting solutions. This leads to the following self reinforcing dynamic: every time a new customer/data supplier joins, the overall utility/value of the database increases to each individual customer; consequently this tends to limit competition and in certain cases leads to winner take all situations; this dynamic is also known as network effects or demand-side economies of scale, defined as follows—when a product or a service becomes more valuable to its users as more people use it iv . Currently, the company has two reporting segments as follows: The company’s Risk Assessment segment (33%/48% of consolidated 2015 revenues/operating income) is its legacy business, and serves the property and casualty (P&C) insurance industry primarily in the U.S. Main services include: prediction of loss and selection, and pricing of risk. These solutions provide industry- standard insurance programs that help P&C insurers define coverage (policy language) and issue policies. The company also acts as a middleman by reporting premium and loss data from the insurers to the regulators (mandated by law; VRSK is a designated “statistical agent” in all 50 states, Puerto Rico and the District of Columbia). In addition to its industry-standard insurance program, the company also provides property-specific services for its clients to evaluate and price personal and commercial property insurance, as well as commercial liability insurance. Its customers utilize a proprietary database that contains loss costs on more than 3.6 million commercial buildings in the U.S. and holds information on more than 6.4 million individual businesses occupying those buildings. The company’s Decision Analytics segment (67%/52% of consolidated 2015 revenues/operating income) develops predictive models to help predict loss, price risk, and detect fraud before or after an event. The company built on its insurance background (the Risk Assessment segment), and ventured into complementary markets via acquisitions 2 . VRSK’s services include: fraud detection, catastrophe modeling, and building repair cost estimation (insurance clients); leading benchmarking tools, marketing and media effectiveness solutions, and fraud solutions (financial services clients); supply chain solutions, climate analytics, geopolitical risk analytics (specialized markets), and data analytics for the energy, chemicals and mining verticals (energy markets). Analysis Behind the Recommendation  VRSK has established leading positions in a growing industry with high-barriers to entry  Sticky customer relationships underpinned by a diverse customer base, contractual-based revenues, collaborative product development, and high switching costs resulting in stable cash flows and sustainably strong pricing power  History of successful complementary acquisitions, in line with VRSK’s high margin business model VRSK has established leading positions in a growing industry with high-barriers to entry Based on one’s definition, the business services industry could vary widely in terms of the companies comprising it, and consequently of the industry’s size. Interactive Data Corporation (IDC) estimated the industry at approximately $59BN in 2015 (up from over $40BN in 2011), projecting it to grow at an annual compounded growth rate of over 14% through 2019 to over $100BN v . IDC expects that this substantial growth will be developing as a result of: 1) adoption of new technologies in combination with 2) a lack of internal skill sets and data sets (such as overall industry wide technical or proprietary data). The industry is fragmented and comprised of established companies, many of which have been around for decades. VRSK does not have a direct competitor (on a product and services offering basis) but many point product/solutions competitors (most of them smaller companies; many of which are privately owned or in 2 The expansion into analytics began with the acquisitions of American Insurance Services Group and certain operations and assets of the National Insurance Crime Bureau in 1997 and 1998, respectively.
  • 3. 3 PEER GROUP CAPITAL ALLOCATION 10 YEAR AGGREGATE HISTORY FICO 400$ 226$ 295$ 830$ I.H.S. 943$ 549$ 4,039$ n.a. MSCI Inc 648$ 256$ 164$ 603$ Equafax Inc 1,695$ 955$ 2,347$ n.a. The Dun & Bradstreet Corporation* 238$ 104$ 988$ 334$ S&P Global, Inc 1,646$ 1,322$ 3,822$ n.a. FactSet Research Systems Inc 346$ 279$ 355$ n.a. Moody's Corporation * 762$ 817$ 964$ 156$ Corporate Executive Board Inc* 302$ 232$ 879$ n.a. Gartner Inc* 288$ 336$ 569$ 59$ Verisk Analytics Inc* 910$ 784$ 4,561$ 298$ Total 8,175$ 5,859$ 18,984$ 2,279$ Source: S&P Capital IQ, based on companies' 10-K filings Depreciation and Amortization Capital Expenditures Cash Acquisitions Research and Development Expenditures some cases non-profit entities, such as the National Independent Statistical Service). However, there are public companies which benefit from similar economic positions (proprietary databases, sticky customer relationships, market leadership, and barriers to entry). A couple of ways to observe/assess an industry’s barriers to entry and competitive dynamics quantitatively are: 1) to compare the industry’s return on equity to the one of business in general; and 2) to observe how participants achieve growth (internal development versus acquisition). The first table below shows returns on equity and in some cases returns on capital for publicly traded companies, which have similar economic models as VRSK’s. Return on capital was used in cases where companies have bought back most or all of its equity capital, leaving some participants in a negative or very low equity position. Highlighted in green is the key take away from this table, which shows the difference between the peer group’s average return on equity and that of the S&P 500 group of companies (figures are not adjusted for impairments and other items that could be considered transitory). Over the past decade, this difference or excess return on capital/economic goodwill has been consistently substantial, indicating barriers to entry and pricing power. The table to the left shows the same group of companies’ maintenance and growth capital spend over the past decade. The key take away is that industry participants have grown by way of acquisition, which was over 3 times higher than capital expenditures, in the aggregate, over the past decade. This is primarily the result of incumbents’ strong competitive positions in their niches, which are underpinned by proprietary datasets and sticky customer relationships (it is easier to enter a new market by way of acquisition than to start from scratch). Of note, this acquisition activity has resulted in significant accounting goodwill on those companies’ balance sheets; over $17BN or 66% of the 26BN capital employed (debt and equity) in the industry in 2015 (compared to approximately 18% of accounting goodwill to capital employed for the S&P 500 group of companies vi ) . This leads to a significant understatement of the peer group’s return on equity figures in the top chart. PEER GROUP RETURN ON EQUITY & *INVESTED CAPITAL HISTORY 2015 2014 2013 2012 2011 2010 2009 2008 2007 2006 2005 FICO 19.4% 19.3% 17.9% 19.6% 15.2% 12.0% 11.3% 14.4% 16.7% 13.3% 15.6% I.H.S. 8.7% 8.8% 6.7% 10.7% 10.6% 12.2% 13.8% 12.0% 11.9% 11.2% 9.8% MSCI Inc 19.7% 13.3% 13.4% 12.1% 14.4% 11.6% 20.6% 28.1% 15.8% 8.0% n.a. Equafax Inc 19.0% 16.3% 15.9% 15.0% 13.9% 14.6% 15.3% 18.7% 24.9% 33.6% 37.4% The Dun & Bradstreet Corporation* 42.2% 58.1% 78.8% 115.1% 106.3% 99.2% 215.6% 182.5% 161.8% 119.3% 67.4% S&P Global, Inc 101.0% (10.9%) 46.0% 43.4% 32.3% 28.4% 45.9% 55.4% 47.9% 30.5% 27.7% FactSet Research Systems Inc 46.2% 40.2% 36.3% 35.4% 33.6% 29.9% 30.0% 28.6% 28.5% 26.5% 33.2% Moody's Corporation * 32.6% 35.2% 33.2% 41.4% 53.3% 62.0% 80.3% 112.0% 176.6% 127.6% 95.7% Corporate Executive Board Inc* 16.4% 13.9% 11.9% 18.6% 74.3% 77.9% 161.0% 165.0% 36.3% 18.6% 17.5% Gartner Inc* 31.0% 33.7% 31.5% 34.0% 33.2% 22.7% 20.0% 25.0% 21.8% 15.8% 12.2% Verisk Analytics Inc* 15.4% 24.0% 21.7% 26.3% 34.5% 43.0% 172.7% n.a. n.a. n.a. n.a. Peer Group Average 32.0% 22.9% 28.5% 33.8% 38.3% 37.6% 71.5% 64.2% 54.2% 40.4% 35.2% Aggregate S&P 500 ROE 11.6% 13.8% 14.2% 13.4% 14.5% 14.2% 11.7% 4.7% 13.6% 16.9% 15.4% Industry's Economic Goodwill 20.3% 9.1% 14.3% 20.3% 23.8% 23.4% 59.8% 59.5% 40.7% 23.6% 19.8% Source: S&P Capital IQ, based on companies' 10-K filings * Return On Invested Capital
  • 4. 4 The information in the table below is related to major products and services the company offers and it covers the period between 2011 and 2015. VRSK’s market positions related to the property and casualty market segment (over 64% of 2015 revenues) are exceptionally strong. Of note, the market shares have been virtually unchanged over the 5 year period, in mostly growing markets. Two product offerings (highlighted in yellow and green) provide a good view of the company’s overall competitive position. Through its industry standard programs (highlighted in yellow, over 25% of 2015 aggregate revenues), VRSK is the most comprehensive provider of solutions to P&C insurers in defining coverage and issuing policies. The company serves all top 100 P&C insurers. VRSK provides a variety of products, including turnkey solutions that handle policy language rules and regulations in setting up new coverage. ISO interacts with state regulators and processes over 3,000 regulatory filings each year. VRSK acts as a “statistical agent” on behalf of P&C insurers when they send out data on premiums and losses to state regulators. The company also processes 3.4 billion individual records of insurance transactions. ISO computers store more than 19 billion records on insurance premiums collected and losses paid. This data also grows by about 2 billion each year. Overall, it captures 70 to 75 percent of the entire industry’s premium volume data. This database assists clients in pricing their risk to avoid premium leakage (i.e., undercharging for a specified level of risk). Based on a conversation with Eva Huston, VRSK’s CFO, ISO’s market share is well over 50%, probably closer to 80%. The competitive landscape in this segment is minimal. P&C insurers either use VRSK’s solutions or use their own internal risk pricing systems. Clients typically pay VRSK a yearly subscription fee due in 1Q. One-third of pricing is usually based on the insurer’s size and two-thirds is based on premiums and the diversity of its clients (i.e., how many states and lines of business an insurer has). Through the company’s property-specific and underwriting information product (highlighted in green,~ 8% of 2015 aggregate revenues), VRSK has data on over 3.6 million commercial buildings and 6.4 million individual businesses in the U.S. These datasets assist companies in pricing and evaluating personal, commercial property, and commercial liability insurance policies. This data is maintained by over 600 field representatives located throughout the U.S. who visit over 300k commercial properties a year to collect information on new buildings in the U.S. VRSK also provides peril-specific information to insurers based in individual communities (i.e., a community’s firefighting capabilities). The key differentiator is VRSK’s multiple peril datasets, such as crime, windstorm, earthquake, wildfire, and flood risk. These data sets allow the company to be on both sides of an insurable event: 1) before the event, underwriting, and 2) after the event for cost estimation. Insurers and commercial real estate lenders use the information to price polices and analyze risk concentration in particular areas. This segment is 70% transaction driven (i.e., per- click) and 30% subscription driven. Brokers use VRSK’s dataset to vet the risk of underwriting an insurance policy on a specific commercial building or a residential property in a specific community. VRSK has more than an 85% market share in this segment, with the rest of the space handled by more regional niche players or P&C insurer’s internal systems. VERISK ANALYTICS, INC. P&C RELATED MARKET SHARE & COMPETITORS Product/Services Competitors Verisk's Share* Revenue Model Industry Standard Programs (ISO) Internal Very High (>50%) Subscription Specific Property Information Internal >85% Subscription/Transaction Claim Fraud Detection Internal ~ 93% Subscription Property Rebuild & Damage Claims Estimating Marshall & Swift/Boeckh ~ 80% on Claims** Subscription/Transaction # 2 on underwriting Catastrophe Modeling RMS, EQECAT #1 In Personal Lines Subscription #2 In Commercial Lines Propery & Auto Claims Data REED ELSEVIER <10% Subscription/Transaction Sources: Analyst Day Presentations, 2011, 2012, 2013 Phone conversation with VRSK's CFO, Eva Huston on August 25, 2016 * Market share refers to merchant market ** It was ~75% in 2011
  • 5. 5 The chart to the left shows VRSK’s organic insurance related revenue growth, relative to the US property and casulty industry’s premium growth over a nine year period. VRSK’s market position is best revealed during the latest recession, when P&C industry premium growth turned negative, while VRSK’s organic revenue growth rate remained positive. More importantly, organic revenue growth was not only driven by price increases on old products, but a mix of new products and services introductions and price increases (the company does not disclose numeric break down). Further, the actual VRSK’s insurance related revenue organic growth rate was actually higher than the one shown in the chart (based on company’s past presentations and comments to analysts, however, in order to provide consistent data on the chart, only traceble data was used). This financial outcome is primarily the result of: 1) VRSK’s unique databases and resulting analytics solutions; 2) which are embedded in customers’ workflows; and 3) provided at low cost relative to customers overall cost base (~80 basis points to 1 percent of P&C insurers’ underwriting expenses 3 , which are generally dominated by employee related costs and advertising expenses). Sticky customer relationships underpinned by a diverse customer base, contractual-based revenues, collaborative product development, and high switching costs resulting in utility like/stable cash flows and sustainably strong pricing power The graph to the left shows VRSK’s customer retention rate over the past 12 years, which has been consistently over 98%. Per Kevin Stuebe, the Moody’s analyst covering VRSK, the 2% VRSK does not retain is either a result of consolidation or the company/customer simply going out of business. VRSK does not typically lose customers to competition vii . Additionally, Verisk has very little customer concentration. The company’s largest customer contributes only about 5% of total revenues, and the top 10 customers 21% of total revenues. This prohibits any one single customer to have buying power leverage over VRSK. In addition, the majority of revenues for VRSK are derived from long-term contracts (3 to 5 year durations), providing the company stable/predictable cash flows. In fact, 82% of VRSK’s aggregate revenues are subscription based. The third graph to the left shows the cadence of relative subscription based revenues by VRSK’s business segment. The key take away from this graph is the increase of the subscription based revenues in both segments over the past 5 years, which has been one of the company’s strategic objectives. Partly as a result of the subscription based revenues the company generates stable/predictable 3 Assuming underwriting expenses are on average 25% of one dollar of industry’s premium VRSK SUBSCRIPTION REVENUE RELATIVE CONTRIBUTION Risk assesmentDecision Source: Verisk Analytics, Inc. 10-K Filings For Fiscal Years 2012 through 2015 85.7% 87.1% 88.2% 89.6% 90.1% 57% 55% 64% 62% 67% 0.0% 10.0% 20.0% 30.0% 40.0% 50.0% 60.0% 70.0% 80.0% 90.0% 100.0% 2011 2012 2013 2014 2015 Risk Assesment DecisionAnalytics VERISK ANALYTICS, INC. P&C CUSTOMER RETENTION RATES Sources: Credit Suisse 2010 Inititation of Coverage for the years 2004 - 2009 2010 - 2015 Figures Based On Management's Comments At Annual Analyst Presentations 98.4% >98% 75% 80% 85% 90% 95% 100% 2004 2005 2006 2007 2008 2009 2010 2011 2012 2013 2014 2015
  • 6. 6 cash flows. In 2015, VRSK generated $458MM in free cash (operating minus capital expenditures); Bank of America estimates this number to steadily grow to ~$615MM in 2018 (due to higher projected growth in P&C industry premium volume and new products and services). The high subscription revenue base combined with the exceptionally high retention rates and unique datasets makes it difficult for competitors to enter VRSK’s markets. This also makes it costly for customers to switch (or build internal capabilities). Even if a customer has VRSK’s database resources (which are continually updated with competitors’ sensitive data), that customer would still have to employ highly skilled professionals. VRSK’s human capital base (7,647 total full time employees) includes over 170 actuarial professionals, including 35 Fellows and 24 Associates of the Casualty Actuarial Society, as well as 139 Chartered Property Casualty Underwriters, 17 Certified and 15 Associate Insurance Data Managers, and 592 professionals with advanced degrees, including: PhDs in mathematics and statistical modeling who review both the data and the models; over 107 specialized lawyers and insurance experts reviewing changes in each state’s insurance rules and regulations, including on average over 16,000 legislative bills, 1,900 regulatory actions and 2,000 court cases per year, to make any required changes to VRSK’s policy language and rating information products. Further, much of the company’s technology is developed, maintained and supported by approximately 1,631 employees. A customer such as American International Group, Inc. (AIG) wanting to build equivalent internal capabilities, arguably, would have to significantly bolster its fixed costs. AIG’s selling, general, and administrative (SGA) expenses in 2015 were over $12.6BN and reported net income of over $2.1BN viii , compared to VRSK’s combined costs of revenues and (SG&A) expenses, which are dominated by salaries and wages of over $1.1BN in 2015. Assuming that replication by a customer results in one third (a conservative estimate) of VRSK’s total labor and wages costs (the customer would not need a sales force) or over $366MM, in the case of AIG the after-tax impact on net income (assuming 2015 figures) would be over $248MM or a decline of over 12%; a significant impact with no offsetting earnings potential (would a competitor want to buy and submit competitively sensitive data to AIG?). Furthermore, VRSK has been successful in innovating and building on its strong incumbent position. Its Decision Analytics segment is a direct offshoot of its legacy database business. The chart to left shows that segment’s organic revenue growth on a sub-segment basis. The company achieves this in three principle ways: 1) raising prices; 2) cross selling; and 3) more importantly creating new products and services through collaborative customer relationships. Often customers give feedback and ask to be provided new solutions, or VRSK suggests new solutions. If one company has a need for a product, chances are high that other companies are in need of that same (or a similar) offering. History of successful complementary acquisitions, in line with VRSK’s high margin business model Since January 1, 2003 VRSK has acquired approximately 44 businesses ix . A lot of those were self sourced transactions x . VRSK has a 5 member team that continuously evaluates potential acquisition candidates. Of note, the company has a list of 50 companies (a lot of them private and relatively small, and not on investment bankers’ radars) which VRSK would like to add to the fold. The majority of those are not usually for sale but VRSK actively researches them and in many cases has been in touch with the target’s management team, developing relationships xi years before a transaction materializes. VRSK DECISION ANALYTICS ORGANIC GROWTH ($MM) Source: Verisk Analytics, Inc. 10-K Filings For Fiscal Years 2012 through 2015 $8.1% 11.1% 9.0% 9.2% 20.5% 19.3% 20.2% (3.8)% 5.1% (1.5)%) 0.3% 8.3% $(10.0) $- $10.0 $20.0 $30.0 $40.0 $50.0 $60.0 $70.0 2015 2014 2013 2012 Insurance Financial Services Energy/Specialized Markets
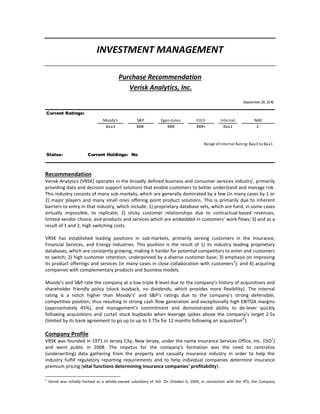
  • 7. 7 VRSK’s acquisitions throughout the years have proven to be successful as judged by the lack of goodwill impairment charges over the past 11 years and over $193MM of acquisition earn-out payments during the same time frame; compared to $1.7BN of cash acquisitions over the past 11 years, excluding the Wood Mackenzie transaction in 2015. One strategic objective (the healthcare sub-segment), underpinned by acquisitions, was not meeting the company’s expectations and in 2016 VRSK exited the space. Of note, the sale resulted in a gain of over $269MM; suggesting that management did not overpay for the acquisitions making up that segment. VRSK’s largest acquisition closed in 2015, when the company bought Wood Mackenzie (WM), a global leader in data analytics and commercial intelligence for the energy, chemicals, metals and mining verticals for $2.8BN. The company financed the acquisition through an equity offering with proceeds of $722MM, bond offerings of $900MM, and borrowings of approximately $1.0BN using its revolver (the company used the proceeds from the healthcare sub-segment sale, over $719MM, to pay down the revolver). WM’s business model fits VRSK’s mold. WM has been a trusted partner to customers for over 40 years; it has similar customer retention rates (over 98% in the past 5 years); it has a subscription-based revenue model (over 80% of the company’s revenue is subscription based); and it has been successful at diversifying (top 10 clients accounted for ~30% and ~21% total revenues in 2009 and 2015, respectively) and adding (590 and 900 customers in 2009 and 2015, respectively) to its customer base xii . Given the poor performance of oil and gas over the past two years, the company has performed well (see chart to the left). Revenues in this year’s second quarter for WM were flat on a constant currency basis. A couple of the main reasons for WM’s favorable revenue performance are: 1) the importance of WM’s product and services to customers; 2) the relative cheapness of those to the overall cost structures of its customers; and 3) the mix of customers, 90% of which are integrated (see green CAPEX line above) as opposed upstream/independent oil and gas companies (see blue CAPEX line above) xiii . Further, this acquisition has already resulted in unique synergies, strengthening both VRSK’s insurance related product offerings and the energy related product offerings; this is exemplified by the recent launch of a new energy insurance unit — drawing on proprietary data from both units— focused on risk assessment, rating, and risk modeling for the oil and gas, petrochemicals, power generation, and metals and mining industries xiv . Lastly, another way to observe if acquisitions are working out (and are similar high margin businesses) is to compare aggregate revenue growth versus aggregate operating income growth; over the past 5 years revenues and operating income have compounded at over 14% and 12%, respectively. Revenue growth has outpaced operating income growth due to: 1) the lower margin healthcare business, which the company sold in 2016; 2) and partly as a result of acquisitions related expenses. Overall, the close compounded growth rates, on an unadjusted basis, have developed favorably. UPSTREAM OIL CAPITAL EXPENDITURES & WOODMAC REVENUE GROWTH Source: Bank of America Merill Lynch, Equity Report, August 3, 2016
  • 8. 8 Primary risks and mitigants include: 1) Reputational risks, including abusing its strong market position with customers (price gouging). a) Mitigants: History of good client relationships, partly shown by VRSK’s strong customer retention rates over the years. Commitment to introducing new products and services, many of which are spurred by VRSK’s collaborative relationship with its customers, which seek out VRSK’s expertise in solving problems. History of restraint (conservative price increases) and commitment by current management to continue this practice; as confirmed by Eva Huston, VRSK’s CFO, on a phone conversation on August 25, 2016. 2) Cyber security risk. Verisk has a large and diverse set of databases which are vital to the daily workflows of their customers. Security breaches in their facilities, computer networks, and databases could cause harm to their business and reputation, and could result in a loss of customers. Additionally, the company runs the risk of computer viruses or attacks by hackers. a) Mitigants: VRSK has 2 back up data centers located on opposite coasts of the country (New Jersey and Utah). Verisk essentially holds zero personal information in their datasets. The data they receive is de-personalized. This drastically limits the incentive for someone to hack the company. Verisk has adopted a wide range of measures to ensure the security of their IT infrastructure and data. Security measures generally cover the following key areas: physical security; logical security of the perimeter; network security such as firewalls; logical access to the operating systems; deployment of virus detection software; and appropriate policies and procedures relating to removable media such as laptops. All laptops are encrypted and media leaving VRSK’s premises that is sent to a third-party storage facility is also encrypted. This commitment has led VRSK to achieve certification from CyberTrust (an industry leader in information security certification) since 2002. 3) Financial risk due to high leverage through acquisitions and stock buybacks. VRSK tends to finance its acquisitions through its revolver, which is considered a “non-investment grade” activity by rating agencies (Moody’s). a) Mitigants: After discussing VRSK’s Baa3 rating with Kevin Stuebe, the Moody’s analyst covering the company, he agreed that the company “deserves an upgrade”; according to Moody’s own ratings methodology, VRSK’s grid indicated rating maps to Baa2. The two rating grid specific factors viewed conservatively by the Moody’s analyst are: 1) VRSK’s use of its revolver for acquisitions; and 2) VRSK scale/revenue base; both of those represent 30% of total rating factors weight. i) VRSK aggressively uses its revolver to fund acquisitions due to its quick transaction time, as opposed to going out into the market to issue debt (lengthy process). VRSK also uses this strategy to avoid keeping too much idle cash on the balance sheet. This way, VRSK can return cash to shareholders through share repurchases and still have the capability of acquiring a company. VRSK has set a Debt/EBITDA target of 2.5x for the end of this fiscal year (and as a long term objective; the company is limited to 3.75x by its bank facilities). The company’s commitment to that objective has most recently has been observed during and after the WM acquisition; when VRSK sold off its healthcare division, used the proceeds to pay down the revolver and curtailed stock buy backs. ii) The assigned revenue factor score misses VRSK’s high quality revenue (in terms of stability). 4) Potential to lose access to data from external sources. Verisk is extremely dependent on external sources for its data collection. These data sources include data received from customers and various government and public record services. VRSK does not generally own this data, and because they essentially pay next to nothing for the data, they could be cut off. a) Mitigants: If a company/customer stopped providing data to Verisk, that customer would lose the essential services VRSK provides them, which are based on industry data, supplied by competitors to that customer. Further, VRSK’s services are embedded into its customers’ daily workflows, and are a necessary component of their business. In addition, VRSK provides good customer as
  • 9. 9 indicated by its stable retention rates (consistently over 98% over the past decade), complemented by the customer satisfaction tracking (net promoter scoring system), which reported at the Board level and results in improvement action plans (per VRSK’s CFO, the company does not publicly disclose those scores) xv . Further, customers lack the internal capabilities VRSK has developed over decades and no single customer accounts for over 5% of revenues. 5) Competition. a) Mitigants: i) VRSK strong incumbent proprietary database driven business model ii) VRSK’s proactive acquisition strategy, which entails keeping a close eye on emerging/potential and established competitors iii) Collaborative customer relationships, increasing customer satisfaction iv) The company’s proactive organic growth strategy, which entails broadening its targeted market opportunity, underpinned by a 20% target market share framework. This is driven by the company’s strategy of applying its current products and services to new markets and customers. Benchmarks VRSK will be monitored for achieving the following management-stated benchmarks:  Normalized debt to EBITDA of 2.5x VRSK will be monitored for achieving the following analyst-stated benchmarks:  Continuation of current proactive acquisition policy  Continued high customer retention>90%  Continued emphasis on introducing new products and solutions (tracked through how revenues grow; price increases versus new product offerings)  Consistent EBITDA margins >40% Harrison Hessel Credit Risk Analyst Intern September 26, 2016
  • 10. 10 VERISK ANALYTICS, INC. SELECT FINANCIAL RATIOS 2011 2012 2013 2014 2015 LTM 12 months Jun-30-2016 Profitability Return on Assets % 21.7% 18.4% 15.8% 17.2% 12.0% 9.5% Return on Capital % 34.5% 26.3% 21.7% 24.0% 15.4% 12.1% Return on Equity % NM 404.2% 85.2% 97.8% 64.1% 34.8% Margin Analysis Gross Margin % 63.0% 63.3% 61.0% 59.2% 61.2% 61.4% SG&A Margin % 16.7% 15.5% 14.3% 13.0% 13.8% 14.5% EBITDA Margin % 46.1% 47.5% 46.1% 45.2% 45.7% 45.3% EBIT Margin % 40.2% 40.8% 38.5% 38.1% 37.0% 35.7% Short Term Liquidity Current Ratio 1.3x 0.7x 1.1x 0.5x 0.4x 0.8x Quick Ratio 1.1x 0.5x 0.9x 0.4x 0.3x 0.7x Cash from Ops. to Curr. Liab. 1.1x 0.8x 1.2x 0.6x 0.4x 1.1x Long Term Solvency Total Debt/Equity NM 571.8% 233.0% 680.9% 230.9% 156.9% Total Debt/Capital 109.8% 85.1% 70.0% 87.2% 69.8% 61.1% LT Debt/Equity NM 495.4% 232.2% 521.6% 167.1% 156.8% LT Debt/Capital 109.2% 73.7% 69.7% 66.8% 50.5% 61.0% Total Liabilities/Total Assets 106.4% 89.2% 78.1% 91.0% 75.6% 69.3% EBIT / Interest Exp. 8.9x 7.9x 8.1x 9.5x 6.3x 6.2x EBITDA / Interest Exp. 10.2x 9.2x 9.7x 11.3x 7.8x 7.9x (EBITDA-CAPEX) / Interest Exp. 9.1x 8.2x 7.8x 9.2x 6.4x 6.6x Total Debt/EBITDA 2.0x 2.2x 1.7x 1.8x 3.4x 2.2x Net Debt/EBITDA 1.7x 2.0x 1.5x 1.8x 3.2x 2.0x Total Debt/(EBITDA-CAPEX) 2.3x 2.5x 2.2x 2.2x 4.1x 2.7x Net Debt/(EBITDA-CAPEX) 1.9x 2.3x 1.9x 2.2x 3.9x 2.4x Source: S&P Capital IQ
  • 11. 11 VERISK ANALYTICS, INC. INCOME STATEMENT 2011 2012 2013 2014 2015 LTM 12 months Jun-30-2016 Revenue 1,191.4 1,407.8 1,595.7 1,746.7 2,068.0 2,246.1 Cost Of Goods Sold 441.0 516.7 622.5 711.8 803.3 866.6 Gross Profit 750.4 891.1 973.2 1,034.9 1,264.7 1,379.5 Selling General & Admin Exp. 198.5 218.2 229.0 227.0 285.1 326.2 Depreciation & Amort. 40.1 46.6 66.2 85.5 120.6 139.8 Amort. of Goodwill and Intangibles 33.0 52.2 63.7 56.9 94.9 112.2 Other Operating Exp., Total 271.6 317.0 358.9 369.3 500.5 578.2 Operating Income 478.8 574.1 614.3 665.6 764.2 801.3 Interest Expense (53.8) (72.5) (76.1) (70.0) (121.3) (128.9) Interest and Invest. Income 0.2 0.4 0.7 - 1.6 2.2 Net Interest Exp. (53.7) (72.1) (75.4) (70.0) (119.7) (126.6) EBT Excl. Unusual Items 425.1 502.0 538.8 595.6 644.5 674.7 Merger & Related Restruct. Charges (1.0) (1.9) - (0.3) 57.6 (1.0) Impairment of Goodwill - - - - - - Gain (Loss) On Sale Of Invest. 0.7 (0.3) (0.1) 0.2 15.4 16.4 Other Unusual Items 3.4 - - (4.8) - - EBT Incl. Unusual Items 428.2 499.8 538.7 590.6 717.4 690.1 Income Tax Expense 165.7 182.4 196.4 219.8 209.9 221.3 Earnings from Continuing Operations 262.5 317.5 342.3 370.9 507.6 468.8 Earnings of Discontinued Ops. 20.3 11.7 6.1 29.2 - 131.2 Extraord. Item & Account. Change - - - - - - Net Income to Company 282.8 329.1 348.4 400.0 507.6 599.9 Supplemental Items EBITDA 549.5 669.4 736.0 790.1 944.8 1,018.5 EBITA 513.6 627.7 678.6 722.6 859.1 913.5 Source: S&P Capital IQ
  • 12. 12 VERISK ANALYTICS, INC. STATEMENT OF CASH FLOWS 2011 2012 2013 2014 2015 LTM 12 months Jun-30-2016 Net Income 282.8 329.1 348.4 400.0 507.6 599.9 Depreciation & Amort. 35.9 41.7 57.5 67.5 85.8 105.0 Amort. of Goodwill and Intangibles 34.8 53.6 64.3 57.0 94.9 112.2 Depreciation & Amort., Total 70.7 95.3 121.8 124.5 180.6 217.2 Other Amortization 9.6 11.3 15.5 21.6 47.7 39.6 (Gain) Loss From Sale Of Assets 0.9 0.6 0.6 1.0 0.4 1.2 (Gain) Loss On Sale Of Invest. (0.7) 0.3 0.1 (0.3) 0.2 0.5 Stock-Based Compensation 35.9 37.8 36.0 35.6 44.6 42.3 Tax Benefit from Stock Options (53.2) (60.7) (109.9) (22.6) (40.1) (38.3) Provision & Write-off of Bad debts 1.3 1.1 2.5 1.8 1.3 2.2 Net Cash From Discontinued Ops. - - - (65.4) - (280.0) Other Operating Activities 18.1 63.5 44.6 24.5 (104.3) (5.6) Working Capital 10.5 (10.0) 47.4 (31.5) (14.2) 67.8 Cash from Ops. 375.7 468.2 506.9 489.5 623.7 646.7 Capital Expenditure (59.8) (74.4) (146.0) (146.8) (166.1) (168.3) Cash Acquisitions (125.2) (769.8) (1.0) (35.2) (2,858.2) (52.7) Divestitures - - - 151.2 - - Invest. in Marketable & Equity Securt. 0.2 (2.1) 1.6 (4.7) 0.1 0.3 Net (Inc.) Dec. in Loans Originated/Sold - - - - - - Other Investing Activities (19.3) (37.3) (0.3) - 2.3 714.6 Cash from Investing (204.1) (883.6) (145.6) (35.5) (3,021.9) 493.9 Short Term Debt Issued 130.0 357.2 - 160.0 830.0 - Long-Term Debt Issued 696.6 347.2 - - 1,244.0 - Total Debt Issued 826.6 704.4 - 160.0 2,074.0 (30.0) Short Term Debt Repaid (440.0) (347.2) (10.0) - (120.0) - Long-Term Debt Repaid (125.0) - (180.0) - (220.0) - Total Debt Repaid (565.0) (347.2) (190.0) - (340.0) (990.0) Issuance of Common Stock 43.3 68.4 80.4 24.6 775.3 52.7 Repurchase of Common Stock (381.8) (162.3) (277.4) (778.5) (20.5) (136.8) Total Dividends Paid - - - - - - Other Financing Activities 42.1 50.2 102.6 14.8 7.8 27.5 Cash from Financing (34.8) 313.6 (284.5) (579.1) 2,496.6 (1,076.7) Foreign Exchange Rate Adj. (0.2) 0.0 (0.8) (1.3) 0.6 (13.0) Net Change in Cash 136.6 (101.8) 76.0 (126.4) 99.0 50.9 Supplemental Items Cash Interest Paid 48.2 61.0 75.1 67.2 106.1 131.0 Cash Taxes Paid 117.7 47.5 126.8 205.5 158.5 220.2 Levered Free Cash Flow 305.6 390.6 391.0 379.5 556.6 643.3 Unlevered Free Cash Flow 337.6 433.6 435.9 420.6 619.5 719.1 Change in Net Working Capital 16.2 (7.1) (27.4) 27.7 (47.9) (92.3) Net Debt Issued 261.6 357.2 (190.0) 160.0 1,734.0 (1,020.0) Net Cash From Discontinued Ops. - Investing - - - - - 719.374 Source: S&P Capital IQ
  • 13. 13 VERISK ANALYTICS, INC. BALANCE SHEET Balance Sheet 2011 2012 2013 2014 2015 LTM 12 months Jun-30-2016 Currency ASSETS Cash And Equivalents 191.6 89.8 165.8 39.4 138.3 196.4 Short Term Investments 5.1 4.9 3.9 3.8 3.6 3.4 Total Cash & ST Investments 196.7 94.7 169.7 43.2 141.9 199.8 Accounts Receivable 153.3 178.4 158.5 220.7 320.1 241.3 Other Receivables 36.7 46.0 67.3 65.5 48.9 5.7 Total Receivables 190.0 224.4 225.9 286.2 369.0 247.1 Prepaid Exp. 21.9 21.9 25.7 31.5 40.7 30.9 Deferred Tax Assets, Curr. 3.8 10.4 5.1 4.8 - - Other Current Assets 41.2 39.1 48.5 18.9 53.0 19.2 Total Current Assets 453.7 390.6 474.8 384.5 604.6 496.9 Gross Property, Plant & Equipment 175.8 198.6 252.3 297.2 354.8 - Accumulated Depreciation (115.4) (131.6) (151.8) (185.0) (226.3) - Net Property, Plant & Equipment 60.4 67.0 100.5 112.2 128.6 334.6 Long-term Investments 3.4 5.0 3.6 8.5 8.5 16.9 Goodwill 709.9 1,247.5 1,181.7 1,207.1 3,134.8 2,629.9 Other Intangibles 285.4 608.0 580.5 596.6 1,666.4 1,104.3 Deferred Tax Assets, LT 10.5 - - - - - Other Long-Term Assets 17.8 42.3 163.3 36.5 73.1 142.4 Total Assets 1,541.1 2,360.3 2,504.5 2,345.3 5,615.9 4,725.1 LIABILITIES Accounts Payable 65.7 79.7 81.0 87.4 105.8 163.4 Accrued Exp. 70.4 80.7 81.8 89.6 103.1 1.8 Short-term Borrowings - 10.0 - 160.0 870.0 - Curr. Port. of LT Debt - 180.0 - 170.0 - - Curr. Port. of Cap. Leases 5.6 5.3 4.4 6.1 4.8 2.3 Curr. Income Taxes Payable - - - - - 16.5 Unearned Revenue, Current 176.8 200.7 226.6 252.6 357.0 431.2 Other Current Liabilities 31.1 29.0 37.4 5.6 38.6 - Total Current Liabilities 349.7 585.4 431.2 771.3 1,479.3 615.2 Long-Term Debt 1,096.7 1,264.4 1,265.1 1,095.8 2,290.9 2,271.1 Capital Leases 3.7 1.8 6.3 5.0 2.3 2.0 Pension & Other Post-Retire. Benefits 127.7 41.3 15.1 16.2 15.0 14.6 Def. Tax Liability, Non-Curr. - 133.8 198.6 202.5 396.4 314.7 Other Non-Current Liabilities 61.9 78.2 40.6 43.4 60.1 57.7 Total Liabilities 1,639.6 2,104.7 1,956.9 2,134.3 4,243.9 3,275.2 Common Stock 0.1 0.1 0.1 0.1 0.1 0.1 Additional Paid In Capital 874.8 1,044.7 1,202.1 1,171.2 2,023.4 2,071.5 Retained Earnings 576.6 905.7 1,254.1 1,654.1 2,161.7 2,516.1 Treasury Stock (1,471.0) (1,605.4) (1,865.0) (2,533.8) (2,571.2) (2,680.7) Comprehensive Inc. and Other (79.0) (89.6) (43.8) (80.7) (242.1) (457.1) Total Common Equity (98.5) 255.6 547.6 211.0 1,372.0 1,449.9 Total Equity (98.5) 255.6 547.6 211.0 1,372.0 1,449.9 Total Liabilities And Equity 1,541.1 2,360.3 2,504.5 2,345.3 5,615.9 4,725.1 Supplemental Items Total Shares Out. on Filing Date 164.8 168.1 166.8 157.9 168.0 169.0 Total Shares Out. on Balance Sheet Date 164.3 167.7 167.5 157.9 169.4 168.7 Book Value/Share ($0.6) $1.52 $3.27 $1.34 $8.1 $8.59 Total Debt 1,105.9 1,461.4 1,275.9 1,436.9 3,168.0 2,275.3 Net Debt 909.2 1,366.7 1,106.2 1,393.8 3,026.1 2,075.5 Source: S&P Capital IQ
  • 14. 14 References: i Moody’s Versiks Analytics rating methodology, December 8, 2014 ii Based on telephone conversation with Eva Huston, Verisk Analytics Inc Chief Financial Officer, August 25, 2016 iii Based on telephone conversation with Eva Huston, Verisk Analytics Inc Chief Financial Officer, August 25, 2016 iv Andreessen Horowitz: http://a16z.com/2016/03/07/all-about-network-effects/ v Interactive Data Corporation, press release, November 24, 2015: https://www.idc.com/getdoc.jsp?containerId=prUS40635515 vi Accounting good will figures on pages 2 and 3 are based on S&P Capital IQ and Bloomberg data vii Based on telephone conversation with Kevin Stuebe from Moody’s on August 23, 2016 viii American International Group, Inc 2015 10-K ix August 12, 2008 S-1 (IPO) filing and 10-K filings 2010 through 2016 x Credit Suisse: Initiating Coverage With An Outperform Rating by Kelly Flynn, CFA and Norman Young, December 02, 2010 xi Based on telephone conversation with Eva Huston, Verisk Analytics Inc Chief Financial Officer, August 25, 2016 xii 2015 Verisk Analytics, Inc. investor day presentation, pages 66 and 67 xiii Bank of America Merill Lynch: Lowering Forecasts on Margins, But No Change To Verisk’s Top-Line Outlook, Sara Gubins, Faton Begolli, and David Chu, August 3, 2016 xiv Versik Analytics Inc. press release, September 19, 2016 xv Eva Huston August 24, 2016