SlideShare uma empresa Scribd logo
1 de 3
Baixar para ler offline
© 2017 Jones Lang LaSalle IP, Inc. All rights reserved. All information contained herein is from sources deemed reliable; however, no representation or warranty is made to the accuracy thereof.
Q1 2017
Chicago Suburbs
Office Insight
While at first glance a hefty negative absorption number can cause investors
and users some concern, it is important to see that the drivers behind this
number have been anticipated for some time. As Westell, Walgreens, Grainger,
and Abbott Laboratories all officially vacated large blocks throughout the
suburbs, none of these moves were surprising and each had been well known
before this quarter. The underlying activity in midsized leasing is the true story
of the first quarter. 20,000-50,000-square-foot leasing and move-ins were
prevalent, contributing to many of the suburbs’ strongest, most consistent
themes. Midsized tenants continue to grow and thrive, capitalizing on
favorable leasing economics and even tenants moving downtown largely
retain a presence in the suburbs, as well.
Sales activity took a slow start to the year. We expect that this is a result of
caution surrounding the Federal Reserve’s recent interest rate hikes.
Expectations are that activity will pick up in the reset of 2017, as investors seek
greater return outside of compressing cap rates in major markets.
Outlook
Our forecast for 2017 still remains positive on all fronts. High-activity
submarkets such as O’Hare, Eastern East/West, and North (Cook County) will
continue to drive suburban activity and see increasing rental rates and
decreasing vacancy. Investors and developers will consider new suburban
office development as Class A space becomes harder to find. Tenants moving
downtown will continue to maintain a suburban presence as young families
again target those markets for affordability. Investors will consider the
suburbs more frequently as cap rate compression in major markets forces
large pockets of sidelined capital to broaden their horizons. All together, the
economic landscape is favorable and prepared from a strong year.
Fundamentals Forecast
YTD net absorption -717,619 s.f. ▲
Under construction 368,000 s.f. ▲
Total vacancy 20.4% ▼
Average asking rent (gross) $24.91 p.s.f. ▲
Concessions Steady ▶
-1,000,000
0
1,000,000
2013 2014 2015 2016 YTD
2017
Supply and demand (s.f.) Net absorption
Deliveries
A handful of anticipated move-outs should not dampen
suburban outlook for 2017
24.3%
22.6%
18.5% 19.1%
20.4%
10.0%
15.0%
20.0%
25.0%
30.0%
2013 2014 2015 2016 2017
Total vacancy
$0.00
$20.00
2013 2014 2015 2016 2017
Average asking rents ($/s.f.) Class A
Class B
For more information, contact: Jack M. Trager| jack.trager@am.jll.com
• Negative absorption was largely expected in the first quarter, as several
large, expected move-outs finally reflected in the market.
• Minor rent increases were seen in most of the suburban submarkets and
spread across building classes.
• Investors took a cautious approach to the recent interest rate hikes, as
capital markets activity was relatively tame.
Chicago
Q1 2017
Office Statistics
Class Inventory (s.f.)
Total net
absorption
(s.f.)
YTD total net
absorption
(s.f.)
YTD total net
absorption
(% of stock)
Direct
vacancy (%)
Total
vacancy (%)
Average
direct asking
rent ($ p.s.f.)
YTD
completions
(s.f.)
Under
construction
(s.f.)
West Loop Totals 48,606,523 512,399 512,399 1.1% 12.8% 13.8% $43.11 3,127,164 1,257,500
Central Loop Totals 37,160,358 -294,516 -294,516 -0.8% 10.1% 11.0% $37.27 0 0
East Loop Totals 24,346,395 28,129 28,129 0.1% 11.4% 11.8% $35.61 0 0
South Loop Totals 1,163,943 7,502 7,502 0.6% 2.8% 2.8% $25.92 0 2,450,000
North Michigan Avenue Totals 11,145,481 72,257 72,257 0.6% 10.1% 10.9% $38.08 0 0
River North Totals 16,330,258 5,488 5,488 0.0% 5.2% 6.1% $40.14 0 50,000
Kennedy West Totals 5,304,298 42,971 42,971 0.8% 10.9% 11.0% $32.93 0 1,057,790
Far West Loop Totals 1,709,818 -15,534 -15,534 -0.9% 13.5% 13.7% $31.47 0 0
Fulton Market Totals 2,947,999 63,879 63,879 2.2% 9.4% 9.6% $33.89 0 1,057,790
River West Totals 646,481 -5,374 -5,374 -0.8% 10.4% 10.4% $32.54 0 0
CBD Totals 144,057,256 374,230 374,230 0.3% 10.6% 11.5% $39.38 3,127,164 4,815,290
Eastern East-West Totals 22,831,285 -24,315 -24,315 -0.1% 15.2% 17.3% $25.49 228,000 0
Western East-West Totals 14,611,686 -101,272 -101,272 -0.7% 18.1% 20.3% $24.15 0 0
North (Cook County) Totals 10,217,404 -35,652 -35,652 -0.3% 15.6% 16.0% $28.22 0 0
North (Lake County) Totals 15,931,526 -430,423 -430,423 -2.7% 25.8% 26.8% $25.71 0 0
O'Hare Totals 12,393,927 -1,578 -1,578 0.0% 16.2% 16.8% $24.98 0 0
Northwest Totals 27,167,960 -124,379 -124,379 -0.5% 21.2% 22.5% $23.45 0 368,000
Suburbs Totals 103,153,788 -717,619 -717,619 -0.7% 19.0% 20.4% $24.91 228,000 368,000
Chicago Totals 247,211,044 -343,389 -343,389 -0.1% 14.1% 15.2% $31.26 3,355,164 5,183,290
West Loop A 31,957,041 471,211 471,211 1.5% 13.1% 14.1% $46.87 3,127,164 1,257,500
Central Loop A 10,191,682 -219,395 -219,395 -2.2% 10.0% 12.2% $42.55 0 0
East Loop A 5,511,381 11,050 11,050 0.2% 5.4% 5.4% $43.42 0 0
North Michigan Avenue A 2,871,938 -15,783 -15,783 -0.5% 7.9% 8.2% $38.03 0 0
River North A 8,606,690 6,134 6,134 0.1% 4.0% 4.5% $44.84 0 50,000
Kennedy West A 1,072,473 -16,381 -16,381 -1.5% 5.7% 5.7% $34.48 0 0
Far West Loop A 35,462 -21,959 -21,959 -61.9% 61.9% 61.9% $32.00 0 0
Fulton Market A 852,011 3,359 3,359 0.4% 3.0% 3.0% $38.46 0 1,057,790
River West A 185,000 2,219 2,219 1.2% 7.4% 7.4% $33.00 0 0
CBD A 60,211,205 236,836 236,836 0.4% 10.2% 11.2% $45.14 3,127,164 2,365,290
Eastern East-West A 9,728,397 25,055 25,055 0.3% 12.2% 14.7% $28.63 228,000 0
Western East-West A 5,534,716 40,877 40,877 0.7% 16.9% 19.9% $27.16 0 0
North (Cook County) A 5,446,551 -3,810 -3,810 -0.1% 19.7% 20.1% $29.69 0 0
North (Lake County) A 11,300,485 -320,224 -320,224 -2.8% 26.9% 27.9% $25.50 0 0
O'Hare A 6,732,939 12,784 12,784 0.2% 13.3% 14.2% $29.57 0 0
Northwest A 16,499,980 86,854 86,854 0.5% 14.9% 15.6% $25.62 0 368,000
Suburbs A 55,243,068 -158,464 -158,464 -0.3% 17.4% 18.7% $26.86 228,000 368,000
Chicago A 115,454,273 78,372 78,372 0.1% 13.6% 14.8% $34.00 3,355,164 2,733,290
West Loop B 14,142,482 55,811 55,811 0.4% 13.3% 14.4% $35.91 0 0
Central Loop B 22,670,390 -42,426 -42,426 -0.2% 10.1% 10.5% $35.39 0 0
East Loop B 12,342,590 80,777 80,777 0.7% 13.0% 13.8% $34.87 0 0
North Michigan Avenue B 5,699,740 4,379 4,379 0.1% 12.7% 13.8% $40.08 0 0
River North B 5,896,409 -1,201 -1,201 0.0% 7.3% 8.2% $36.44 0 0
Kennedy West B 3,195,001 59,352 59,352 1.9% 12.1% 12.2% $32.29 0 0
Far West Loop B 1,230,612 6,425 6,425 0.5% 9.9% 9.9% $31.33 0 0
Fulton Market B 1,593,724 60,520 60,520 3.8% 15.6% 15.9% $32.88 0 0
River West B 370,665 -7,593 -7,593 -2.0% 4.6% 4.6% $20.00 0 0
CBD B 63,946,612 156,692 156,692 0.2% 11.5% 12.2% $35.66 0 0
Eastern East-West B 10,609,756 -56,539 -56,539 -0.5% 17.3% 19.3% $21.78 0 0
Western East-West B 8,024,928 -135,599 -135,599 -1.7% 19.4% 21.2% $21.71 0 0
North (Cook County) B 3,956,814 -30,393 -30,393 -0.8% 11.7% 11.8% $24.74 0 0
North (Lake County) B 4,351,794 -108,645 -108,645 -2.5% 24.5% 25.3% $26.38 0 0
O'Hare B 4,218,447 -8,186 -8,186 -0.2% 21.4% 21.8% $21.67 0 0
Northwest B 8,953,234 -156,790 -156,790 -1.8% 31.8% 33.8% $21.84 0 0
Suburbs B 40,114,973 -496,152 -496,152 -1.2% 21.6% 23.1% $22.69 0 0
Chicago B 104,061,585 -339,460 -339,460 -0.3% 15.4% 16.4% $28.63 0 0
Chicago | Office Statistics | Q1 2017
Class Inventory (s.f.)
Total net
absorption
(s.f.)
YTD total net
absorption
(s.f.)
YTD total net
absorption
(% of stock)
Direct
vacancy (%)
Total
vacancy (%)
Average
direct asking
rent ($ p.s.f.)
YTD
completions
(s.f.)
Under
construction
(s.f.)
West Loop C 2,507,000 -14,623 -14,623 -0.6% 6.2% 7.4% $32.18 0 0
Central Loop C 4,298,286 -32,695 -32,695 -0.8% 10.1% 11.0% $32.21 0 0
East Loop C 6,492,424 -63,698 -63,698 -1.0% 13.4% 13.5% $30.27 0 0
South Loop C 1,163,943 7,502 7,502 0.6% 2.8% 2.8% $25.92 0 2,450,000
North Michigan Avenue C 2,573,803 83,661 83,661 3.3% 6.8% 7.2% $32.76 0 0
River North C 1,827,159 555 555 0.0% 4.0% 6.8% $31.05 0 0
Kennedy West C 1,036,824 0 0 0.0% 12.5% 12.7% $33.53 0 0
Far West Loop C 443,744 0 0 0.0% 19.9% 20.3% $31.59 0 0
Fulton Market C 502,264 0 0 0.0% 1.0% 1.0% $35.80 0 0
River West C 90,816 0 0 0.0% 39.9% 39.9% $32.33 0 0
CBD C 19,899,439 -26,800 -26,800 -0.1% 9.4% 10.1% $31.20 0 2,450,000
Eastern East-West C 2,493,132 7,169 7,169 0.3% 18.1% 18.7% $15.96 0 0
Western East-West C 1,052,042 -6,550 -6,550 -0.6% 15.0% 15.0% $15.43 0 0
North (Cook County) C 814,039 -1,449 -1,449 -0.2% 7.2% 9.4% $18.50 0 0
North (Lake County) C 279,247 -1,554 -1,554 -0.6% 2.7% 2.7% N/A 0 0
O'Hare C 1,442,541 -6,176 -6,176 -0.4% 14.4% 14.4% $15.28 0 0
Northwest C 1,714,746 -54,443 -54,443 -3.2% 26.2% 29.6% $17.83 0 0
Suburbs C 7,795,747 -63,003 -63,003 -0.8% 17.1% 18.3% $16.81 0 0
Chicago C 27,695,186 -89,803 -89,803 -0.3% 11.6% 12.4% $25.20 0 2,450,000
Hailey Harrington | Research Manager
200 E Randolph Street Chicago, IL 60601 | tel +1 312 228 3189 | hailey.harrington@am.jll.com
2017 Jones Lang LaSalle IP, Inc. All rights reserved.

Mais conteúdo relacionado

Mais procurados

JLL Grand Rapids Office Insight & Statistics - Q4 2019
JLL Grand Rapids Office Insight & Statistics - Q4 2019JLL Grand Rapids Office Insight & Statistics - Q4 2019
JLL Grand Rapids Office Insight & Statistics - Q4 2019Harrison West
 
eBay 2008, Q3 Earnings
eBay 2008, Q3 EarningseBay 2008, Q3 Earnings
eBay 2008, Q3 EarningsKeith Teare
 
REBGV Stats Package January 2012
REBGV Stats Package January 2012REBGV Stats Package January 2012
REBGV Stats Package January 2012vancouverhomesteam
 
September 2021 Market Watch Report
September 2021 Market Watch ReportSeptember 2021 Market Watch Report
September 2021 Market Watch ReportMichelle Makos
 
Market Stats for October 2021
Market Stats for October 2021Market Stats for October 2021
Market Stats for October 2021Michelle Makos
 
November 2021 Market Watch
November 2021 Market WatchNovember 2021 Market Watch
November 2021 Market WatchMichelle Makos
 
Hilton Head Island Tourism Statistics Do Speak for Themselves
Hilton Head Island Tourism Statistics Do Speak for ThemselvesHilton Head Island Tourism Statistics Do Speak for Themselves
Hilton Head Island Tourism Statistics Do Speak for Themselvespeterb442
 
JLL Louisville Office Outlook Q4 2017
JLL Louisville Office Outlook Q4 2017JLL Louisville Office Outlook Q4 2017
JLL Louisville Office Outlook Q4 2017Alex Westcott
 
Debt presentation slides 11.05.13
Debt presentation slides 11.05.13Debt presentation slides 11.05.13
Debt presentation slides 11.05.13cityofevanston
 
Rebgv stats-pkg-september-2018
Rebgv stats-pkg-september-2018Rebgv stats-pkg-september-2018
Rebgv stats-pkg-september-2018Kathryn Huang
 
Rebgv stats-pkg-january-2019
Rebgv stats-pkg-january-2019Rebgv stats-pkg-january-2019
Rebgv stats-pkg-january-2019Kathryn Huang
 
Metro Vancouver - Stats Centre Reports - August 2021
Metro Vancouver - Stats Centre Reports - August 2021Metro Vancouver - Stats Centre Reports - August 2021
Metro Vancouver - Stats Centre Reports - August 2021Vicky Aulakh
 
REBGV January 2020 Statistics Package
REBGV January 2020 Statistics Package REBGV January 2020 Statistics Package
REBGV January 2020 Statistics Package Vicky Aulakh
 
Rebgv stats-pkg-october-2018 .pdf
Rebgv stats-pkg-october-2018 .pdf Rebgv stats-pkg-october-2018 .pdf
Rebgv stats-pkg-october-2018 .pdf Kathryn Huang
 
Real Estate Board of Greater Vancouver Statistics Package - November 2021
Real Estate Board of Greater Vancouver Statistics Package - November 2021Real Estate Board of Greater Vancouver Statistics Package - November 2021
Real Estate Board of Greater Vancouver Statistics Package - November 2021VickyAulakh1
 
Central Okanagan Statistics November 2021
Central Okanagan Statistics November 2021 Central Okanagan Statistics November 2021
Central Okanagan Statistics November 2021 VickyAulakh1
 
Rebgv stats-pkg-april-2020
Rebgv stats-pkg-april-2020Rebgv stats-pkg-april-2020
Rebgv stats-pkg-april-2020Vicky Aulakh
 
JLL Detroit Office Insight & Statistics - Q2 2019
JLL Detroit Office Insight & Statistics - Q2 2019JLL Detroit Office Insight & Statistics - Q2 2019
JLL Detroit Office Insight & Statistics - Q2 2019Harrison West
 
Realogics Urbnlivn Presentation
Realogics Urbnlivn PresentationRealogics Urbnlivn Presentation
Realogics Urbnlivn Presentationurbnlivn
 
Rebgv stats-pkg-september-2019
Rebgv stats-pkg-september-2019Rebgv stats-pkg-september-2019
Rebgv stats-pkg-september-2019Vicky Aulakh
 

Mais procurados (20)

JLL Grand Rapids Office Insight & Statistics - Q4 2019
JLL Grand Rapids Office Insight & Statistics - Q4 2019JLL Grand Rapids Office Insight & Statistics - Q4 2019
JLL Grand Rapids Office Insight & Statistics - Q4 2019
 
eBay 2008, Q3 Earnings
eBay 2008, Q3 EarningseBay 2008, Q3 Earnings
eBay 2008, Q3 Earnings
 
REBGV Stats Package January 2012
REBGV Stats Package January 2012REBGV Stats Package January 2012
REBGV Stats Package January 2012
 
September 2021 Market Watch Report
September 2021 Market Watch ReportSeptember 2021 Market Watch Report
September 2021 Market Watch Report
 
Market Stats for October 2021
Market Stats for October 2021Market Stats for October 2021
Market Stats for October 2021
 
November 2021 Market Watch
November 2021 Market WatchNovember 2021 Market Watch
November 2021 Market Watch
 
Hilton Head Island Tourism Statistics Do Speak for Themselves
Hilton Head Island Tourism Statistics Do Speak for ThemselvesHilton Head Island Tourism Statistics Do Speak for Themselves
Hilton Head Island Tourism Statistics Do Speak for Themselves
 
JLL Louisville Office Outlook Q4 2017
JLL Louisville Office Outlook Q4 2017JLL Louisville Office Outlook Q4 2017
JLL Louisville Office Outlook Q4 2017
 
Debt presentation slides 11.05.13
Debt presentation slides 11.05.13Debt presentation slides 11.05.13
Debt presentation slides 11.05.13
 
Rebgv stats-pkg-september-2018
Rebgv stats-pkg-september-2018Rebgv stats-pkg-september-2018
Rebgv stats-pkg-september-2018
 
Rebgv stats-pkg-january-2019
Rebgv stats-pkg-january-2019Rebgv stats-pkg-january-2019
Rebgv stats-pkg-january-2019
 
Metro Vancouver - Stats Centre Reports - August 2021
Metro Vancouver - Stats Centre Reports - August 2021Metro Vancouver - Stats Centre Reports - August 2021
Metro Vancouver - Stats Centre Reports - August 2021
 
REBGV January 2020 Statistics Package
REBGV January 2020 Statistics Package REBGV January 2020 Statistics Package
REBGV January 2020 Statistics Package
 
Rebgv stats-pkg-october-2018 .pdf
Rebgv stats-pkg-october-2018 .pdf Rebgv stats-pkg-october-2018 .pdf
Rebgv stats-pkg-october-2018 .pdf
 
Real Estate Board of Greater Vancouver Statistics Package - November 2021
Real Estate Board of Greater Vancouver Statistics Package - November 2021Real Estate Board of Greater Vancouver Statistics Package - November 2021
Real Estate Board of Greater Vancouver Statistics Package - November 2021
 
Central Okanagan Statistics November 2021
Central Okanagan Statistics November 2021 Central Okanagan Statistics November 2021
Central Okanagan Statistics November 2021
 
Rebgv stats-pkg-april-2020
Rebgv stats-pkg-april-2020Rebgv stats-pkg-april-2020
Rebgv stats-pkg-april-2020
 
JLL Detroit Office Insight & Statistics - Q2 2019
JLL Detroit Office Insight & Statistics - Q2 2019JLL Detroit Office Insight & Statistics - Q2 2019
JLL Detroit Office Insight & Statistics - Q2 2019
 
Realogics Urbnlivn Presentation
Realogics Urbnlivn PresentationRealogics Urbnlivn Presentation
Realogics Urbnlivn Presentation
 
Rebgv stats-pkg-september-2019
Rebgv stats-pkg-september-2019Rebgv stats-pkg-september-2019
Rebgv stats-pkg-september-2019
 

Semelhante a Chicago Suburbs Office Market Remains Positive Despite Large Q1 Move-Outs

Jll cincinnati office outlook q1 2017
Jll cincinnati office outlook   q1 2017Jll cincinnati office outlook   q1 2017
Jll cincinnati office outlook q1 2017Abby Armbruster
 
JLL Louisville Office Outlook - Q4 2018
JLL Louisville Office Outlook - Q4 2018JLL Louisville Office Outlook - Q4 2018
JLL Louisville Office Outlook - Q4 2018Alex Westcott
 
JLL Cincinnati Office Insight & Statistics - Q3 2016
JLL Cincinnati Office Insight & Statistics - Q3 2016JLL Cincinnati Office Insight & Statistics - Q3 2016
JLL Cincinnati Office Insight & Statistics - Q3 2016Ross Bratcher
 
JLL Downtown Chicago Office Market Update - Q3 2016
JLL Downtown Chicago Office Market Update - Q3 2016JLL Downtown Chicago Office Market Update - Q3 2016
JLL Downtown Chicago Office Market Update - Q3 2016Hailey Harrington
 
JLL Pittsburgh Office Insight & Statistics - Q4 2017
JLL Pittsburgh Office Insight & Statistics - Q4 2017JLL Pittsburgh Office Insight & Statistics - Q4 2017
JLL Pittsburgh Office Insight & Statistics - Q4 2017Tobiah Bilski
 
JLL Louisville Office Outlook - Q4 2019
JLL Louisville Office Outlook - Q4 2019JLL Louisville Office Outlook - Q4 2019
JLL Louisville Office Outlook - Q4 2019Alex Westcott
 
JLL Louisville Office Outlook - Q1 2019
JLL Louisville Office Outlook - Q1 2019JLL Louisville Office Outlook - Q1 2019
JLL Louisville Office Outlook - Q1 2019Alex Westcott
 
JLL Detroit Office Insight & Statistics - Q3 2017
JLL Detroit Office Insight & Statistics - Q3 2017JLL Detroit Office Insight & Statistics - Q3 2017
JLL Detroit Office Insight & Statistics - Q3 2017Harrison West
 
JLL Detroit Office Insight & Statistics - Q4 2017
JLL Detroit Office Insight & Statistics - Q4 2017JLL Detroit Office Insight & Statistics - Q4 2017
JLL Detroit Office Insight & Statistics - Q4 2017Harrison West
 
JLL Detroit Office Insight & Statistics – Q2 2016
JLL Detroit Office Insight & Statistics – Q2 2016JLL Detroit Office Insight & Statistics – Q2 2016
JLL Detroit Office Insight & Statistics – Q2 2016Aaron Moore
 
JLL Detroit Office Insight & Statistics - Q2 2017
JLL Detroit Office Insight & Statistics - Q2 2017JLL Detroit Office Insight & Statistics - Q2 2017
JLL Detroit Office Insight & Statistics - Q2 2017Harrison West
 
JLL Cincinnati Office Outlook Q4 2020
JLL Cincinnati Office Outlook Q4 2020JLL Cincinnati Office Outlook Q4 2020
JLL Cincinnati Office Outlook Q4 2020Abby Armbruster
 
St. Louis Office Outlook Q3 2016
St. Louis Office Outlook Q3 2016St. Louis Office Outlook Q3 2016
St. Louis Office Outlook Q3 2016Blaise Tomazic
 
JLL Detroit Office Insight & Statistics - Q3 2018
JLL Detroit Office Insight & Statistics - Q3 2018JLL Detroit Office Insight & Statistics - Q3 2018
JLL Detroit Office Insight & Statistics - Q3 2018Harrison West
 
JLL Cleveland Office Outlook: Q2 2018
JLL Cleveland Office Outlook: Q2 2018JLL Cleveland Office Outlook: Q2 2018
JLL Cleveland Office Outlook: Q2 2018Andrew Batson
 
JLL Pittsburgh Office Insight & Statistics - Q2 2020
JLL Pittsburgh Office Insight & Statistics - Q2 2020JLL Pittsburgh Office Insight & Statistics - Q2 2020
JLL Pittsburgh Office Insight & Statistics - Q2 2020Tobiah Bilski
 
JLL Pittsburgh Office Outlook - Q4 2015
JLL Pittsburgh Office Outlook - Q4 2015JLL Pittsburgh Office Outlook - Q4 2015
JLL Pittsburgh Office Outlook - Q4 2015Andrew Batson
 
JLL Detroit Office Insight & Statistics - Q1 2018
JLL Detroit Office Insight & Statistics - Q1 2018JLL Detroit Office Insight & Statistics - Q1 2018
JLL Detroit Office Insight & Statistics - Q1 2018Harrison West
 
JLL Pittsburgh Office Insight & Statistics - Q4 2018
JLL Pittsburgh Office Insight & Statistics - Q4 2018JLL Pittsburgh Office Insight & Statistics - Q4 2018
JLL Pittsburgh Office Insight & Statistics - Q4 2018Tobiah Bilski
 

Semelhante a Chicago Suburbs Office Market Remains Positive Despite Large Q1 Move-Outs (20)

Jll cincinnati office outlook q1 2017
Jll cincinnati office outlook   q1 2017Jll cincinnati office outlook   q1 2017
Jll cincinnati office outlook q1 2017
 
JLL Louisville Office Outlook - Q4 2018
JLL Louisville Office Outlook - Q4 2018JLL Louisville Office Outlook - Q4 2018
JLL Louisville Office Outlook - Q4 2018
 
JLL Cincinnati Office Insight & Statistics - Q3 2016
JLL Cincinnati Office Insight & Statistics - Q3 2016JLL Cincinnati Office Insight & Statistics - Q3 2016
JLL Cincinnati Office Insight & Statistics - Q3 2016
 
JLL Downtown Chicago Office Market Update - Q3 2016
JLL Downtown Chicago Office Market Update - Q3 2016JLL Downtown Chicago Office Market Update - Q3 2016
JLL Downtown Chicago Office Market Update - Q3 2016
 
JLL Houston 2018 Q1 Office Market Report
JLL Houston 2018 Q1 Office Market ReportJLL Houston 2018 Q1 Office Market Report
JLL Houston 2018 Q1 Office Market Report
 
JLL Pittsburgh Office Insight & Statistics - Q4 2017
JLL Pittsburgh Office Insight & Statistics - Q4 2017JLL Pittsburgh Office Insight & Statistics - Q4 2017
JLL Pittsburgh Office Insight & Statistics - Q4 2017
 
JLL Louisville Office Outlook - Q4 2019
JLL Louisville Office Outlook - Q4 2019JLL Louisville Office Outlook - Q4 2019
JLL Louisville Office Outlook - Q4 2019
 
JLL Louisville Office Outlook - Q1 2019
JLL Louisville Office Outlook - Q1 2019JLL Louisville Office Outlook - Q1 2019
JLL Louisville Office Outlook - Q1 2019
 
JLL Detroit Office Insight & Statistics - Q3 2017
JLL Detroit Office Insight & Statistics - Q3 2017JLL Detroit Office Insight & Statistics - Q3 2017
JLL Detroit Office Insight & Statistics - Q3 2017
 
JLL Detroit Office Insight & Statistics - Q4 2017
JLL Detroit Office Insight & Statistics - Q4 2017JLL Detroit Office Insight & Statistics - Q4 2017
JLL Detroit Office Insight & Statistics - Q4 2017
 
JLL Detroit Office Insight & Statistics – Q2 2016
JLL Detroit Office Insight & Statistics – Q2 2016JLL Detroit Office Insight & Statistics – Q2 2016
JLL Detroit Office Insight & Statistics – Q2 2016
 
JLL Detroit Office Insight & Statistics - Q2 2017
JLL Detroit Office Insight & Statistics - Q2 2017JLL Detroit Office Insight & Statistics - Q2 2017
JLL Detroit Office Insight & Statistics - Q2 2017
 
JLL Cincinnati Office Outlook Q4 2020
JLL Cincinnati Office Outlook Q4 2020JLL Cincinnati Office Outlook Q4 2020
JLL Cincinnati Office Outlook Q4 2020
 
St. Louis Office Outlook Q3 2016
St. Louis Office Outlook Q3 2016St. Louis Office Outlook Q3 2016
St. Louis Office Outlook Q3 2016
 
JLL Detroit Office Insight & Statistics - Q3 2018
JLL Detroit Office Insight & Statistics - Q3 2018JLL Detroit Office Insight & Statistics - Q3 2018
JLL Detroit Office Insight & Statistics - Q3 2018
 
JLL Cleveland Office Outlook: Q2 2018
JLL Cleveland Office Outlook: Q2 2018JLL Cleveland Office Outlook: Q2 2018
JLL Cleveland Office Outlook: Q2 2018
 
JLL Pittsburgh Office Insight & Statistics - Q2 2020
JLL Pittsburgh Office Insight & Statistics - Q2 2020JLL Pittsburgh Office Insight & Statistics - Q2 2020
JLL Pittsburgh Office Insight & Statistics - Q2 2020
 
JLL Pittsburgh Office Outlook - Q4 2015
JLL Pittsburgh Office Outlook - Q4 2015JLL Pittsburgh Office Outlook - Q4 2015
JLL Pittsburgh Office Outlook - Q4 2015
 
JLL Detroit Office Insight & Statistics - Q1 2018
JLL Detroit Office Insight & Statistics - Q1 2018JLL Detroit Office Insight & Statistics - Q1 2018
JLL Detroit Office Insight & Statistics - Q1 2018
 
JLL Pittsburgh Office Insight & Statistics - Q4 2018
JLL Pittsburgh Office Insight & Statistics - Q4 2018JLL Pittsburgh Office Insight & Statistics - Q4 2018
JLL Pittsburgh Office Insight & Statistics - Q4 2018
 

Mais de Hailey Harrington

Can the Chicago office vacancy predict a Cubs postseason appearance?
Can the Chicago office vacancy predict a Cubs postseason appearance?Can the Chicago office vacancy predict a Cubs postseason appearance?
Can the Chicago office vacancy predict a Cubs postseason appearance?Hailey Harrington
 
Chicago's office buildings are casting a long shadow
Chicago's office buildings are casting a long shadowChicago's office buildings are casting a long shadow
Chicago's office buildings are casting a long shadowHailey Harrington
 
Chicago's office construction history...where are we now?
Chicago's office construction history...where are we now?Chicago's office construction history...where are we now?
Chicago's office construction history...where are we now?Hailey Harrington
 
Where did Chicago's VC dollars go this quarter?
Where did Chicago's VC dollars go this quarter?Where did Chicago's VC dollars go this quarter?
Where did Chicago's VC dollars go this quarter?Hailey Harrington
 
Chicago Suburbs Office Insight - Q2 2016
Chicago Suburbs Office Insight - Q2 2016Chicago Suburbs Office Insight - Q2 2016
Chicago Suburbs Office Insight - Q2 2016Hailey Harrington
 
Chicago Suburbs Office Insight - Q2 2016
Chicago Suburbs Office Insight - Q2 2016Chicago Suburbs Office Insight - Q2 2016
Chicago Suburbs Office Insight - Q2 2016Hailey Harrington
 

Mais de Hailey Harrington (6)

Can the Chicago office vacancy predict a Cubs postseason appearance?
Can the Chicago office vacancy predict a Cubs postseason appearance?Can the Chicago office vacancy predict a Cubs postseason appearance?
Can the Chicago office vacancy predict a Cubs postseason appearance?
 
Chicago's office buildings are casting a long shadow
Chicago's office buildings are casting a long shadowChicago's office buildings are casting a long shadow
Chicago's office buildings are casting a long shadow
 
Chicago's office construction history...where are we now?
Chicago's office construction history...where are we now?Chicago's office construction history...where are we now?
Chicago's office construction history...where are we now?
 
Where did Chicago's VC dollars go this quarter?
Where did Chicago's VC dollars go this quarter?Where did Chicago's VC dollars go this quarter?
Where did Chicago's VC dollars go this quarter?
 
Chicago Suburbs Office Insight - Q2 2016
Chicago Suburbs Office Insight - Q2 2016Chicago Suburbs Office Insight - Q2 2016
Chicago Suburbs Office Insight - Q2 2016
 
Chicago Suburbs Office Insight - Q2 2016
Chicago Suburbs Office Insight - Q2 2016Chicago Suburbs Office Insight - Q2 2016
Chicago Suburbs Office Insight - Q2 2016
 

Último

Call Girls in Adarsh Nagar Delhi 💯Call Us 🔝 9582086666🔝 South Delhi Escorts S...
Call Girls in Adarsh Nagar Delhi 💯Call Us 🔝 9582086666🔝 South Delhi Escorts S...Call Girls in Adarsh Nagar Delhi 💯Call Us 🔝 9582086666🔝 South Delhi Escorts S...
Call Girls in Adarsh Nagar Delhi 💯Call Us 🔝 9582086666🔝 South Delhi Escorts S...delhimodel235
 
M3M The Line Brochure - Premium Investment Opportunity for Commercial Ventures
M3M The Line Brochure - Premium Investment Opportunity for Commercial VenturesM3M The Line Brochure - Premium Investment Opportunity for Commercial Ventures
M3M The Line Brochure - Premium Investment Opportunity for Commercial Venturessheltercareglobal
 
BDSM⚡Call Girls in Sector 57 Noida Escorts >༒8448380779 Escort Service
BDSM⚡Call Girls in Sector 57 Noida Escorts >༒8448380779 Escort ServiceBDSM⚡Call Girls in Sector 57 Noida Escorts >༒8448380779 Escort Service
BDSM⚡Call Girls in Sector 57 Noida Escorts >༒8448380779 Escort ServiceDelhi Call girls
 
Magarpatta Nova Elegance Mundhwa Pune E-Brochure.pdf
Magarpatta Nova Elegance Mundhwa Pune  E-Brochure.pdfMagarpatta Nova Elegance Mundhwa Pune  E-Brochure.pdf
Magarpatta Nova Elegance Mundhwa Pune E-Brochure.pdfManishSaxena95
 
Sankla East World Hadapsar Pune E-Brochure.pdf
Sankla East World Hadapsar Pune  E-Brochure.pdfSankla East World Hadapsar Pune  E-Brochure.pdf
Sankla East World Hadapsar Pune E-Brochure.pdfManishSaxena95
 
Maha Mauka Squarefeet Brochure |Maha Mauka Squarefeet PDF Brochure|
Maha Mauka Squarefeet Brochure |Maha Mauka Squarefeet PDF Brochure|Maha Mauka Squarefeet Brochure |Maha Mauka Squarefeet PDF Brochure|
Maha Mauka Squarefeet Brochure |Maha Mauka Squarefeet PDF Brochure|AkshayJoshi575980
 
How to Build Multifamily and Laneway Suites in Toronto!! (feat. Expert Archi...
How to Build Multifamily and Laneway Suites  in Toronto!! (feat. Expert Archi...How to Build Multifamily and Laneway Suites  in Toronto!! (feat. Expert Archi...
How to Build Multifamily and Laneway Suites in Toronto!! (feat. Expert Archi...Volition Properties
 
Call Girls In Chand Nagar (Delhi)+918447779280 Welcome To Vip Women Seeking M...
Call Girls In Chand Nagar (Delhi)+918447779280 Welcome To Vip Women Seeking M...Call Girls In Chand Nagar (Delhi)+918447779280 Welcome To Vip Women Seeking M...
Call Girls In Chand Nagar (Delhi)+918447779280 Welcome To Vip Women Seeking M...asmaqueen5
 
2k Shot Call girls Karol Bagh Delhi 9205541914
2k Shot Call girls Karol Bagh Delhi 92055419142k Shot Call girls Karol Bagh Delhi 9205541914
2k Shot Call girls Karol Bagh Delhi 9205541914Delhi Call girls
 
Kohinoor Hinjewadi Phase 2 Pune E-Brochure.pdf
Kohinoor Hinjewadi Phase 2 Pune  E-Brochure.pdfKohinoor Hinjewadi Phase 2 Pune  E-Brochure.pdf
Kohinoor Hinjewadi Phase 2 Pune E-Brochure.pdfManishSaxena95
 
Puravankara Mundhwa Pune E-Brochure.pdf
Puravankara Mundhwa Pune  E-Brochure.pdfPuravankara Mundhwa Pune  E-Brochure.pdf
Puravankara Mundhwa Pune E-Brochure.pdfManishSaxena95
 
Call Girls in laxmi Nagar Delhi 💯Call Us 🔝 9582086666🔝 South Delhi Escorts Se...
Call Girls in laxmi Nagar Delhi 💯Call Us 🔝 9582086666🔝 South Delhi Escorts Se...Call Girls in laxmi Nagar Delhi 💯Call Us 🔝 9582086666🔝 South Delhi Escorts Se...
Call Girls in laxmi Nagar Delhi 💯Call Us 🔝 9582086666🔝 South Delhi Escorts Se...delhimodel235
 
M3M 129 E Brochure Noida Expressway, Sector 129, Noida
M3M 129 E Brochure Noida Expressway, Sector 129, NoidaM3M 129 E Brochure Noida Expressway, Sector 129, Noida
M3M 129 E Brochure Noida Expressway, Sector 129, Noidasarak0han45400
 
Call Girls In Hari Nagar Dadb Block {8447779280}Hari Nagar {West Delhi Escort...
Call Girls In Hari Nagar Dadb Block {8447779280}Hari Nagar {West Delhi Escort...Call Girls In Hari Nagar Dadb Block {8447779280}Hari Nagar {West Delhi Escort...
Call Girls In Hari Nagar Dadb Block {8447779280}Hari Nagar {West Delhi Escort...asmaqueen5
 
Call Girls in Noida Sector 12 Noida 💯Call Us 🔝 9582086666 🔝 South Delhi Escor...
Call Girls in Noida Sector 12 Noida 💯Call Us 🔝 9582086666 🔝 South Delhi Escor...Call Girls in Noida Sector 12 Noida 💯Call Us 🔝 9582086666 🔝 South Delhi Escor...
Call Girls in Noida Sector 12 Noida 💯Call Us 🔝 9582086666 🔝 South Delhi Escor...delhimodel235
 
Purva Soukhyam in Guduvancheri Chennai.pdf
Purva Soukhyam in Guduvancheri Chennai.pdfPurva Soukhyam in Guduvancheri Chennai.pdf
Purva Soukhyam in Guduvancheri Chennai.pdfpritika141199
 
Call girls in new Ashok NagarDelhi꧁ 8447779280꧂ Escort Service Women Seeking ...
Call girls in new Ashok NagarDelhi꧁ 8447779280꧂ Escort Service Women Seeking ...Call girls in new Ashok NagarDelhi꧁ 8447779280꧂ Escort Service Women Seeking ...
Call girls in new Ashok NagarDelhi꧁ 8447779280꧂ Escort Service Women Seeking ...asmaqueen5
 
:/Call Girls In Saidulajab Delhi ➥9990211544 High profile Riya Escorts In 24/...
:/Call Girls In Saidulajab Delhi ➥9990211544 High profile Riya Escorts In 24/...:/Call Girls In Saidulajab Delhi ➥9990211544 High profile Riya Escorts In 24/...
:/Call Girls In Saidulajab Delhi ➥9990211544 High profile Riya Escorts In 24/...lizamodels9
 
FULL ENJOY - 8264348440 Call Girls in DLf Phase 4 | Gurgaon
FULL ENJOY - 8264348440 Call Girls in DLf Phase 4 | GurgaonFULL ENJOY - 8264348440 Call Girls in DLf Phase 4 | Gurgaon
FULL ENJOY - 8264348440 Call Girls in DLf Phase 4 | Gurgaonsoniya singh
 
Call Girls in Noida Sector 77 Noida 💯Call Us 🔝 9582086666 🔝 South Delhi Escor...
Call Girls in Noida Sector 77 Noida 💯Call Us 🔝 9582086666 🔝 South Delhi Escor...Call Girls in Noida Sector 77 Noida 💯Call Us 🔝 9582086666 🔝 South Delhi Escor...
Call Girls in Noida Sector 77 Noida 💯Call Us 🔝 9582086666 🔝 South Delhi Escor...delhimodel235
 

Último (20)

Call Girls in Adarsh Nagar Delhi 💯Call Us 🔝 9582086666🔝 South Delhi Escorts S...
Call Girls in Adarsh Nagar Delhi 💯Call Us 🔝 9582086666🔝 South Delhi Escorts S...Call Girls in Adarsh Nagar Delhi 💯Call Us 🔝 9582086666🔝 South Delhi Escorts S...
Call Girls in Adarsh Nagar Delhi 💯Call Us 🔝 9582086666🔝 South Delhi Escorts S...
 
M3M The Line Brochure - Premium Investment Opportunity for Commercial Ventures
M3M The Line Brochure - Premium Investment Opportunity for Commercial VenturesM3M The Line Brochure - Premium Investment Opportunity for Commercial Ventures
M3M The Line Brochure - Premium Investment Opportunity for Commercial Ventures
 
BDSM⚡Call Girls in Sector 57 Noida Escorts >༒8448380779 Escort Service
BDSM⚡Call Girls in Sector 57 Noida Escorts >༒8448380779 Escort ServiceBDSM⚡Call Girls in Sector 57 Noida Escorts >༒8448380779 Escort Service
BDSM⚡Call Girls in Sector 57 Noida Escorts >༒8448380779 Escort Service
 
Magarpatta Nova Elegance Mundhwa Pune E-Brochure.pdf
Magarpatta Nova Elegance Mundhwa Pune  E-Brochure.pdfMagarpatta Nova Elegance Mundhwa Pune  E-Brochure.pdf
Magarpatta Nova Elegance Mundhwa Pune E-Brochure.pdf
 
Sankla East World Hadapsar Pune E-Brochure.pdf
Sankla East World Hadapsar Pune  E-Brochure.pdfSankla East World Hadapsar Pune  E-Brochure.pdf
Sankla East World Hadapsar Pune E-Brochure.pdf
 
Maha Mauka Squarefeet Brochure |Maha Mauka Squarefeet PDF Brochure|
Maha Mauka Squarefeet Brochure |Maha Mauka Squarefeet PDF Brochure|Maha Mauka Squarefeet Brochure |Maha Mauka Squarefeet PDF Brochure|
Maha Mauka Squarefeet Brochure |Maha Mauka Squarefeet PDF Brochure|
 
How to Build Multifamily and Laneway Suites in Toronto!! (feat. Expert Archi...
How to Build Multifamily and Laneway Suites  in Toronto!! (feat. Expert Archi...How to Build Multifamily and Laneway Suites  in Toronto!! (feat. Expert Archi...
How to Build Multifamily and Laneway Suites in Toronto!! (feat. Expert Archi...
 
Call Girls In Chand Nagar (Delhi)+918447779280 Welcome To Vip Women Seeking M...
Call Girls In Chand Nagar (Delhi)+918447779280 Welcome To Vip Women Seeking M...Call Girls In Chand Nagar (Delhi)+918447779280 Welcome To Vip Women Seeking M...
Call Girls In Chand Nagar (Delhi)+918447779280 Welcome To Vip Women Seeking M...
 
2k Shot Call girls Karol Bagh Delhi 9205541914
2k Shot Call girls Karol Bagh Delhi 92055419142k Shot Call girls Karol Bagh Delhi 9205541914
2k Shot Call girls Karol Bagh Delhi 9205541914
 
Kohinoor Hinjewadi Phase 2 Pune E-Brochure.pdf
Kohinoor Hinjewadi Phase 2 Pune  E-Brochure.pdfKohinoor Hinjewadi Phase 2 Pune  E-Brochure.pdf
Kohinoor Hinjewadi Phase 2 Pune E-Brochure.pdf
 
Puravankara Mundhwa Pune E-Brochure.pdf
Puravankara Mundhwa Pune  E-Brochure.pdfPuravankara Mundhwa Pune  E-Brochure.pdf
Puravankara Mundhwa Pune E-Brochure.pdf
 
Call Girls in laxmi Nagar Delhi 💯Call Us 🔝 9582086666🔝 South Delhi Escorts Se...
Call Girls in laxmi Nagar Delhi 💯Call Us 🔝 9582086666🔝 South Delhi Escorts Se...Call Girls in laxmi Nagar Delhi 💯Call Us 🔝 9582086666🔝 South Delhi Escorts Se...
Call Girls in laxmi Nagar Delhi 💯Call Us 🔝 9582086666🔝 South Delhi Escorts Se...
 
M3M 129 E Brochure Noida Expressway, Sector 129, Noida
M3M 129 E Brochure Noida Expressway, Sector 129, NoidaM3M 129 E Brochure Noida Expressway, Sector 129, Noida
M3M 129 E Brochure Noida Expressway, Sector 129, Noida
 
Call Girls In Hari Nagar Dadb Block {8447779280}Hari Nagar {West Delhi Escort...
Call Girls In Hari Nagar Dadb Block {8447779280}Hari Nagar {West Delhi Escort...Call Girls In Hari Nagar Dadb Block {8447779280}Hari Nagar {West Delhi Escort...
Call Girls In Hari Nagar Dadb Block {8447779280}Hari Nagar {West Delhi Escort...
 
Call Girls in Noida Sector 12 Noida 💯Call Us 🔝 9582086666 🔝 South Delhi Escor...
Call Girls in Noida Sector 12 Noida 💯Call Us 🔝 9582086666 🔝 South Delhi Escor...Call Girls in Noida Sector 12 Noida 💯Call Us 🔝 9582086666 🔝 South Delhi Escor...
Call Girls in Noida Sector 12 Noida 💯Call Us 🔝 9582086666 🔝 South Delhi Escor...
 
Purva Soukhyam in Guduvancheri Chennai.pdf
Purva Soukhyam in Guduvancheri Chennai.pdfPurva Soukhyam in Guduvancheri Chennai.pdf
Purva Soukhyam in Guduvancheri Chennai.pdf
 
Call girls in new Ashok NagarDelhi꧁ 8447779280꧂ Escort Service Women Seeking ...
Call girls in new Ashok NagarDelhi꧁ 8447779280꧂ Escort Service Women Seeking ...Call girls in new Ashok NagarDelhi꧁ 8447779280꧂ Escort Service Women Seeking ...
Call girls in new Ashok NagarDelhi꧁ 8447779280꧂ Escort Service Women Seeking ...
 
:/Call Girls In Saidulajab Delhi ➥9990211544 High profile Riya Escorts In 24/...
:/Call Girls In Saidulajab Delhi ➥9990211544 High profile Riya Escorts In 24/...:/Call Girls In Saidulajab Delhi ➥9990211544 High profile Riya Escorts In 24/...
:/Call Girls In Saidulajab Delhi ➥9990211544 High profile Riya Escorts In 24/...
 
FULL ENJOY - 8264348440 Call Girls in DLf Phase 4 | Gurgaon
FULL ENJOY - 8264348440 Call Girls in DLf Phase 4 | GurgaonFULL ENJOY - 8264348440 Call Girls in DLf Phase 4 | Gurgaon
FULL ENJOY - 8264348440 Call Girls in DLf Phase 4 | Gurgaon
 
Call Girls in Noida Sector 77 Noida 💯Call Us 🔝 9582086666 🔝 South Delhi Escor...
Call Girls in Noida Sector 77 Noida 💯Call Us 🔝 9582086666 🔝 South Delhi Escor...Call Girls in Noida Sector 77 Noida 💯Call Us 🔝 9582086666 🔝 South Delhi Escor...
Call Girls in Noida Sector 77 Noida 💯Call Us 🔝 9582086666 🔝 South Delhi Escor...
 

Chicago Suburbs Office Market Remains Positive Despite Large Q1 Move-Outs

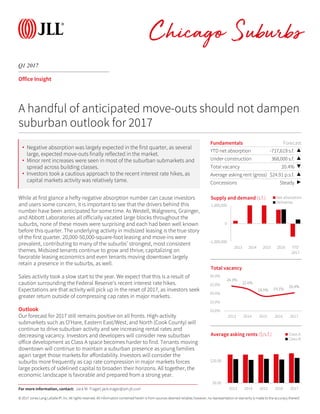
  • 1. © 2017 Jones Lang LaSalle IP, Inc. All rights reserved. All information contained herein is from sources deemed reliable; however, no representation or warranty is made to the accuracy thereof. Q1 2017 Chicago Suburbs Office Insight While at first glance a hefty negative absorption number can cause investors and users some concern, it is important to see that the drivers behind this number have been anticipated for some time. As Westell, Walgreens, Grainger, and Abbott Laboratories all officially vacated large blocks throughout the suburbs, none of these moves were surprising and each had been well known before this quarter. The underlying activity in midsized leasing is the true story of the first quarter. 20,000-50,000-square-foot leasing and move-ins were prevalent, contributing to many of the suburbs’ strongest, most consistent themes. Midsized tenants continue to grow and thrive, capitalizing on favorable leasing economics and even tenants moving downtown largely retain a presence in the suburbs, as well. Sales activity took a slow start to the year. We expect that this is a result of caution surrounding the Federal Reserve’s recent interest rate hikes. Expectations are that activity will pick up in the reset of 2017, as investors seek greater return outside of compressing cap rates in major markets. Outlook Our forecast for 2017 still remains positive on all fronts. High-activity submarkets such as O’Hare, Eastern East/West, and North (Cook County) will continue to drive suburban activity and see increasing rental rates and decreasing vacancy. Investors and developers will consider new suburban office development as Class A space becomes harder to find. Tenants moving downtown will continue to maintain a suburban presence as young families again target those markets for affordability. Investors will consider the suburbs more frequently as cap rate compression in major markets forces large pockets of sidelined capital to broaden their horizons. All together, the economic landscape is favorable and prepared from a strong year. Fundamentals Forecast YTD net absorption -717,619 s.f. ▲ Under construction 368,000 s.f. ▲ Total vacancy 20.4% ▼ Average asking rent (gross) $24.91 p.s.f. ▲ Concessions Steady ▶ -1,000,000 0 1,000,000 2013 2014 2015 2016 YTD 2017 Supply and demand (s.f.) Net absorption Deliveries A handful of anticipated move-outs should not dampen suburban outlook for 2017 24.3% 22.6% 18.5% 19.1% 20.4% 10.0% 15.0% 20.0% 25.0% 30.0% 2013 2014 2015 2016 2017 Total vacancy $0.00 $20.00 2013 2014 2015 2016 2017 Average asking rents ($/s.f.) Class A Class B For more information, contact: Jack M. Trager| jack.trager@am.jll.com • Negative absorption was largely expected in the first quarter, as several large, expected move-outs finally reflected in the market. • Minor rent increases were seen in most of the suburban submarkets and spread across building classes. • Investors took a cautious approach to the recent interest rate hikes, as capital markets activity was relatively tame.
  • 2. Chicago Q1 2017 Office Statistics Class Inventory (s.f.) Total net absorption (s.f.) YTD total net absorption (s.f.) YTD total net absorption (% of stock) Direct vacancy (%) Total vacancy (%) Average direct asking rent ($ p.s.f.) YTD completions (s.f.) Under construction (s.f.) West Loop Totals 48,606,523 512,399 512,399 1.1% 12.8% 13.8% $43.11 3,127,164 1,257,500 Central Loop Totals 37,160,358 -294,516 -294,516 -0.8% 10.1% 11.0% $37.27 0 0 East Loop Totals 24,346,395 28,129 28,129 0.1% 11.4% 11.8% $35.61 0 0 South Loop Totals 1,163,943 7,502 7,502 0.6% 2.8% 2.8% $25.92 0 2,450,000 North Michigan Avenue Totals 11,145,481 72,257 72,257 0.6% 10.1% 10.9% $38.08 0 0 River North Totals 16,330,258 5,488 5,488 0.0% 5.2% 6.1% $40.14 0 50,000 Kennedy West Totals 5,304,298 42,971 42,971 0.8% 10.9% 11.0% $32.93 0 1,057,790 Far West Loop Totals 1,709,818 -15,534 -15,534 -0.9% 13.5% 13.7% $31.47 0 0 Fulton Market Totals 2,947,999 63,879 63,879 2.2% 9.4% 9.6% $33.89 0 1,057,790 River West Totals 646,481 -5,374 -5,374 -0.8% 10.4% 10.4% $32.54 0 0 CBD Totals 144,057,256 374,230 374,230 0.3% 10.6% 11.5% $39.38 3,127,164 4,815,290 Eastern East-West Totals 22,831,285 -24,315 -24,315 -0.1% 15.2% 17.3% $25.49 228,000 0 Western East-West Totals 14,611,686 -101,272 -101,272 -0.7% 18.1% 20.3% $24.15 0 0 North (Cook County) Totals 10,217,404 -35,652 -35,652 -0.3% 15.6% 16.0% $28.22 0 0 North (Lake County) Totals 15,931,526 -430,423 -430,423 -2.7% 25.8% 26.8% $25.71 0 0 O'Hare Totals 12,393,927 -1,578 -1,578 0.0% 16.2% 16.8% $24.98 0 0 Northwest Totals 27,167,960 -124,379 -124,379 -0.5% 21.2% 22.5% $23.45 0 368,000 Suburbs Totals 103,153,788 -717,619 -717,619 -0.7% 19.0% 20.4% $24.91 228,000 368,000 Chicago Totals 247,211,044 -343,389 -343,389 -0.1% 14.1% 15.2% $31.26 3,355,164 5,183,290 West Loop A 31,957,041 471,211 471,211 1.5% 13.1% 14.1% $46.87 3,127,164 1,257,500 Central Loop A 10,191,682 -219,395 -219,395 -2.2% 10.0% 12.2% $42.55 0 0 East Loop A 5,511,381 11,050 11,050 0.2% 5.4% 5.4% $43.42 0 0 North Michigan Avenue A 2,871,938 -15,783 -15,783 -0.5% 7.9% 8.2% $38.03 0 0 River North A 8,606,690 6,134 6,134 0.1% 4.0% 4.5% $44.84 0 50,000 Kennedy West A 1,072,473 -16,381 -16,381 -1.5% 5.7% 5.7% $34.48 0 0 Far West Loop A 35,462 -21,959 -21,959 -61.9% 61.9% 61.9% $32.00 0 0 Fulton Market A 852,011 3,359 3,359 0.4% 3.0% 3.0% $38.46 0 1,057,790 River West A 185,000 2,219 2,219 1.2% 7.4% 7.4% $33.00 0 0 CBD A 60,211,205 236,836 236,836 0.4% 10.2% 11.2% $45.14 3,127,164 2,365,290 Eastern East-West A 9,728,397 25,055 25,055 0.3% 12.2% 14.7% $28.63 228,000 0 Western East-West A 5,534,716 40,877 40,877 0.7% 16.9% 19.9% $27.16 0 0 North (Cook County) A 5,446,551 -3,810 -3,810 -0.1% 19.7% 20.1% $29.69 0 0 North (Lake County) A 11,300,485 -320,224 -320,224 -2.8% 26.9% 27.9% $25.50 0 0 O'Hare A 6,732,939 12,784 12,784 0.2% 13.3% 14.2% $29.57 0 0 Northwest A 16,499,980 86,854 86,854 0.5% 14.9% 15.6% $25.62 0 368,000 Suburbs A 55,243,068 -158,464 -158,464 -0.3% 17.4% 18.7% $26.86 228,000 368,000 Chicago A 115,454,273 78,372 78,372 0.1% 13.6% 14.8% $34.00 3,355,164 2,733,290 West Loop B 14,142,482 55,811 55,811 0.4% 13.3% 14.4% $35.91 0 0 Central Loop B 22,670,390 -42,426 -42,426 -0.2% 10.1% 10.5% $35.39 0 0 East Loop B 12,342,590 80,777 80,777 0.7% 13.0% 13.8% $34.87 0 0 North Michigan Avenue B 5,699,740 4,379 4,379 0.1% 12.7% 13.8% $40.08 0 0 River North B 5,896,409 -1,201 -1,201 0.0% 7.3% 8.2% $36.44 0 0 Kennedy West B 3,195,001 59,352 59,352 1.9% 12.1% 12.2% $32.29 0 0 Far West Loop B 1,230,612 6,425 6,425 0.5% 9.9% 9.9% $31.33 0 0 Fulton Market B 1,593,724 60,520 60,520 3.8% 15.6% 15.9% $32.88 0 0 River West B 370,665 -7,593 -7,593 -2.0% 4.6% 4.6% $20.00 0 0 CBD B 63,946,612 156,692 156,692 0.2% 11.5% 12.2% $35.66 0 0 Eastern East-West B 10,609,756 -56,539 -56,539 -0.5% 17.3% 19.3% $21.78 0 0 Western East-West B 8,024,928 -135,599 -135,599 -1.7% 19.4% 21.2% $21.71 0 0 North (Cook County) B 3,956,814 -30,393 -30,393 -0.8% 11.7% 11.8% $24.74 0 0 North (Lake County) B 4,351,794 -108,645 -108,645 -2.5% 24.5% 25.3% $26.38 0 0 O'Hare B 4,218,447 -8,186 -8,186 -0.2% 21.4% 21.8% $21.67 0 0 Northwest B 8,953,234 -156,790 -156,790 -1.8% 31.8% 33.8% $21.84 0 0 Suburbs B 40,114,973 -496,152 -496,152 -1.2% 21.6% 23.1% $22.69 0 0 Chicago B 104,061,585 -339,460 -339,460 -0.3% 15.4% 16.4% $28.63 0 0
  • 3. Chicago | Office Statistics | Q1 2017 Class Inventory (s.f.) Total net absorption (s.f.) YTD total net absorption (s.f.) YTD total net absorption (% of stock) Direct vacancy (%) Total vacancy (%) Average direct asking rent ($ p.s.f.) YTD completions (s.f.) Under construction (s.f.) West Loop C 2,507,000 -14,623 -14,623 -0.6% 6.2% 7.4% $32.18 0 0 Central Loop C 4,298,286 -32,695 -32,695 -0.8% 10.1% 11.0% $32.21 0 0 East Loop C 6,492,424 -63,698 -63,698 -1.0% 13.4% 13.5% $30.27 0 0 South Loop C 1,163,943 7,502 7,502 0.6% 2.8% 2.8% $25.92 0 2,450,000 North Michigan Avenue C 2,573,803 83,661 83,661 3.3% 6.8% 7.2% $32.76 0 0 River North C 1,827,159 555 555 0.0% 4.0% 6.8% $31.05 0 0 Kennedy West C 1,036,824 0 0 0.0% 12.5% 12.7% $33.53 0 0 Far West Loop C 443,744 0 0 0.0% 19.9% 20.3% $31.59 0 0 Fulton Market C 502,264 0 0 0.0% 1.0% 1.0% $35.80 0 0 River West C 90,816 0 0 0.0% 39.9% 39.9% $32.33 0 0 CBD C 19,899,439 -26,800 -26,800 -0.1% 9.4% 10.1% $31.20 0 2,450,000 Eastern East-West C 2,493,132 7,169 7,169 0.3% 18.1% 18.7% $15.96 0 0 Western East-West C 1,052,042 -6,550 -6,550 -0.6% 15.0% 15.0% $15.43 0 0 North (Cook County) C 814,039 -1,449 -1,449 -0.2% 7.2% 9.4% $18.50 0 0 North (Lake County) C 279,247 -1,554 -1,554 -0.6% 2.7% 2.7% N/A 0 0 O'Hare C 1,442,541 -6,176 -6,176 -0.4% 14.4% 14.4% $15.28 0 0 Northwest C 1,714,746 -54,443 -54,443 -3.2% 26.2% 29.6% $17.83 0 0 Suburbs C 7,795,747 -63,003 -63,003 -0.8% 17.1% 18.3% $16.81 0 0 Chicago C 27,695,186 -89,803 -89,803 -0.3% 11.6% 12.4% $25.20 0 2,450,000 Hailey Harrington | Research Manager 200 E Randolph Street Chicago, IL 60601 | tel +1 312 228 3189 | hailey.harrington@am.jll.com 2017 Jones Lang LaSalle IP, Inc. All rights reserved.