
Recomendados
Mais conteúdo relacionado
Destaque
Destaque (10)
Semelhante a Unit 1: Economy Activities
Semelhante a Unit 1: Economy Activities (20)
Mais de Gema
Mais de Gema (20)
Último
Último (20)
Unit 1: Economy Activities
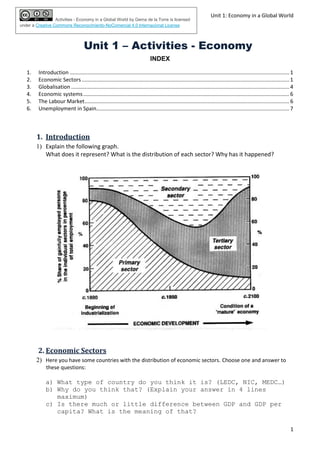
- 1. Unit 1: Economy in a Global World 1 Activities - Economy in a Global World by Gema de la Torre is licensed under a Creative Commons Reconocimiento-NoComercial 4.0 Internacional License Unit 1 – Activities - Economy INDEX 1. Introduction ....................................................................................................................................................1 2. Economic Sectors............................................................................................................................................1 3. Globalisation ...................................................................................................................................................4 4. Economic systems...........................................................................................................................................6 5. The Labour Market..........................................................................................................................................6 6. Unemployment in Spain..................................................................................................................................7 1. Introduction 1) Explain the following graph. What does it represent? What is the distribution of each sector? Why has it happened? 2. Economic Sectors 2) Here you have some countries with the distribution of economic sectors. Choose one and answer to these questions: a) What type of country do you think it is? (LEDC, NIC, MEDC…) b) Why do you think that? (Explain your answer in 4 lines maximum) c) Is there much or little difference between GDP and GDP per capita? What is the meaning of that? d) Explain the employment structures and its distribution in the three different sectors? e) Compare the GDP per economic sectors and Labour force by sectors. Is there much difference? Explain this difference. Country Nº GDP GDP per capita GDP per economic Sectors Labour force by sectors Spain -0- 0 $1.572 trillion (2014 est.) Position: 17 $33,800 (2014 est.) Position: 54 agriculture: 2.5% industry: 23.1% services: 74.4% (2014 est.) agriculture: 2.9% industry: 15% services: 58.4% (2014 est.)
- 2. Unit 1: Economy in a Global World 2 Activities - Economy in a Global World by Gema de la Torre is licensed under a Creative Commons Reconocimiento-NoComercial 4.0 Internacional License Nº GDP GDP per capita GDP per economic Sectors Labour force by sectors 1 $181.2 billion (2014 est.) Position: 64 $11,300 (2014 est.) Position: 128 agriculture: 6% industry: 34.3% services: 59.7% (2014 est.) agriculture: 27.8% industry: 17.8% services: 54.4% (2012) Nº GDP GDP per capita GDP per economic Sectors Labour force by sectors 2 $540.9 billion (2014 est.) Position: 35 $17,800 (2014 est.) Position: 95 agriculture: 3.6% industry: 33.4% services: 63% (2014 est.) agriculture: 7.3% industry: 21.8% services: 70.9% (4th quarter, 2011 est.) Nº GDP GDP per capita GDP per economic Sectors Labour force by sectors 3 $372.7 billion (2014 est.) Position: 48 $11,900 (2014 est.) Position: 124 agriculture: 7% industry: 35.5% services: 57.5% (2014 est.) agriculture: 25.8% industry: 17.4% services: 56.8% (2011) Nº GDP GDP per capita GDP per economic Sectors Labour force by sectors 4 $18.38 billion (2014 est.) Position: 147 $1,800 (2014 est.) Position: 207 agriculture: 23.4% industry: 19.8% services: 56.8% (2014 est.) agriculture: 38.1% industry: 11.5% services: 50.4% (2010) Nº GDP GDP per capita GDP per economic Sectors Labour force by sectors 5 $24.1 billion (2014 est.) Position: 136 $8,600 (2014 est.) Position: 141 agriculture: 6.9% industry: 21.2% services: 72% (2014 est.) agriculture: 17% industry: 19% services: 64% (2006) Nº GDP GDP per capita GDP per economic Sectors Labour force by sectors 6 $259.2 billion (2014 est.) Position: 57 $7,800 (2014 est.) Position: 148 agriculture: 13% industry: 29.3% services: 57.7% (2014 est.) agriculture: 39.1% industry: 20.3% services: 40.5% (2014 est.) Nº GDP GDP per capita GDP per economic Sectors Labour force by sectors 7 $29.42 billion (2014 est.) Position: 128 $1,700 (2014 est.) Position: 212 agriculture: 22.4% industry: 26% services: 51.6% (2014 est.) agriculture: 90% industry and services: 10% (2000 est.) Nº GDP GDP per capita GDP per economic Sectors Labour force by sectors 8 $5.896 billion (2010 est.) Position: 169 $600 (2010 est.) Position: 229 agriculture: 60.2% industry: 7.4% services: 32.5% (2013 est.) agriculture: 71% industry and services: 29% (1975)
- 3. Unit 1: Economy in a Global World 3 Activities - Economy in a Global World by Gema de la Torre is licensed under a Creative Commons Reconocimiento-NoComercial 4.0 Internacional License Nº GDP GDP per capita GDP per economic Sectors Labour force by sectors 9 $1.357 trillion (2014 est.) Position: 19 $17,400 (2014 est.) Position: 96 agriculture: 9.2% industry: 37.7% services: 53.1% (2014 est.) agriculture: 16.3% industry: 35.1% services: 48.6% (2013 est.) Nº GDP GDP per capita GDP per economic Sectors Labour force by sectors 10 $2.686 trillion (2014 est.) Position: 9 $10,700 (2014 est.) Position: 131 agriculture: 13.7% industry: 42.9% services: 43.3% (2014 est.) agriculture: 38.9% industry: 13.2% services: 47.9% (2012 est.) Nº GDP GDP per capita GDP per economic Sectors Labour force by sectors 11 $4.767 trillion (2014 est.) Position: 5 $37,500 (2014 est.) Position: 44 agriculture: 1.2% industry: 26.8% services: 72% (2014 est.) agriculture: 2.9% industry: 26.2% services: 70.9% (February 2015 est.) Nº GDP GDP per capita GDP per economic Sectors Labour force by sectors 12 $18.09 trillion (2014 est.) Position: 2 $13,200 (2014 est.) Position: 117 agriculture: 9.2% industry: 42.7% services: 48.1% (2014 est.) agriculture: 33.6% industry: 30.3% services: 36.1% (2012 est.) Nº GDP GDP per capita GDP per economic Sectors Labour force by sectors 13 $420 billion (2014 est.) Position: 43 $24,100 (2014 est.) Position: 76 agriculture: 4.7% industry: 36% services: 59.3% (2014 est.) agriculture: 25.8% industry: 11.9% services: 62.3% (2012) Nº GDP GDP per capita GDP per economic Sectors Labour force by sectors 14 $17.35 trillion (2014 est.) Position: 3 $54,400 (2014 est.) Position: 19 agriculture: 1.6% industry: 20.6% services: 77.8% (2014 est.) farming, forestry, and fishing: 0.7% manufacturing, extraction, transportation, and crafts: 20.3% managerial, professional, and technical: 37.3% sales and office: 24.2% other services: 17.6% Nº GDP GDP per capita GDP per economic Sectors Labour force by sectors 15 $2.149 trillion (2014 est.) Position: 12 $18,000 (2014 est.) Position: 92 agriculture: 3.5% industry: 33.8% services: 62.7% (2014 est.) agriculture: 13.4% industry: 24.1% services: 61.9% (2011)
- 4. Unit 1: Economy in a Global World 4 Activities - Economy in a Global World by Gema de la Torre is licensed under a Creative Commons Reconocimiento-NoComercial 4.0 Internacional License List of countries (Activity #2) 1 – Ecuador 2 - Venezuela 3 - Perú 4 -Haití 5 - Jamaica 6 - Morocco 7 – Burkina Faso 8 - Somalia 9 – Irán 10 - Indonesia 11 – Japan 12 – China 13 – Kazakhstan 14 – USA 15 - Mexico 3. Globalisation 3) Analysis of an image. Here you have the different steps that you have to follow for a fantastic analysis and some useful vocabulary.
- 5. Unit 1: Economy in a Global World 5 Activities - Economy in a Global World by Gema de la Torre is licensed under a Creative Commons Reconocimiento-NoComercial 4.0 Internacional License Analysis of an image 1) Description (or Analysis): describe the image from the general to the particular, paying special attention to the geographical characteristics. You can use the following vocabulary: - It is a photograph, a map, a plan, a diagram, a pie diagram, a bar diagram, a cartoon, a drawing… - At the top, at the bottom, in the middle, at the background, at the foreground… 2) Short deduction: you have to deduce what is the topic (or subject) of the image. It’s just two lines (you only have to deduce the main topic). You can use this type of introductions: - Because of all these characteristics I can deduce that this image represents the …… - Due to all of these elements I can say, suppose, figure out, assume… that it is a … 3) Commentary: here you have to explain the characteristics of the subject, but always paying attention to the image. The image is the tool that is going to lead your commentary. First mention the characteristics or the subject that the image has suggested you (and don’t forget to explain that connection). Secondly explain other characteristics of the subject that are not in the image but that you know. 4) Conclusion: At the end you can write things such as: Your personal opinion Consequences Environmental problems…. Some Key Vocabulary For describing what you see: I see, I can see, I observe, I notice... For locating items in the photograph: In the foreground (en primer plano), in the background (al fondo), at the upper left corner, at the upper right corner, at the lower right corner, at the lower left corner, at the left, at the right, at the top, at the bottom... For deductions: I deduce, I assume, I figure out, I suppose, I infer, I understand... For the causes: this situation is caused/produced/provoked/generated/created by For the consequences: Because of this/that, for this reason, as a result, therefore (por tanto), in consequence, consequently, so.... Giving your opinion: I think, In my opinion, In my view, To my mind, As far as I am concerned..... Concluding: In conclusion, To conclude, To summarise...
- 6. Unit 1: Economy in a Global World 6 Activities - Economy in a Global World by Gema de la Torre is licensed under a Creative Commons Reconocimiento-NoComercial 4.0 Internacional License 4. Economic systems 4) Fill this table with the correct information. (Write full sentences in the table and you will have a powerful tool for studying). Communist System Capitalist System Keynesian System Neoliberal System Other name: When did it appear? Means of production: Objective: Countries: 5. The Labour Market 5) Fill the table with the correct information. 6) Calculate the activity rate and unemployment rate of the following two countries for the year 2014. Total Population Active Population Activity Rate Unemployment rate Belgium 11 237 000 4 975 260 8,5% Morocco 32 987 206 12 498 270 9,5 % Romania 21 729 871 9 302 000 7,3 % Total Population __________________________ ___________________________ Definition:Definition: . . . . . . .
- 7. Unit 1: Economy in a Global World 7 Activities - Economy in a Global World by Gema de la Torre is licensed under a Creative Commons Reconocimiento-NoComercial 4.0 Internacional License 7) What country has the highest activity rate? ____________________ 8) What country has the lowest activity rate? _____________________ 9) Does the activity rate show only the people that are working or also other people? Explain your answer. 10)Does the emigration affect the activity rate or the country of origin? Does it increase or decrease? (Explain why). 11)Does the immigration affect the activity rate or the country of destination? Does it increase or decrease? (Explain why). 6. Unemployment in Spain If you want to know more about this topic you can read the following link: http://www.elespanol.com/economia/macroeconomia/20160904/152985137_0.html 12)Explain the following diagram in a writing composition. What does it represent? The data (is it a total amount or a percentage, it increases or decreases, maximum and minimum data…) Possible causes. Possible consequences Personal opinion