SlideShare uma empresa Scribd logo
1 de 7
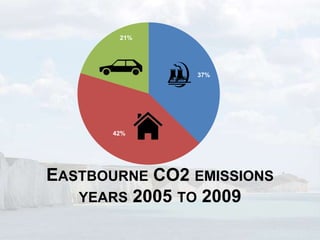
21%


               37%


       42%


EASTBOURNE CO2 EMISSIONS
   YEARS 2005 TO 2009
Eastbourne CO2 emissions years 2005 to 2009
                             Kilotonnes CO2                                                      Tonnes per person
         600                                                                         9
                                                                                     8
         500                                                                         7
                                                                                     6
         400                                               Road Transport


                                                                             t CO2
                                                                                     5                                             Eastbourne
Kt CO2


         300                                                                         4                                             England Total
                                                           Domestic
                                                                                     3
                                                                                                                                   South East Total
         200                                                                         2
                                                           Industry and
                                                           Commercial                1
         100
                                                                                     0
             -                                                                           Yr 2005 Yr 2006 Yr 2007 Yr 2008 Yr 2009
                 Yr 2005 Yr 2006 Yr 2007 Yr 2008 Yr 2009


                                                                                               How does this compare to UK
                                                           Eastbourne
                                                                                                 •
                                                                                                   wide data in 2009?
                    The number of tonnes                                                               43 per cent of end-user emissions
         1          per person per year to                                                             assigned to local authority areas
                                                           21%
                    stabilise climate change                                                           were attributed to the industry and
                                                                            37%                        commercial sector,
                     The number of tonnes                                                        •     30 per cent to the domestic sector
  4.63
                     per person per year                                                         •     27 per cent to road transport.
                     emitted by                                                               There are wide local variations on this mainly
                                                           42%
                     Eastbourne residents                                                     because of the economy and geography of
                                                                                              different local areas.
Eastbourne per capita emissions
                                                   2.5


                 Industry and Commercial
                 Domestic                          2.0

                 Road Transport


                                                   1.5


       The number of tonnes per            t CO2   1.0
 1     person per year to stabilise
       climate change

                                                   0.5
        The number of tonnes per
4.63    person per year emitted by
        Eastbourne residents (2009)
                                                    -
                                                         Yr 2005   Yr 2006   Yr 2007   Yr 2008   Yr 2009
Road transport: Eastbourne per capita emissions
                                 compared to England and South East
                            3
                                                                                   Road transport emissions include
                                                                                   both      freight     and     passenger
                           2.5
                                                                                   transport, both private and for
                                                                                   business purposes. The estimates
                            2                                                      are made on the basis of the
                                                                                   distribution of traffic. This means that
                   t CO2


Eastbourne                                                                         some of the emissions within an
                           1.5
England Total                                                                      authority represent through traffic, or
South East Total                                                                   part of trips into or out of the area
                            1
                                                                                   whether by residents or non-
                                                                                   residents.
                           0.5


                            0
                                 Yr 2005   Yr 2006   Yr 2007   Yr 2008   yr 2009
Domestic CO2 emissions: Eastbourne
                                  compared to England, South East
                            3
                                                                                   National picture: In 2009, about 47 per
                           2.5                                                     cent of domestic end-user emissions
                                                                                   arose from gas use, 42 per cent from
                                                                                   electricity, and 10 per cent from
                            2
                                                                                   consumption of other fuels. Between
                                                                                   2005 and 2009, there was a decrease
                   t CO2


Eastbourne
                           1.5                                                     in domestic gas consumption of 16%.
England Total
South East Total
                            1


                           0.5


                            0
                                 Yr 2005   Yr 2006   Yr 2007   Yr 2008   yr 2009
Industry and Commercial CO2 emissions:
         Eastbourne compared to England, South East
                            4

                           3.5
                                                                                   National picture: the industry and
                            3                                                      commercial sector had the highest
                           2.5
                                                                                   share of end-user emissions in 43 per
                                                                                   cent of authorities. The domestic sector
                   t CO2


Eastbourne
                            2                                                      the highest share in 32 per cent, and
England Total
                                                                                   the road transport sector had the
South East Total           1.5
                                                                                   highest share in 25 per cent of
                            1                                                      authorities.

                           0.5

                            0
                                 Yr 2005   Yr 2006   Yr 2007   Yr 2008   yr 2009
Slideshow by Gavin Barker
                                               KEY SOURCES
                                                Click to access source
                                                Dept of Energy and Climate
                                                Change
                                                Local authority subset data


YOU ARE WELCOME TO USE THIS SLIDESHOW TO EMBED IN
YOUR OWN BLOG OR WEBSITE


If you choose to amend or add to this presentation, please delete my name and delete the
background picture for this slideshow (go to View>Slidemaster on the toolbar to replace
slide background with your own image )

Mais conteúdo relacionado

Destaque

Tvantage Suite Overview
Tvantage Suite OverviewTvantage Suite Overview
Tvantage Suite Overviewphauenst
 
Blogpresentation
BlogpresentationBlogpresentation
Blogpresentationguest7e537a
 
East Sussex Local Economy
East Sussex Local EconomyEast Sussex Local Economy
East Sussex Local EconomyGavin Barker
 
indices of Deprivation
indices of Deprivationindices of Deprivation
indices of DeprivationGavin Barker
 
Netbooks In K12 Education
Netbooks In K12 EducationNetbooks In K12 Education
Netbooks In K12 Educationmarylasica2
 
Local Money Multiplier (LM3)
Local Money Multiplier (LM3)Local Money Multiplier (LM3)
Local Money Multiplier (LM3)Gavin Barker
 
Storylining for Strategic Analysis
Storylining for Strategic AnalysisStorylining for Strategic Analysis
Storylining for Strategic AnalysisArvinda Kumar
 
IMD data for East Sussex
IMD data for East SussexIMD data for East Sussex
IMD data for East SussexGavin Barker
 
Retention And Turnover
Retention  And TurnoverRetention  And Turnover
Retention And Turnoverphauenst
 
Gross National Product
Gross National ProductGross National Product
Gross National ProductArvinda Kumar
 

Destaque (13)

Tvantage Suite Overview
Tvantage Suite OverviewTvantage Suite Overview
Tvantage Suite Overview
 
Candidate replies
Candidate repliesCandidate replies
Candidate replies
 
Blogpresentation
BlogpresentationBlogpresentation
Blogpresentation
 
Mod7 Lab Howard
Mod7 Lab HowardMod7 Lab Howard
Mod7 Lab Howard
 
East Sussex Local Economy
East Sussex Local EconomyEast Sussex Local Economy
East Sussex Local Economy
 
indices of Deprivation
indices of Deprivationindices of Deprivation
indices of Deprivation
 
Who Pays?
Who Pays?Who Pays?
Who Pays?
 
Netbooks In K12 Education
Netbooks In K12 EducationNetbooks In K12 Education
Netbooks In K12 Education
 
Local Money Multiplier (LM3)
Local Money Multiplier (LM3)Local Money Multiplier (LM3)
Local Money Multiplier (LM3)
 
Storylining for Strategic Analysis
Storylining for Strategic AnalysisStorylining for Strategic Analysis
Storylining for Strategic Analysis
 
IMD data for East Sussex
IMD data for East SussexIMD data for East Sussex
IMD data for East Sussex
 
Retention And Turnover
Retention  And TurnoverRetention  And Turnover
Retention And Turnover
 
Gross National Product
Gross National ProductGross National Product
Gross National Product
 

Semelhante a Eastbourne CO2 emissions

CO2 emissions for Brighton and Hove
CO2  emissions for Brighton and Hove CO2  emissions for Brighton and Hove
CO2 emissions for Brighton and Hove Gavin Barker
 
Vanessa Haverd_Multiple observation types reduce uncertainty in Australia's t...
Vanessa Haverd_Multiple observation types reduce uncertainty in Australia's t...Vanessa Haverd_Multiple observation types reduce uncertainty in Australia's t...
Vanessa Haverd_Multiple observation types reduce uncertainty in Australia's t...TERN Australia
 
An easily traceable scenario for GHG 80% reduction in Japan for local energy ...
An easily traceable scenario for GHG 80% reduction in Japan for local energy ...An easily traceable scenario for GHG 80% reduction in Japan for local energy ...
An easily traceable scenario for GHG 80% reduction in Japan for local energy ...Masayuki Horio
 
The Post-2020 Cost- Competitiveness of CCS
The Post-2020 Cost- Competitiveness of CCSThe Post-2020 Cost- Competitiveness of CCS
The Post-2020 Cost- Competitiveness of CCScanaleenergia
 
Water footprint for mining in South Africa
Water footprint for mining in South AfricaWater footprint for mining in South Africa
Water footprint for mining in South AfricaKate Laing
 
Philippe Joubert Alstom CCS presentation
Philippe Joubert Alstom CCS presentationPhilippe Joubert Alstom CCS presentation
Philippe Joubert Alstom CCS presentationGlobal CCS Institute
 

Semelhante a Eastbourne CO2 emissions (10)

CO2 emissions for Brighton and Hove
CO2  emissions for Brighton and Hove CO2  emissions for Brighton and Hove
CO2 emissions for Brighton and Hove
 
Vanessa Haverd_Multiple observation types reduce uncertainty in Australia's t...
Vanessa Haverd_Multiple observation types reduce uncertainty in Australia's t...Vanessa Haverd_Multiple observation types reduce uncertainty in Australia's t...
Vanessa Haverd_Multiple observation types reduce uncertainty in Australia's t...
 
An easily traceable scenario for GHG 80% reduction in Japan for local energy ...
An easily traceable scenario for GHG 80% reduction in Japan for local energy ...An easily traceable scenario for GHG 80% reduction in Japan for local energy ...
An easily traceable scenario for GHG 80% reduction in Japan for local energy ...
 
2009-08-28 City Operations: Energy Use and Emissions
2009-08-28 City Operations: Energy Use and Emissions2009-08-28 City Operations: Energy Use and Emissions
2009-08-28 City Operations: Energy Use and Emissions
 
EPA: Greenhouse Gas Emissions and the Transport Sector - Laura Burke
EPA: Greenhouse Gas Emissions and the Transport Sector - Laura BurkeEPA: Greenhouse Gas Emissions and the Transport Sector - Laura Burke
EPA: Greenhouse Gas Emissions and the Transport Sector - Laura Burke
 
מצגת אלה נווה עכברים ואנשים Pdf
מצגת אלה נווה עכברים ואנשים Pdfמצגת אלה נווה עכברים ואנשים Pdf
מצגת אלה נווה עכברים ואנשים Pdf
 
The Post-2020 Cost- Competitiveness of CCS
The Post-2020 Cost- Competitiveness of CCSThe Post-2020 Cost- Competitiveness of CCS
The Post-2020 Cost- Competitiveness of CCS
 
Water footprint for mining in South Africa
Water footprint for mining in South AfricaWater footprint for mining in South Africa
Water footprint for mining in South Africa
 
Philippe Joubert Alstom CCS presentation
Philippe Joubert Alstom CCS presentationPhilippe Joubert Alstom CCS presentation
Philippe Joubert Alstom CCS presentation
 
Zinc millennium map
Zinc millennium mapZinc millennium map
Zinc millennium map
 

Mais de Gavin Barker

A People's Constitution
A People's ConstitutionA People's Constitution
A People's ConstitutionGavin Barker
 
Our NHS - Key facts
Our NHS - Key factsOur NHS - Key facts
Our NHS - Key factsGavin Barker
 
Community currencies
Community currenciesCommunity currencies
Community currenciesGavin Barker
 
East Sussex Health & Social Inequalities
East Sussex Health & Social InequalitiesEast Sussex Health & Social Inequalities
East Sussex Health & Social InequalitiesGavin Barker
 
Spirit level-slides-from-the-equality-trust
Spirit level-slides-from-the-equality-trustSpirit level-slides-from-the-equality-trust
Spirit level-slides-from-the-equality-trustGavin Barker
 
Brighton & Hove local economy
Brighton & Hove local economyBrighton & Hove local economy
Brighton & Hove local economyGavin Barker
 
Health inequalities - Brighton
Health inequalities - BrightonHealth inequalities - Brighton
Health inequalities - BrightonGavin Barker
 
How wealth affects health
How wealth affects healthHow wealth affects health
How wealth affects healthGavin Barker
 
Community enterprise toolkit
Community enterprise toolkitCommunity enterprise toolkit
Community enterprise toolkitGavin Barker
 
Health Deprivation mapped
Health Deprivation mappedHealth Deprivation mapped
Health Deprivation mappedGavin Barker
 
Mapping deprivation and co-production
Mapping deprivation and co-productionMapping deprivation and co-production
Mapping deprivation and co-productionGavin Barker
 
Migration to the UK 2010
Migration to the UK 2010Migration to the UK 2010
Migration to the UK 2010Gavin Barker
 

Mais de Gavin Barker (12)

A People's Constitution
A People's ConstitutionA People's Constitution
A People's Constitution
 
Our NHS - Key facts
Our NHS - Key factsOur NHS - Key facts
Our NHS - Key facts
 
Community currencies
Community currenciesCommunity currencies
Community currencies
 
East Sussex Health & Social Inequalities
East Sussex Health & Social InequalitiesEast Sussex Health & Social Inequalities
East Sussex Health & Social Inequalities
 
Spirit level-slides-from-the-equality-trust
Spirit level-slides-from-the-equality-trustSpirit level-slides-from-the-equality-trust
Spirit level-slides-from-the-equality-trust
 
Brighton & Hove local economy
Brighton & Hove local economyBrighton & Hove local economy
Brighton & Hove local economy
 
Health inequalities - Brighton
Health inequalities - BrightonHealth inequalities - Brighton
Health inequalities - Brighton
 
How wealth affects health
How wealth affects healthHow wealth affects health
How wealth affects health
 
Community enterprise toolkit
Community enterprise toolkitCommunity enterprise toolkit
Community enterprise toolkit
 
Health Deprivation mapped
Health Deprivation mappedHealth Deprivation mapped
Health Deprivation mapped
 
Mapping deprivation and co-production
Mapping deprivation and co-productionMapping deprivation and co-production
Mapping deprivation and co-production
 
Migration to the UK 2010
Migration to the UK 2010Migration to the UK 2010
Migration to the UK 2010
 

Último

Third Battle of Panipat detailed notes.pptx
Third Battle of Panipat detailed notes.pptxThird Battle of Panipat detailed notes.pptx
Third Battle of Panipat detailed notes.pptxAmita Gupta
 
Micro-Scholarship, What it is, How can it help me.pdf
Micro-Scholarship, What it is, How can it help me.pdfMicro-Scholarship, What it is, How can it help me.pdf
Micro-Scholarship, What it is, How can it help me.pdfPoh-Sun Goh
 
Sociology 101 Demonstration of Learning Exhibit
Sociology 101 Demonstration of Learning ExhibitSociology 101 Demonstration of Learning Exhibit
Sociology 101 Demonstration of Learning Exhibitjbellavia9
 
Holdier Curriculum Vitae (April 2024).pdf
Holdier Curriculum Vitae (April 2024).pdfHoldier Curriculum Vitae (April 2024).pdf
Holdier Curriculum Vitae (April 2024).pdfagholdier
 
microwave assisted reaction. General introduction
microwave assisted reaction. General introductionmicrowave assisted reaction. General introduction
microwave assisted reaction. General introductionMaksud Ahmed
 
Dyslexia AI Workshop for Slideshare.pptx
Dyslexia AI Workshop for Slideshare.pptxDyslexia AI Workshop for Slideshare.pptx
Dyslexia AI Workshop for Slideshare.pptxcallscotland1987
 
1029 - Danh muc Sach Giao Khoa 10 . pdf
1029 -  Danh muc Sach Giao Khoa 10 . pdf1029 -  Danh muc Sach Giao Khoa 10 . pdf
1029 - Danh muc Sach Giao Khoa 10 . pdfQucHHunhnh
 
Food safety_Challenges food safety laboratories_.pdf
Food safety_Challenges food safety laboratories_.pdfFood safety_Challenges food safety laboratories_.pdf
Food safety_Challenges food safety laboratories_.pdfSherif Taha
 
Application orientated numerical on hev.ppt
Application orientated numerical on hev.pptApplication orientated numerical on hev.ppt
Application orientated numerical on hev.pptRamjanShidvankar
 
Spellings Wk 3 English CAPS CARES Please Practise
Spellings Wk 3 English CAPS CARES Please PractiseSpellings Wk 3 English CAPS CARES Please Practise
Spellings Wk 3 English CAPS CARES Please PractiseAnaAcapella
 
1029-Danh muc Sach Giao Khoa khoi 6.pdf
1029-Danh muc Sach Giao Khoa khoi  6.pdf1029-Danh muc Sach Giao Khoa khoi  6.pdf
1029-Danh muc Sach Giao Khoa khoi 6.pdfQucHHunhnh
 
Unit-IV- Pharma. Marketing Channels.pptx
Unit-IV- Pharma. Marketing Channels.pptxUnit-IV- Pharma. Marketing Channels.pptx
Unit-IV- Pharma. Marketing Channels.pptxVishalSingh1417
 
Magic bus Group work1and 2 (Team 3).pptx
Magic bus Group work1and 2 (Team 3).pptxMagic bus Group work1and 2 (Team 3).pptx
Magic bus Group work1and 2 (Team 3).pptxdhanalakshmis0310
 
Basic Civil Engineering first year Notes- Chapter 4 Building.pptx
Basic Civil Engineering first year Notes- Chapter 4 Building.pptxBasic Civil Engineering first year Notes- Chapter 4 Building.pptx
Basic Civil Engineering first year Notes- Chapter 4 Building.pptxDenish Jangid
 
How to Create and Manage Wizard in Odoo 17
How to Create and Manage Wizard in Odoo 17How to Create and Manage Wizard in Odoo 17
How to Create and Manage Wizard in Odoo 17Celine George
 
SOC 101 Demonstration of Learning Presentation
SOC 101 Demonstration of Learning PresentationSOC 101 Demonstration of Learning Presentation
SOC 101 Demonstration of Learning Presentationcamerronhm
 
Python Notes for mca i year students osmania university.docx
Python Notes for mca i year students osmania university.docxPython Notes for mca i year students osmania university.docx
Python Notes for mca i year students osmania university.docxRamakrishna Reddy Bijjam
 
Kodo Millet PPT made by Ghanshyam bairwa college of Agriculture kumher bhara...
Kodo Millet  PPT made by Ghanshyam bairwa college of Agriculture kumher bhara...Kodo Millet  PPT made by Ghanshyam bairwa college of Agriculture kumher bhara...
Kodo Millet PPT made by Ghanshyam bairwa college of Agriculture kumher bhara...pradhanghanshyam7136
 
Making communications land - Are they received and understood as intended? we...
Making communications land - Are they received and understood as intended? we...Making communications land - Are they received and understood as intended? we...
Making communications land - Are they received and understood as intended? we...Association for Project Management
 

Último (20)

Third Battle of Panipat detailed notes.pptx
Third Battle of Panipat detailed notes.pptxThird Battle of Panipat detailed notes.pptx
Third Battle of Panipat detailed notes.pptx
 
Micro-Scholarship, What it is, How can it help me.pdf
Micro-Scholarship, What it is, How can it help me.pdfMicro-Scholarship, What it is, How can it help me.pdf
Micro-Scholarship, What it is, How can it help me.pdf
 
Sociology 101 Demonstration of Learning Exhibit
Sociology 101 Demonstration of Learning ExhibitSociology 101 Demonstration of Learning Exhibit
Sociology 101 Demonstration of Learning Exhibit
 
Holdier Curriculum Vitae (April 2024).pdf
Holdier Curriculum Vitae (April 2024).pdfHoldier Curriculum Vitae (April 2024).pdf
Holdier Curriculum Vitae (April 2024).pdf
 
microwave assisted reaction. General introduction
microwave assisted reaction. General introductionmicrowave assisted reaction. General introduction
microwave assisted reaction. General introduction
 
Dyslexia AI Workshop for Slideshare.pptx
Dyslexia AI Workshop for Slideshare.pptxDyslexia AI Workshop for Slideshare.pptx
Dyslexia AI Workshop for Slideshare.pptx
 
1029 - Danh muc Sach Giao Khoa 10 . pdf
1029 -  Danh muc Sach Giao Khoa 10 . pdf1029 -  Danh muc Sach Giao Khoa 10 . pdf
1029 - Danh muc Sach Giao Khoa 10 . pdf
 
Food safety_Challenges food safety laboratories_.pdf
Food safety_Challenges food safety laboratories_.pdfFood safety_Challenges food safety laboratories_.pdf
Food safety_Challenges food safety laboratories_.pdf
 
Application orientated numerical on hev.ppt
Application orientated numerical on hev.pptApplication orientated numerical on hev.ppt
Application orientated numerical on hev.ppt
 
Spellings Wk 3 English CAPS CARES Please Practise
Spellings Wk 3 English CAPS CARES Please PractiseSpellings Wk 3 English CAPS CARES Please Practise
Spellings Wk 3 English CAPS CARES Please Practise
 
1029-Danh muc Sach Giao Khoa khoi 6.pdf
1029-Danh muc Sach Giao Khoa khoi  6.pdf1029-Danh muc Sach Giao Khoa khoi  6.pdf
1029-Danh muc Sach Giao Khoa khoi 6.pdf
 
Mehran University Newsletter Vol-X, Issue-I, 2024
Mehran University Newsletter Vol-X, Issue-I, 2024Mehran University Newsletter Vol-X, Issue-I, 2024
Mehran University Newsletter Vol-X, Issue-I, 2024
 
Unit-IV- Pharma. Marketing Channels.pptx
Unit-IV- Pharma. Marketing Channels.pptxUnit-IV- Pharma. Marketing Channels.pptx
Unit-IV- Pharma. Marketing Channels.pptx
 
Magic bus Group work1and 2 (Team 3).pptx
Magic bus Group work1and 2 (Team 3).pptxMagic bus Group work1and 2 (Team 3).pptx
Magic bus Group work1and 2 (Team 3).pptx
 
Basic Civil Engineering first year Notes- Chapter 4 Building.pptx
Basic Civil Engineering first year Notes- Chapter 4 Building.pptxBasic Civil Engineering first year Notes- Chapter 4 Building.pptx
Basic Civil Engineering first year Notes- Chapter 4 Building.pptx
 
How to Create and Manage Wizard in Odoo 17
How to Create and Manage Wizard in Odoo 17How to Create and Manage Wizard in Odoo 17
How to Create and Manage Wizard in Odoo 17
 
SOC 101 Demonstration of Learning Presentation
SOC 101 Demonstration of Learning PresentationSOC 101 Demonstration of Learning Presentation
SOC 101 Demonstration of Learning Presentation
 
Python Notes for mca i year students osmania university.docx
Python Notes for mca i year students osmania university.docxPython Notes for mca i year students osmania university.docx
Python Notes for mca i year students osmania university.docx
 
Kodo Millet PPT made by Ghanshyam bairwa college of Agriculture kumher bhara...
Kodo Millet  PPT made by Ghanshyam bairwa college of Agriculture kumher bhara...Kodo Millet  PPT made by Ghanshyam bairwa college of Agriculture kumher bhara...
Kodo Millet PPT made by Ghanshyam bairwa college of Agriculture kumher bhara...
 
Making communications land - Are they received and understood as intended? we...
Making communications land - Are they received and understood as intended? we...Making communications land - Are they received and understood as intended? we...
Making communications land - Are they received and understood as intended? we...
 

Eastbourne CO2 emissions

  • 1. 21% 37% 42% EASTBOURNE CO2 EMISSIONS YEARS 2005 TO 2009
  • 2. Eastbourne CO2 emissions years 2005 to 2009 Kilotonnes CO2 Tonnes per person 600 9 8 500 7 6 400 Road Transport t CO2 5 Eastbourne Kt CO2 300 4 England Total Domestic 3 South East Total 200 2 Industry and Commercial 1 100 0 - Yr 2005 Yr 2006 Yr 2007 Yr 2008 Yr 2009 Yr 2005 Yr 2006 Yr 2007 Yr 2008 Yr 2009 How does this compare to UK Eastbourne • wide data in 2009? The number of tonnes 43 per cent of end-user emissions 1 per person per year to assigned to local authority areas 21% stabilise climate change were attributed to the industry and 37% commercial sector, The number of tonnes • 30 per cent to the domestic sector 4.63 per person per year • 27 per cent to road transport. emitted by There are wide local variations on this mainly 42% Eastbourne residents because of the economy and geography of different local areas.
  • 3. Eastbourne per capita emissions 2.5 Industry and Commercial Domestic 2.0 Road Transport 1.5 The number of tonnes per t CO2 1.0 1 person per year to stabilise climate change 0.5 The number of tonnes per 4.63 person per year emitted by Eastbourne residents (2009) - Yr 2005 Yr 2006 Yr 2007 Yr 2008 Yr 2009
  • 4. Road transport: Eastbourne per capita emissions compared to England and South East 3 Road transport emissions include both freight and passenger 2.5 transport, both private and for business purposes. The estimates 2 are made on the basis of the distribution of traffic. This means that t CO2 Eastbourne some of the emissions within an 1.5 England Total authority represent through traffic, or South East Total part of trips into or out of the area 1 whether by residents or non- residents. 0.5 0 Yr 2005 Yr 2006 Yr 2007 Yr 2008 yr 2009
  • 5. Domestic CO2 emissions: Eastbourne compared to England, South East 3 National picture: In 2009, about 47 per 2.5 cent of domestic end-user emissions arose from gas use, 42 per cent from electricity, and 10 per cent from 2 consumption of other fuels. Between 2005 and 2009, there was a decrease t CO2 Eastbourne 1.5 in domestic gas consumption of 16%. England Total South East Total 1 0.5 0 Yr 2005 Yr 2006 Yr 2007 Yr 2008 yr 2009
  • 6. Industry and Commercial CO2 emissions: Eastbourne compared to England, South East 4 3.5 National picture: the industry and 3 commercial sector had the highest 2.5 share of end-user emissions in 43 per cent of authorities. The domestic sector t CO2 Eastbourne 2 the highest share in 32 per cent, and England Total the road transport sector had the South East Total 1.5 highest share in 25 per cent of 1 authorities. 0.5 0 Yr 2005 Yr 2006 Yr 2007 Yr 2008 yr 2009
  • 7. Slideshow by Gavin Barker KEY SOURCES Click to access source Dept of Energy and Climate Change Local authority subset data YOU ARE WELCOME TO USE THIS SLIDESHOW TO EMBED IN YOUR OWN BLOG OR WEBSITE If you choose to amend or add to this presentation, please delete my name and delete the background picture for this slideshow (go to View>Slidemaster on the toolbar to replace slide background with your own image )