
Recomendados
Mais conteúdo relacionado
Mais procurados
Mais procurados (13)
Semelhante a Velocity and acceleration
Semelhante a Velocity and acceleration (20)
Mais de Gareth Ng
Último
Último (20)
Velocity and acceleration
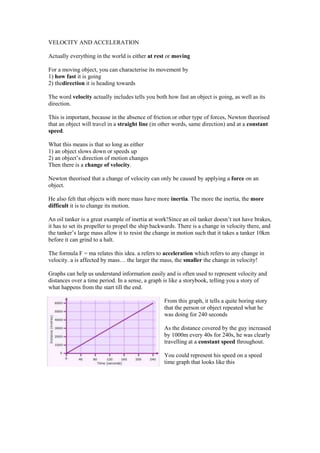
- 1. VELOCITY AND ACCELERATION Actually everything in the world is either at rest or moving For a moving object, you can characterise its movement by 1) how fast it is going 2) thedirection it is heading towards The word velocity actually includes tells you both how fast an object is going, as well as its direction. This is important, because in the absence of friction or other type of forces, Newton theorised that an object will travel in a straight line (in other words, same direction) and at a constant speed. What this means is that so long as either 1) an object slows down or speeds up 2) an object’s direction of motion changes Then there is a change of velocity. Newton theorised that a change of velocity can only be caused by applying a force on an object. He also felt that objects with more mass have more inertia. The more the inertia, the more difficult it is to change its motion. An oil tanker is a great example of inertia at work!Since an oil tanker doesn’t not have brakes, it has to set its propeller to propel the ship backwards. There is a change in velocity there, and the tanker’s large mass allow it to resist the change in motion such that it takes a tanker 10km before it can grind to a halt. The formula F = ma relates this idea. a refers to acceleration which refers to any change in velocity. a is affected by mass… the larger the mass, the smaller the change in velocity! Graphs can help us understand information easily and is often used to represent velocity and distances over a time period. In a sense, a graph is like a storybook, telling you a story of what happens from the start till the end. From this graph, it tells a quite boring story that the person or object repeated what he was doing for 240 seconds As the distance covered by the guy increased by 1000m every 40s for 240s, he was clearly travelling at a constant speed throughout. You could represent his speed on a speed time graph that looks like this
- 2. This story you can see is also the same one, the speed did not change at all for the whole 240 seconds. Yet the slope of the graph is very useful when we are comparing one thing against another. We can precisely measure the relationship between the y-axis thing and x-axis thing by taking the rise divide by the run. This tells us that for every unit on the x-axis, how many units would be reflected on the y-axis Such as in 10m/s, every second the distance increase by 10m If A and B represent 2 different cars, which car is travelling faster? _________ How can we tell which is the faster car? __________________________________________________ __________________________________________________ Over here in the next graph, what is story that you can see? The object is at rest and its velocity is 0m/s For graph (iii), notice that if you try to measure the gradient, you will find that the gradient is different and it gets larger as time progresses. This indicates that the distance per unit time is increasing… and shows that the velocity is increasing. For graph (iv), the gradient (rise over run) is constant, this means that distance per unit time is the same… And so, the velocity is constant. To better understand what increasing velocity got to do with distance travelled, look at how far away the object on the left is from the starting position as time goes by.
- 3. Take after 5s for example, the object travelled 50m or 10m every second, yet it only travelled 2m on the first second, and most of the 50m was travelled in the last 2 minutes… This is a velocity-time graph. Notice that velocity is _____________. Can you calculate the relationship between velocity and time? _________________ What will happen in the following scenario? The change in velocity is in the same direction as velocity. Therefore, velocity will increase. The change in velocity is in the opposite direction as velocity. Therefore, velocity will decrease 1a) A bus travels at a constant velocity forward of 12m/s for 5 hours, how would you plot velocity versus time in a graph? 1b) Acceleration of 4m/s2 means that the speed of an object will change by 4m/s every s! 1c) What is the final speed of the bus above if it accelerates forward at 4m/s2 for 20 seconds? 1d) What is the final speed of the bus above if the driver steps on the brake and the bus slow down by at 4m/s2 for 2 seconds? 2) If a car start moving from rest and accelerated at 3.5m/s2 for 10 seconds, what is its velocity after 10 seconds?
- 4. 3) A Cheetah was jogging at 7m/s when it saw a nice prey walking around the area and started giving chase. The Cheetah reached a top speed of 70m/s in 9 seconds. What is its acceleration? Speed-time graph Between time 0s to 4s, the person is travelling at ________________________ Between time 4s to 9s, the person is travelling at __________________________ Notice that the formula for speed So distance travelled = speed x time taken Therefore, the distance travelled by the person in the diagram above is also the area under the graph. 4) Find the distance travelled by the person between 0s to 9s 5) Sketch the distance time graph for the distance travelled for the moving object represented by the graph
- 5. Between time 0s to 4s, the velocity of the runner is ______________ This means that ____________________ must be occurring at _______m/s2 Between time 4s to 8s, the velocity of the runner is _______________ This means that there is no __________________________ because there is ____________________________________________ From 8s to 10s, the velocity of the runner _____________. This means that _____________________ must be occurring at m/s2 Sketch the distance time graph for the runner. F = MA