SlideShare uma empresa Scribd logo
1 de 30
AGRICULTURAL ENGINEERING COLLEGE & RESEARCH INSTITUTE
TAMIL NADU AGRICULTURAL UNIVERSITY
COIMBATORE – 641 003
INDUSTRIAL INTERENSHIP PROGRAMME
2016
INTERENSHIP GUIDE : K.S.MUNEESWARAN M.E, PGDES
(SENIOR MANAGER/SENIOR SCIENTIST)
VIMTA LABS LTD
WORK DONE BY : GANESH KUMAR B R (BTG-12-054)
ACKNOWLEDGEMENT
We take this opportunity with immense pleasure to thank many people from whom we
received help and guidance during process of project. We place here on record our
acknowledgement with thanks and gratitude.
Our sincere and whole hearted thanks to our Internship Guide K.S.MUNEESWARAN
M.E, PGDES (SENIOR MANAGER/SENIOR SCIENTIST), VIMTA LABS LTD,
COIMBATORE for giving us his untiring guidance, constant encouragement, sustained patience,
theoretical and material support, and valuable suggestion with untiring attention offered for the
successful completion of the INDUSTRIAL INTERNSHIP PROGRAMME and presentation on
time. He was always there cheering us up and stood by us through the good times and bad during
the project.
We extend our sincere and wholehearted gratitude to G.KRISHNAMOORTHY,
ENVIRONMENT SCIENTIST, VIMTA LABS, COIMBATORE for his continuous
encouragement showed for the completion of our INDUSTRIAL INTERNSHIP PROGRAMME
work.
We express our thanks to Dr. S.V.KOTTISWARAN, Professor, (SWCE) for timely help
in the INDUSTRIAL INTERNSHIP PROGRAMME.
We express our hearty regards to office staff for their invaluable help and encouragement
and cooperation throughout our project study.
CHAPTER 1
INTRODUCTION
1.1 COMPANY PROFILE
VIMTA – Environment Division has been in the forefront of its vision to
provide better environment through guiding and assisting the industry for sustainable
development. A stalwart in the mission to protect and preserve the natural resources on earth for
future generations, Vimta offers extensive research and consultancy services in the field of
environment. With its rich experience, multi disciplinary expertise and with the support of its state-
of-the-art analytical equipment the services offered by Vimta are wide ranging and encompasses
entire gamut of environmental management and monitoring services. With its emphasis on quality
services Vimta over the years has evolved itself into a single reference point in India for
comprehensive environmental services.
1.2 SERVICES
Environment essentially being a multi disciplinary science, the range of services offered by the
division are also comprehensive and caters to the need of industry, pollution control agencies and
regulatory authorities and in a larger pursuit of a green globe. The services under Environmental
Assessments include:
 Environmental Impact Assessments;
 Environment Management plans;
 Environmental Audits;
 Solid and Hazardous Waste Management;
 Risk Assessment (MCA, HAZON, HAZOP) & DMP;
 Occupational Health and Safety, Industrial Hygiene;
 Environmental Monitoring for Air, Meteorology, Water, Soil, Noise, Ecology and Socio-
Economic studies;
 Industrial Source Emission Monitoring;
 Offshore Sampling and Analysis of Marine Water and Sediments;
 Marine Ecological Studies;
 Marine Impact Assessment;
 Rehabilitation and Resettlement Studies;
 Forestry and Ecological Studies;
 Geological and Hydro-geological Studies;
 Land Use/Land Cover Studies based on Remote Sensing;
 Due Diligence Studies;
 Epidemiological Studies;
 Wasteland Management Studies; and
 Study on Bio-indicators.
The services under Environmental Chemistry include:
 Analysis of Water, Wastewater, Soil, Solid Waste, Hazardous Waste as per Indian and
International Codes;
 Source Emissions and Work Zone Air/Noise quality monitoring;
 Pesticide Residue Analysis;
 Performance Evaluation of APC equipment;
 Performance Evaluation of wastewater treatment systems;
 Monitoring of POPs in indoor air, ambient air and source emissions;
 Sampling and analysis for BTEX, AOX, PAH, PCB, TPH, Pesticides, VOC, SVOC, TOC,
PCP, Organo-chlorine compounds, TCLP in water soil and sludge etc. and
 Categorization of hazardous waste
1.3 ACCREDITIONS/ RECOGNITIONS
1.3.1 Accreditations
 National Accreditation Board for Testing and Calibration Laboratories (NABL)
 GOSSTANDART
 National Accreditation Board for Education & Training
1.3.2 Recognitions
 Bureau of Indian Standards
 Ministry of Health and Family Welfare
 Ministry of Environment and Forests (MoEF)
 Research, Designs & Standards Organizations, Ministry of Railways
1.3.3 Memorandum of Understanding
 Agricultural and Processed Food Products Export Development Authority (APEDA)
1.4 OBJECTIVES OF INTERNSHIP STUDY
 To study and understand the environmental monitoring parameters
 To monitor the ambient air quality in “SIDCO” industrial estate, kurichi, Coimbatore.
 Comparing the analyzed values with the national ambient air quality standards-1994
 To find the “AIR POLLUTION INDEX”
CHAPTER 2
METHODOLOGY OF ENVIRONMENT MONITORING
Environment Monitoring (EM) involves
Ambient Air Quality (AAQ)
 RPM (Respirable particulate matter)
 NRPM (Non-respirable particulate matter)
Meteorology
 Wind Speed and Direction
 Ambient air temperature
 Barometric pressure
Stack Monitoring
 Temperature
 Static Pressure & Pressure Drop
 Velocity
 Particulate Matter in the flue gas from the source
Water Quality
Noise level
Lux Monitoring
2.1 Ambient Air Quality (AAQ)
Ambient air quality monitoring involves the collection of air sample from atmosphere to know
the level of air pollution. Sampling and air pollutant measurement is generally known as air
quality monitoring. Through monitoring the current trends in air quality can be evaluated by
comparing the data with National Ambient Air Quality standards. The obtained information
helps in implementing control measures for reducing pollutant concentration to acceptable levels
and in assessing the effect of air pollution control strategy. Following instruments generally used for
AAQ monitoring are:
2.1.1 Respirable Dust Sampler (RDS)
A Respirable Dust Sampler (RDS) ENVIROTECH APM 460BL may be used for measuring
Total Suspended Particulate Matter (TSPM), Respirable Suspended Particulate Matter (RSPM),
Non-Respirable Particulate Matter (NRPM) and P.M10 with a provision for measuring pollutant
gases. A low volume sampler may be used for measuring ambient quantities of gaseous pollutants.
Specifications of High Volume Air (Respirable Dust) sampler:
High volume sampler complete in all respects including blower, cyclone separator, filter holder
free from leakages, cabinet, roof shelter, automatic voltage stabilizer, time totalizer, flow
measurement device and gas manifold arrangement of gaseous sampling with flow controller.
Blower Flow Rate
1.1 to 1.8 m3/min free flow (without resistance)
Voltage Stabilizer
An automatic voltage stabilizer to keep the voltage between 210 and 230 V at 50 to 60 Hz shall be
provided.
Filter Holder
A stainless steel (SS 304) filter holder assembly with rubber gasket to hold 25 cm x 20 cm (10 in
8 in) filter paper. Net size of filter paper for suction after putting the filter holder frame shall not
be less than 23 cm x 18 cm.
Gaseous Sampling
The gas inlet should be kept on the pipe after the cast minimum aluminium hopper but before the
blower. There can be three inlets for different gases or one inlet through a manifold. A calibrated
rotameter (0 to 3 lpm) shall be provided for checking flow rate.
Particulate Sampling
The inlet opening in the housing to the filter shall be such that particles collecting on the filter
surface are less than 100 microns. This will be done by keeping the angle of the cable roof at 45o
to the horizontal. It collects within the range of 10 Micron in the filter paper.
Main Housing
The main housing on castors shall be rectangular (29 cm and 36 cm) and made of unpainted sturdy
aluminium.
Automatic Timer Totalize
The sample should have a timer for 4 to 24 hours of settling with intermediate on-off. It should
have in addition, a time totalize to indicate hours and minutes.
Working
Air is drawn through the sample filter at a controlled flow rate by a pump. The instruments
are continuously operated for 24 hours or 8 hours depending on the type of location. Either
Ambient (24 hrs) or Source (8 hrs).Particulate matter of diameter 2.5 - 10µm are collected in the
filter paper and Particulate matter of size above 10 µm are collected in the Cup cover inside the
instrument.
Respirable Dust Sampler-ENVIROTECH APM 460BL
Before Sampling After Sampling
Filter Paper (RDS)
Before Sampling After Sampling
Cup cover (RDS)
2.1.2 Fine Particulate Sampler (FDS)
A Fine Particulate Sampler (FDS) ENVIROTECH APM550 may be used for measuring
Respirable Suspended Particulate Matter (RSPM), P.M10 and P.M2.5 with a provision for
measuring pollutant gases.
Specifications of High Volume Air and Particulate Matter (Fine Particulate) sampler:
General
High volume sampler complete in all respects including blower, cyclone separator, filter holder
free from leakages, cabinet, roof shelter, automatic voltage stabilizer, time totalizer, flow
measurement device and gas manifold arrangement of gaseous sampling with flow controller.
Blower Flow Rate
The air flow rate is 16.67 LPM.
Voltage Stabilizer
An automatic voltage stabilizer to keep the voltage between 210 and 230 V at 50 to 60 Hz shall be
provided.
Filter Holder
Fine particles are collected on special Teflon (PTFE) membrane filter of 47mm diameter GF. A
glass fiber filter disk may be used in place of Teflon membrane filters.
Gaseous Sampling
The gas inlet should be kept on the pipe after the cast minimum aluminium hopper but before the
blower. There can be three inlets for different gases or one inlet through a manifold. A calibrated
rotameter (0 to 3 lpm) shall be provided for checking flow rate.
Particulate Sampling
The inlet opening in the housing to the filter shall be such that particles collecting on the filter
surface are less than 100 microns. This will be done by keeping the angle of the cable roof at 45o
to the horizontal. It collects both PM10 and PM2.5.
Main Housing
The main housing on castors shall be rectangular (29 cm and 36 cm) and made of unpainted sturdy
aluminium.
Automatic Timer Totalize
The sample should have a timer for 4 to 24 hours of settling with intermediate on-off. It should
have in addition, a time totalize to indicate hours and minutes. The working of FDS is same as RDS
Fine Particulate Sampler-ENVIROTECH APM 550
Before Sampling After Sampling
Filter Paper (FDS)
2.1.3 Particulate matter Concentration Calculation:
The Mass Concentration is calculated using the equation
Mass concentration (μg/m3) =
(Wf –Wi) x 106
Vs
Where,
Wf = Final weight of filter paper (Micrograms)
Wi = Initial weight of filter paper (Micrograms)
Vs = Volume of air sampled (m3)
2.1.4 Impinger Box:
Impingers are generally used to determine the gaseous pollutant present in the atmosphere. These
boxes are attached to the sampler instruments to record the concentration of gaseous pollutants.
The common pollutants present in the atmosphere are
 Sulphur di-oxide (SO2)
 Oxides of Nitrogen (NOx)
 Ammonia (NH3)
 Ozone (O3)
Working:
Gases are sucked through a tapping provided on the suction side of the blower in RDS and FDS
through a set of impingers containing 30 ml of absorbing solution. Maintain a flow rate of 1.2 litre
per minute rotameter for 24 hours sampling period. Record the initial flow rate along with the
sampling time and date. After 8 hours of continuous sampling, Transfer the solutions from
impingers to sampling bottles and keep in icebox.
Impinger box
The sample collected from the impinger box is subjected into following tests for the
determination of pollutant concentration.
2.1.5 SO2 and NOX Analysis
Steps for analyzing the absorbance value of Sulphur di-oxide (SO2)
10 ml sample
2ml Formaldehyde
1ml Sulphamic acid
2ml Para-rosaniline
wait for 20 mins
Spectrophotometer (560nm)
SO2 concentration (μg/m3) =µg of SO2 X 103/Vs
Where,
SO2 (μg/m3) = Absorbance X Calibration factor
Vs = Volume of sample in litres
Steps for analyzing the absorbance value of Oxides of Nitrogen (NOx)
NOx concentration (μg/m3) =
μg of NOx X 103
Vs
Where,
NOx (μg/m3) = Absorbance X Calibration factor
Vs = Volume of sample in litres
10 ml sample
1ml Hydrogen Peroxide
10ml Sulfanilamide
1.4 ml NEDA
wait for 20 mins
Spectrophotometer(540nm)
2.1.6 Stack Monitoring:
The flue gases from Gensets, Induction furnaces, Chimney in an industry are monitored for its
pollution level. Stack kit is the instrument used for this monitoring.
Stack monitoring kit
Following parameters were analyzed by this instrument
 Temperature
 Static Pressure & Pressure Drop
 Velocity
 Particulate Matter in the flue gas from the source
Temperature:
Ambient Temperature (Ts) & Flue gas Temperature (Ta) were measured from the kit
Determination of Static Pressure:
Static Pressure can be determined with the help of the both positive and negative Pressure
measuring probe in the kit
Ps = P bar ± (∆ Ps / 13.6)
Where,
P bar = Barometric pressure
∆ Ps = Stack gas velocity pressure
Ps = Static pressure
Pressure Drop:
Temperature
measuring
probe
Pressure
measuring
probe
PMcollection
Probe
Measuring Either Positive or Negative Pressure alone results in the Pressure drop.
Determination of Stack Gas Velocity (Us):
Us= 34.98 x Cp x √dp x √Ts / Mw x Ps
Where
Us = Stack gas velocity, m/s
Cp = Pitot tube coefficient.
Ts = absolute stack gas temperature, oK
dp = Pressure drop
Ps = Absolute stack gas pressure,
Mw = Molecular weight of stack gas
Determination of Particulate Matter Concentration:
Determine the mass of dust collected in the thimble by difference i.e. weighing the thimble
before and after the run. Dry the thimble in an oven for about 2 hours at 120o C prior to
sampling. After sampling, cool, dry and again weigh the thimble along with dust maintaining the
same condition as prior to sampling
Dust Concentration in mg/Nm3
3.1.2 Water Quality:
Following parameters were generally analyzed for Water Quality monitoring
 Total Dissolved Solids (TDS)
 Total Suspended Solids(TSS)
 pH
Em = (W2- W1)× 1000
Vstd
Where,
Vstd = Volume of dry gas
W1 = Initial weight Thimble
W2 = Final weight of Thimble
 Alkalinity
3.1.3 Noise and Lux Monitoring:
Noise and Lux level of the industry is measured and compared with the standard
values prescribed by NAAQ standards.
Noise meter Lux meter
CENTRAL POLLUTION CONTROL BOARD (CPCB):
DRINKING WATER STANDARDS (IS 10500:2012)
Sl. No. Parameter Unit
Acceptable
Limit
Permissible
limit
1 Colour Hazen 5 15
2 Odour -- Agreeable Agreeable
3 Taste -- Agreeable Agreeable
4 Turbidity NTU 1 5
5 Ph -- 6.5 to 8.5 6.5 to 8.5
6 Total hardness as CaCO3 mg/l 200 600
7 Iron as Fe mg/l 0.30 0.30
8 Chloride as Cl mg/l 250 1000
9 Residual free Chlorine mg/l 0.20 1
10 Dissolved solids mg/l 500 2000
11 Calcium as Ca mg/l 75 200
12 Magnesiumas Mg mg/l 30 100
13 Copper as Cu mg/l 0.05 1.50
14 Manganese as Mn mg/l 0.10 0.30
15 Sulphate as SO4 mg/l 200 400
16 Nitrate as NO3 mg/l 45 45
17 Fluoride as F mg/l 1.0 1.5
18 Phenolic compounds as C6H5OH mg/l 0.001 0.002
19 Mercury as Hg mg/l 0.001 0.001
20 Cadmium as Cd mg/l 0.003 0.003
21 Selenium as Se mg/l 0.01 0.01
22 Total Arsenic as As mg/l 0.01 0.05
23 Cyanide as CN mg/l 0.05 0.05
24 Lead as Pd mg/l 0.01 0.01
25 Zinc as Zn mg/l 5 15
26 Anionic detergents as MBAS mg/l 0.20 1.0
27 Total Chromium as Cr mg/l 0.05 0.05
28 Mineral oil mg/l 0.5 0.5
29 Alkalinity as CaCO3 mg/l 200 600
30 Aluminium as Al mg/l 0.03 0.2
31 Boron mg/l 0.50 1.0
32 Ammonia as N mg/l 0.50 0.50
33 Barium as Ba mg/l 0.70 0.70
34 Chloramines as Cl2 mg/l 4 4
35 Silver as Ag mg/l 0.10 0.10
36 Sulphide as S2- mg/l 0.05 0.05
37 MolybdenumasMo mg/l 0.07 0.07
38 Nickel as Ni mg/l 0.02 0.02
39 Poly Chlorinated Biphenyls (PCBs) mg/l 0.0005 0.005
40 Polynuclear Aromatic Hydrocarbons (PAH) mg/l 0.0001 0.0001
41 Trihalomethanes
Bromoform mg/l 0.1 0.1
Dibromochloromethane mg/l 0.1 0.1
Bromodichloromethane mg/l 0.06 0.06
Chloroform mg/l 0.2 0.2
42 Total Coliform MPN/100ml Absent Absent
43 Faecal Coliform MPN/100ml Absent Absent
44 Pesticides Detailed Separately
TOLEREANCE LIMITS FOR TRADE EFFLUENTS STANDARDS
Sl.
No.
Characteristics
Tolerance limits for discharge of trade effluent into
Inland
Surface
Waters
Public
Sewers
On land
for
irrigation
Marine Coastal Areas
1 Colour and Odour - - - -
2 Suspended Solids (mg/1) 100 600 200 a. For Process waste
water – 100
b. For Cooling water
effluent 10% above total
suspended matterof
influent cooling water.
3 Particle size of
Suspended Solids
Shall pass
850 micron
I.S.Sieve
- - a. Floatable Solids
maximum 3 mm
b. Settlable solids
maximum 850 microns.
4 Dissolved Solids (inorganic) mg/1 2100 2100 2100 -
5 pH value 5.5 to 9 5.5 to 9 5.5 to 9 5.5 to 9
6 Temperature 45°C at the
point of
discharge
45°C at the
point of
discharge
- 45°C at the point of
discharge
7 Oil & Grease mg/1 10 20 10 20
8 Total Residual Chlorine mg/1 1.0 - - 1.0
9 Ammonical Nitrogen(asN0mg/1 50 50 - 50
10 Total Kjeldahl Nitrogen(asN) mg/1 100 - - 100
11 Free Ammonia (as NH3) mg/1 5.0 - - 5.0
12 Bio chemical oxygen demand (3 days at
27°C) mg/1
30 350 100 100
13 Chemical oxygen demand mg/1 250 - - 250
14 Arsenic (as As)mg/1 0.2 0.2 0.2 0.2
15 Mercury (as Hg) mg/1 0.01 0.01 0.01 0.01
16 Lead (as Pb) mg/1 0.1 1.0 1.0 1.0
17 Cadmium (as Cd) mg/1 2.0 1.0 1.0 2.0
18 Hexavalent Chromium (as Cr+6) mg/1 0.1 2.0 0.1 0.1
19 Total Chromium (as Cr) mg/1 2.0 2.0 2.0 1.0
20 Copper (as Cu) mg/1 3.0 3.0 3.0 3.0
21 Zinc (as Zn) mg/1 3.0 3.0 3.0 3.0
22 Selenium (as Se) mg/1 0.05 0.05 0.05 0.05
23 Nickel (as Ni) mg/1 3.0 3.0 3.0 3.0
24 Boron (as B) mg/1 2.0 2.0 2.0 2.0
25 Percent Sodium% - 60 60 -
26 Residual Sodium Carbonate mg/1 - - 5.0 -
27 Cyanide (as CN) mg/1 0.2 2.0 0.2 0.2
28 Chloride (as CI) mg/1 1000 1000 600 -
29 Flouride (as F) mg/1 2.0 1.5 2.0 1.5
30 Dissolved Phosphates (as P) mg/1 5.0 - - -
31 Sulphates (asSO4) mg/1 1000 1000 1000 1000
32 Sulphide (as S) mg/1 2.0 - 2.0 Absent
NATIONAL AMBIENT AIR QUALITY STANDARDS
[NAAQS Notification dated 18th November, 2009]
Concentration in Ambient Air
S.No Pollutant
Time
Weighted
Average
Industrial
Residential,
Rural and
Other Area
Ecologically
Sensitive Area
(notified by
Central
Government)
Methods of
Measurement
(1) (2) (3) (4) (5) (6)
1 Sulphur Dioxide
(SO2
), µg/m3
Annual*
24 hours**
50
80
20
80
1. Improved West and
Gaeke
2. Ultraviolet
Fluorescence
2 Nitrogen Dioxide
(NO2) µg/m3
Annual*
24 hours**
40
80
30
80
1. Modified Jacob
&Hochheiser (Na-
Arsenite)
2. Chemiluminesence
3 Particulate Matter
(size less than 10µm)
or PM10
µg/m3
Annual*
24 hours**
60
100
60
100
1. 1. Gravimetric
2. 2. TOEM
3. 3. Beta Attenuation
4 Particulate Matter
(size less than 2.5µm)
or PM2.5
µg/m3
Annual*
24 hours**
40
60
40
60
1. Gravimetric
2. TOEM
3. Beta Attenuation
5 Ozone (O3) µg/m3
8 hours*
1 hour**
100
180
100
180
1. UV Photometric
2. Chemilminescene
3. Chemical Method
6 Lead (Pb)µg/m3
Annual*
24 hours**
0.50
1.0
0.50
1.0
1. AAS/ICP method
after sampling on EPM
2000 or equivalent filter
paper
2. ED-XRF using
Teflon filter
7 Carbon Monoxide
(CO) mg/m3
8 hours**
1 hours **
02
04
02
04
1.Non DispensiveInfra
Red (NDIR)
2.Spectroscopy
8 Ammonia
(NH3)µg/m3
Annual*
24 hours**
100
400
100
400
1. Chemiluminescene
2. Indophenol blue
method
9 Benzene
(C6H6)µg/m3
Annual* 05 05 1. Gas chromatography
based continuous
analyzer
2. Adsorption and
Description followed by
GC analysis
10 Benzo(a)Pyrene(BaP)
– particulate phase
only, ng/m3
Annual* 01 01 1. Solvent extraction
followed by HPLC/GC
analysis
11 Arsenic (As),ng/m3
Annual* 06 06 1. AAS/ICP method
after sampling on EPM
2000 or equivalent filter
paper
12 Nickel (Ni),ng/m3
Annual* 20 20 1. AAS/ICP method
after sampling on EPM
2000 or equivalent filter
paper
* Annual arithmetic mean of minimum 104 measurements in a year at a particular site Twice a week 24 hourly at
uniform intervals.
** 24 hourly or 08 hourly or 01 hourly monitored values, as applicable, shall be complied with 98% of the time in
a year. 2% of the time, they may exceed the limits but not on two consecutive days of monitoring.
(Note. – Whenever and wherever monitoring results on two consecutive days of monitoring exceed the limits
specified above for the respective category, it shall be adequate reason to institute or continuous monitoring and
further investigation.)
AMBIENT NOISE STANDARDS AS PER“NOISEPOLLUTIONRULES, 2000”
Area
code
Category of Area
Limit in dB(A) Leq
Day Time (6 am-10pm)
Night Time (10pm-
6am)
A Industrial Area 75 70
B Commercial Area 65 55
C Residential Area 55 45
D Silence Zone 50 40
GENERAL EMISSION STANDARDS FOR STACK
S.No. Parameter Standard Concentration not to exceed (in mg/Nm3
)
1. Particulate Matter (PM) 150
2. Total Fluoride 25
3. Asbestos 4 Fibers/cc and dust should not be more than 2 mg/Nm3
4. Mercury 0.2
5. Chlorine 15
6. Hydrochloric acid vapour and mist 35
7. Sulphuric acid mist 50
8. Carbon monoxide 1% max.(v/v)
9. Lead 10 mg/Nm3
3.1.4 AIR POLLUTION INDEX:
An Air Pollution Index is defined as a scheme that transforms the values of individual air pollution
related parameters into a single number or set of numbers.
3.1.4.1 DETERMINATION OF AIR POLLUTION INDEX:
There are several methods and equations available for determining the air pollution index
For these, the following equation was used.
API =
3
1







XNO
x
SOSPM S
NO
S
SO
S
SPM
2
2
X 100
Where SSPM, SSO2, SNOX represents the ambient air quality standards for particulars matter, Sulphur
dioxide and nitrogen dioxide respectively.
3.1.4.2 RATING SCALE FOR INDICES:
A typical rating scale used is given below:
Rating Scales for API
Air pollution index Air pollution level Remarks
0-25 Clean air Good
26-50 Light air pollution Acceptable
51-75 Moderate air pollution Unsatisfactory
75-100 Heavy air pollution Unhealthy
RESULT AND DISCUSSION
In Coimbatore District, SIDCO is located at 10°55’11”N latitude and 76°57’35”E longitude which
comprises of industrial cluster. This industrial area is located at distance of 7 km from Coimbatore
Corporation Boundary. This industrial cluster area spreads over an area of about 180 acres.
AAQ (Ambient Air Quality) of SIDCO Industrial area for two years, April 2014-March 2015 and
April 2015-March 2016 were determined and compared with each other as well as with National
Ambient Air Quality Standards.
The following table shows the Monthly concentration of particulate and gaseous contaminants in
SIDCO Industrial area, Coimbatore.
National Ambient Air Quality Standards:
TSPM (Total Suspended Particulate Matter) 500* (µg/m3)
RPM (Respirable Particulate Matter) 150* (µg/m3)
Sulphur di-oxide (SO2) 80^ (µg/m3)
Nitrogen oxides (NOx) 80^ (µg/m3)
* National Ambient Air Quality Standards for ambient air have been prescribe by Central Pollution
Control Board vide Gazette Notification dated 11th April1994 for Industrial area.
^ National Ambient Air Quality Standards for ambient air have been prescribe by Central Pollution
Control Board vide Gazette Notification dated 18th November 2009 for Industrial area
On comparing the yearly average value of parameters such as TSPM, RPM, SO2 and NOX in
SIDCO Industrial area, following results were obtained.
AAQ 1:
The yearly average TSPM value for April 2014-March 2015 and April 2015-March2016 are
observed as 241.35 µg/m3 and 255.55 µg/m3 respectively.
The yearly average RPM value for April 2014-March 2015 and April 2015-March2016 are
observed as 79.079 µg/m3 and 82.713 µg/m3 respectively.
The yearly average SO2 value for April 2014-March 2015 and April 2015-March2016 are observed
as 9.5642 µg/m3 and 11.869 µg/m3 respectively.
The yearly average NOx value for April 2014-March 2015 and April 2015-March2016 are
observed as 15.83 µg/m3 and 18.403 µg/m3 respectively.
The percentage increase of TSPM over a period of two years (2014-2016) = 5.86 %
The percentage increase of RPM over a period of two years (2014-2016) = 4.59 %
The percentage increase of SO2 over a period of two years (2014-2016) = 24.09 %
The percentage increase of NOx over a period of two years (2014-2016) = 16.25 %
AAQ 2:
The yearly average TSPM value for April 2014-March 2015 and April 2015-March2016 are
observed as 251.9 µg/m3 and 302.4 µg/m3 respectively.
The yearly average RPM value for April 2014-March 2015 and April 2015-March2016 are
observed as 83.16 µg/m3 and 96.65 µg/m3 respectively.
The yearly average SO2 value for April 2014-March 2015 and April 2015-March2016 are observed
as 10.65 µg/m3 and 13.082 µg/m3 respectively.
The yearly average NOx value for April 2014-March 2015 and April 2015-March2016 are
observed as 16.75 µg/m3 and 19.978 µg/m3 respectively.
The percentage increase of TSPM over a period of two years (2014-2016) = 20.247 %
The percentage increase of RPM over a period of two years (2014-2016) = 16.22%
The percentage increase of SO2 over a period of two years (2014-2016) = 22.83%
The percentage increase of NOx over a period of two years (2014-2016) = 19.27%
AAQ 3:
The yearly average TSPM value for April 2014-March 2015 and April 2015-March2016 are
observed as 253.21 µg/m3 and 293.28 µg/m3 respectively.
The yearly average RPM value for April 2014-March 2015 and April 2015-March2016 are
observed as 84.259 µg/m3 and 94.85 µg/m3 respectively.
The yearly average SO2 value for April 2014-March 2015 and April 2015-March2016 are observed
as 11.024 µg/m3 and 12.786 µg/m3 respectively.
The yearly average NOx value for April 2014-March 2015 and April 2015-March2016 are
observed as 17.053 µg/m3 and 18.968 µg/m3 respectively.
The percentage increase of TSPM over a period of two years (2014-2016) = 15.86%
The percentage increase of RPM over a period of two years (2014-2016) = 12.56%
The percentage increase of SO2 over a period of two years (2014-2016) = 13.98%
The percentage increase of NOx over a period of two years (2014-2016) = 11.22%
AIR POLLUTION INDEX:
LOCATION 2014-2015 2015-2016
AAQ 1 26.67 29.65
AAQ 2 28.21 33.93
AAQ 3 28.57 32.78
The Air Pollution Index (API) was computed for the selected monitoring stations. From the results,
the Air Pollution Index was found to be between 26 and 50 indicating Light Air Pollution.
SUMMARY AND CONCLUSION
A Comprehensive survey of air quality was carried out in SIDCO industrial area.
Based on the results obtained following conclusions were made.
Even though the levels of all the air quality parameters are within the permissible limits as
prescribed by CPCB for this industrial area. The increase in percentage level of these parameters
is quite high when compared to previous years. Hence necessary steps are to be taken by the
industries in order to mitigate the particulate and gaseous emissions from various industrial
activities parameters.
Following suggestion can be taken to reduce the present pollutant level.
 Energy efficiency measures such as replacement of old machineries, use of renewable
energies can be encouraged.
 Construction of green belt around the industry
 Proper emission control strategies must be adopted in order to control the various industrial
emissions, so that pollutant concentrations are contained and does not exceed the
prescribed limits
 Maintenance of pollution control equipments in industries
REFERENCES
1.Mohammed Siraj Ansari, J. Sharpudin., ”Assessment of Ambient Air Quality in SIDCO
Industrial Cluster–Coimbatore, from December 2012 to May 2013” International journal for
research in emerging science and technology, volume– 1, issue- 7, December 2014.
2. U.S. Environmental Protection Agency. "Air Quality Criteria for Oxides of Nitrogen,"
Report No. EPA-600/8-82-026 (1982a).
3. U. S. Environmental Protection Agency. "Air Quality Criteria for Particulate Matter and Sulfur
Oxides," Report No. EPA-600/8-82-029 (1982b).
4. Meenakshi, P., M.K. Saseetharan, September 2003, ”Analysis of Seasonal Varation of
Suspended Particulate Matter and Oxides of Nitrogen with reference to Wind Direction in
Coimbatore City”., IE (I) journal. EN Vol. 84
5. Palanivel, M., T.Elayaraja, D.Ganeshmoorthy, N.Jagadeeswaran, and K.Kalaiselvi “ Impact of
Foundry Units On Coimbatore Environment” in Martin J. Bunch, V. Madha Suresh and T.
Vasantha Kumar, eds., Proceedings of the Third International Conference on Environment and
Health, Chennai, India, 15-17 December, 2003. Chennai: Department of Geography,
University of Madras and Faculty of Environmental Studies, York University. Pages 322-327.
6. Vedamadavan, “Assessment of Ambient Air Quality in Coimbatore City”, Civil and
Environmental Research Vol 2, No.1, 2012.
7. Schwela, D.H. 2000. Air pollution and health in urban area: Reviews. Env. Health. 15: 13-42.
8. Kalabokas P.D., 2010, “Atmospheric PM10 particle concentration measurements at Central
and peripheral urban sites in athens and Thessaloniki, Greece, Global NEST Journal, Vol 12,
No 1, pp 71-83.
9. Wiederkehr, P., Yoon, S.-J., 1998. Air Quality Indicators, in: Fenger, J., Hertel, O., Palmgren,
F. (Eds.), Urban Air Pollution, European Aspects. Kluwer Academic Publisher, Dordrecht, pp.
403-418.
10. Ahmed Haytham A. Air Quality in Egypt August 1999, Air Quality Monthly Report,
Monthly report, August 1999
11. Avinish Chauhan, Mayank Pawar, 2010, “Assessment of Ambient Air Quality Status In
Urbanization, Industralisation And Commercial Centers Of Utharkand(India) “ .,New York
Science Journal ; 3(7)
12. http://www.cpcb.nic.in/
INTERENSHIP REPORT

Mais conteúdo relacionado

Mais procurados

Sulfur dioxide monitoring
Sulfur dioxide monitoringSulfur dioxide monitoring
Sulfur dioxide monitoringECRD IN
 
IRJET - Minimizing Steam Loss through Steam Distribution Network using an Int...
IRJET - Minimizing Steam Loss through Steam Distribution Network using an Int...IRJET - Minimizing Steam Loss through Steam Distribution Network using an Int...
IRJET - Minimizing Steam Loss through Steam Distribution Network using an Int...IRJET Journal
 
Gas detect. brochure may 2013 1
Gas detect. brochure may 2013 1Gas detect. brochure may 2013 1
Gas detect. brochure may 2013 1a1-cbiss
 
Morrison, Rob, Barr Engineering, Walsack, Phil, MPUA, Funny Things I Found in...
Morrison, Rob, Barr Engineering, Walsack, Phil, MPUA, Funny Things I Found in...Morrison, Rob, Barr Engineering, Walsack, Phil, MPUA, Funny Things I Found in...
Morrison, Rob, Barr Engineering, Walsack, Phil, MPUA, Funny Things I Found in...Kevin Perry
 
AIR SAMPLING ANALYSIS AND METHODOLOGY
AIR SAMPLING ANALYSIS AND METHODOLOGYAIR SAMPLING ANALYSIS AND METHODOLOGY
AIR SAMPLING ANALYSIS AND METHODOLOGYSiti Mastura
 
One Odour Unit-Precisely how can an Odour Unit be measured?
One Odour Unit-Precisely how can an Odour Unit be measured?One Odour Unit-Precisely how can an Odour Unit be measured?
One Odour Unit-Precisely how can an Odour Unit be measured?mtingle
 
Sampling procedure part-2
Sampling procedure part-2Sampling procedure part-2
Sampling procedure part-2Vipul Shankar
 
Measurement of respirable suspended pm10
Measurement of respirable suspended pm10Measurement of respirable suspended pm10
Measurement of respirable suspended pm10ECRD2015
 
Measurement of respirable
Measurement of respirableMeasurement of respirable
Measurement of respirableECRD IN
 
Air sampling methods
Air sampling methodsAir sampling methods
Air sampling methodsdeepak ravi
 
PSC-Best Practices for Using Near Infrared Instrumentation for the Frac Sand ...
PSC-Best Practices for Using Near Infrared Instrumentation for the Frac Sand ...PSC-Best Practices for Using Near Infrared Instrumentation for the Frac Sand ...
PSC-Best Practices for Using Near Infrared Instrumentation for the Frac Sand ...Bob Schumann
 
PM 10 Measurement
PM 10 MeasurementPM 10 Measurement
PM 10 MeasurementECRD IN
 
Qualification of INFARED SPECTROSCOPY BY HIMAJA.D
Qualification of INFARED SPECTROSCOPY BY HIMAJA.DQualification of INFARED SPECTROSCOPY BY HIMAJA.D
Qualification of INFARED SPECTROSCOPY BY HIMAJA.Dhimaja donthula
 
Download-manuals-water quality-wq-manuals-gwvolume6fieldmanualwaterqualitysa...
 Download-manuals-water quality-wq-manuals-gwvolume6fieldmanualwaterqualitysa... Download-manuals-water quality-wq-manuals-gwvolume6fieldmanualwaterqualitysa...
Download-manuals-water quality-wq-manuals-gwvolume6fieldmanualwaterqualitysa...hydrologywebsite1
 

Mais procurados (20)

Sulfur dioxide monitoring
Sulfur dioxide monitoringSulfur dioxide monitoring
Sulfur dioxide monitoring
 
IRJET - Minimizing Steam Loss through Steam Distribution Network using an Int...
IRJET - Minimizing Steam Loss through Steam Distribution Network using an Int...IRJET - Minimizing Steam Loss through Steam Distribution Network using an Int...
IRJET - Minimizing Steam Loss through Steam Distribution Network using an Int...
 
Air sampling
Air samplingAir sampling
Air sampling
 
Gas detect. brochure may 2013 1
Gas detect. brochure may 2013 1Gas detect. brochure may 2013 1
Gas detect. brochure may 2013 1
 
L 35 final
L 35 finalL 35 final
L 35 final
 
Morrison, Rob, Barr Engineering, Walsack, Phil, MPUA, Funny Things I Found in...
Morrison, Rob, Barr Engineering, Walsack, Phil, MPUA, Funny Things I Found in...Morrison, Rob, Barr Engineering, Walsack, Phil, MPUA, Funny Things I Found in...
Morrison, Rob, Barr Engineering, Walsack, Phil, MPUA, Funny Things I Found in...
 
AIR SAMPLING ANALYSIS AND METHODOLOGY
AIR SAMPLING ANALYSIS AND METHODOLOGYAIR SAMPLING ANALYSIS AND METHODOLOGY
AIR SAMPLING ANALYSIS AND METHODOLOGY
 
One Odour Unit-Precisely how can an Odour Unit be measured?
One Odour Unit-Precisely how can an Odour Unit be measured?One Odour Unit-Precisely how can an Odour Unit be measured?
One Odour Unit-Precisely how can an Odour Unit be measured?
 
Sampling procedures
Sampling   proceduresSampling   procedures
Sampling procedures
 
Level measurement
Level measurementLevel measurement
Level measurement
 
Environmental Monitoring 2019
Environmental Monitoring 2019Environmental Monitoring 2019
Environmental Monitoring 2019
 
Sampling procedure part-2
Sampling procedure part-2Sampling procedure part-2
Sampling procedure part-2
 
Measurement of respirable suspended pm10
Measurement of respirable suspended pm10Measurement of respirable suspended pm10
Measurement of respirable suspended pm10
 
Measurement of respirable
Measurement of respirableMeasurement of respirable
Measurement of respirable
 
Air sampling methods
Air sampling methodsAir sampling methods
Air sampling methods
 
PSC-Best Practices for Using Near Infrared Instrumentation for the Frac Sand ...
PSC-Best Practices for Using Near Infrared Instrumentation for the Frac Sand ...PSC-Best Practices for Using Near Infrared Instrumentation for the Frac Sand ...
PSC-Best Practices for Using Near Infrared Instrumentation for the Frac Sand ...
 
L 37 final
L 37 finalL 37 final
L 37 final
 
PM 10 Measurement
PM 10 MeasurementPM 10 Measurement
PM 10 Measurement
 
Qualification of INFARED SPECTROSCOPY BY HIMAJA.D
Qualification of INFARED SPECTROSCOPY BY HIMAJA.DQualification of INFARED SPECTROSCOPY BY HIMAJA.D
Qualification of INFARED SPECTROSCOPY BY HIMAJA.D
 
Download-manuals-water quality-wq-manuals-gwvolume6fieldmanualwaterqualitysa...
 Download-manuals-water quality-wq-manuals-gwvolume6fieldmanualwaterqualitysa... Download-manuals-water quality-wq-manuals-gwvolume6fieldmanualwaterqualitysa...
Download-manuals-water quality-wq-manuals-gwvolume6fieldmanualwaterqualitysa...
 

Semelhante a INTERENSHIP REPORT

Dr bhargava
Dr bhargavaDr bhargava
Dr bhargavaECRD2015
 
AMBIENT AIR POLLUTANTYS SAMPLING AND ANALYSIS.pptx
AMBIENT AIR POLLUTANTYS SAMPLING AND ANALYSIS.pptxAMBIENT AIR POLLUTANTYS SAMPLING AND ANALYSIS.pptx
AMBIENT AIR POLLUTANTYS SAMPLING AND ANALYSIS.pptxAniketChavan72
 
Particulate Containment Validation: An Effective Tool in Reducing Pharmaceuti...
Particulate Containment Validation: An Effective Tool in Reducing Pharmaceuti...Particulate Containment Validation: An Effective Tool in Reducing Pharmaceuti...
Particulate Containment Validation: An Effective Tool in Reducing Pharmaceuti...Kartik Vora
 
IRJET- Assessment and Characterization of Dust in Surface Mine at Differe...
IRJET-  	  Assessment and Characterization of Dust in Surface Mine at Differe...IRJET-  	  Assessment and Characterization of Dust in Surface Mine at Differe...
IRJET- Assessment and Characterization of Dust in Surface Mine at Differe...IRJET Journal
 
Particulate Containment Validation By Prashant kondragunta, ISS
Particulate Containment Validation By Prashant kondragunta, ISSParticulate Containment Validation By Prashant kondragunta, ISS
Particulate Containment Validation By Prashant kondragunta, ISSInternational Safety Systems
 
Evolution of Ambient Air Quality Monitoring Systems
Evolution of Ambient Air Quality Monitoring SystemsEvolution of Ambient Air Quality Monitoring Systems
Evolution of Ambient Air Quality Monitoring SystemsOizom
 
The evolution of air quality monitoring systems
The evolution of air quality monitoring systemsThe evolution of air quality monitoring systems
The evolution of air quality monitoring systemsOizom
 
Untitled.fr10
Untitled.fr10Untitled.fr10
Untitled.fr10ECRD IN
 
Contamination Control in Cleanrooms_Dr.A. Amsavel
Contamination Control in Cleanrooms_Dr.A. AmsavelContamination Control in Cleanrooms_Dr.A. Amsavel
Contamination Control in Cleanrooms_Dr.A. AmsavelDr. Amsavel A
 
Intro_to_the_Environ_Quality_Regulations_2014_and_Compliance_Requirements.pdf
Intro_to_the_Environ_Quality_Regulations_2014_and_Compliance_Requirements.pdfIntro_to_the_Environ_Quality_Regulations_2014_and_Compliance_Requirements.pdf
Intro_to_the_Environ_Quality_Regulations_2014_and_Compliance_Requirements.pdfLidiyaBatrisyia1
 
Air Quality Study on measeurement tools.pptx
Air Quality Study on measeurement tools.pptxAir Quality Study on measeurement tools.pptx
Air Quality Study on measeurement tools.pptxRAJA SEKHAR MAMILLAPALLI
 
Airborne dust awareness, where do I stand? - Mark Shepherd
Airborne dust awareness, where do I stand? - Mark ShepherdAirborne dust awareness, where do I stand? - Mark Shepherd
Airborne dust awareness, where do I stand? - Mark ShepherdNSW Environment and Planning
 
IRJET- Design and Fabrication of a Micro-Respirometer to Measure the Short-Te...
IRJET- Design and Fabrication of a Micro-Respirometer to Measure the Short-Te...IRJET- Design and Fabrication of a Micro-Respirometer to Measure the Short-Te...
IRJET- Design and Fabrication of a Micro-Respirometer to Measure the Short-Te...IRJET Journal
 
Stack Monitoring Kit.pdf
Stack Monitoring Kit.pdfStack Monitoring Kit.pdf
Stack Monitoring Kit.pdfKDMGlobal
 
Company Profile
Company ProfileCompany Profile
Company ProfileSuzie M.
 
Air pollution measurement , emission estimates
Air pollution measurement , emission estimatesAir pollution measurement , emission estimates
Air pollution measurement , emission estimatesHani301
 
Gravimetric Analysis Paper
Gravimetric Analysis PaperGravimetric Analysis Paper
Gravimetric Analysis PaperERIC NGANDU
 
Odour Regulation-Solution to control Odour from Municipal Solid Waste Managem...
Odour Regulation-Solution to control Odour from Municipal Solid Waste Managem...Odour Regulation-Solution to control Odour from Municipal Solid Waste Managem...
Odour Regulation-Solution to control Odour from Municipal Solid Waste Managem...Karthik Kumar
 

Semelhante a INTERENSHIP REPORT (20)

Dr bhargava
Dr bhargavaDr bhargava
Dr bhargava
 
AMBIENT AIR POLLUTANTYS SAMPLING AND ANALYSIS.pptx
AMBIENT AIR POLLUTANTYS SAMPLING AND ANALYSIS.pptxAMBIENT AIR POLLUTANTYS SAMPLING AND ANALYSIS.pptx
AMBIENT AIR POLLUTANTYS SAMPLING AND ANALYSIS.pptx
 
Particulate Containment Validation: An Effective Tool in Reducing Pharmaceuti...
Particulate Containment Validation: An Effective Tool in Reducing Pharmaceuti...Particulate Containment Validation: An Effective Tool in Reducing Pharmaceuti...
Particulate Containment Validation: An Effective Tool in Reducing Pharmaceuti...
 
ABHI REPORT
ABHI REPORTABHI REPORT
ABHI REPORT
 
IRJET- Assessment and Characterization of Dust in Surface Mine at Differe...
IRJET-  	  Assessment and Characterization of Dust in Surface Mine at Differe...IRJET-  	  Assessment and Characterization of Dust in Surface Mine at Differe...
IRJET- Assessment and Characterization of Dust in Surface Mine at Differe...
 
Particulate Containment Validation By Prashant kondragunta, ISS
Particulate Containment Validation By Prashant kondragunta, ISSParticulate Containment Validation By Prashant kondragunta, ISS
Particulate Containment Validation By Prashant kondragunta, ISS
 
Evolution of Ambient Air Quality Monitoring Systems
Evolution of Ambient Air Quality Monitoring SystemsEvolution of Ambient Air Quality Monitoring Systems
Evolution of Ambient Air Quality Monitoring Systems
 
The evolution of air quality monitoring systems
The evolution of air quality monitoring systemsThe evolution of air quality monitoring systems
The evolution of air quality monitoring systems
 
Untitled.fr10
Untitled.fr10Untitled.fr10
Untitled.fr10
 
Contamination Control in Cleanrooms_Dr.A. Amsavel
Contamination Control in Cleanrooms_Dr.A. AmsavelContamination Control in Cleanrooms_Dr.A. Amsavel
Contamination Control in Cleanrooms_Dr.A. Amsavel
 
Intro_to_the_Environ_Quality_Regulations_2014_and_Compliance_Requirements.pdf
Intro_to_the_Environ_Quality_Regulations_2014_and_Compliance_Requirements.pdfIntro_to_the_Environ_Quality_Regulations_2014_and_Compliance_Requirements.pdf
Intro_to_the_Environ_Quality_Regulations_2014_and_Compliance_Requirements.pdf
 
Air Quality Study on measeurement tools.pptx
Air Quality Study on measeurement tools.pptxAir Quality Study on measeurement tools.pptx
Air Quality Study on measeurement tools.pptx
 
Airborne dust awareness, where do I stand? - Mark Shepherd
Airborne dust awareness, where do I stand? - Mark ShepherdAirborne dust awareness, where do I stand? - Mark Shepherd
Airborne dust awareness, where do I stand? - Mark Shepherd
 
IRJET- Design and Fabrication of a Micro-Respirometer to Measure the Short-Te...
IRJET- Design and Fabrication of a Micro-Respirometer to Measure the Short-Te...IRJET- Design and Fabrication of a Micro-Respirometer to Measure the Short-Te...
IRJET- Design and Fabrication of a Micro-Respirometer to Measure the Short-Te...
 
Stack Monitoring Kit.pdf
Stack Monitoring Kit.pdfStack Monitoring Kit.pdf
Stack Monitoring Kit.pdf
 
Company Profile
Company ProfileCompany Profile
Company Profile
 
Air pollution measurement , emission estimates
Air pollution measurement , emission estimatesAir pollution measurement , emission estimates
Air pollution measurement , emission estimates
 
Gravimetric Analysis Paper
Gravimetric Analysis PaperGravimetric Analysis Paper
Gravimetric Analysis Paper
 
HVAC
HVACHVAC
HVAC
 
Odour Regulation-Solution to control Odour from Municipal Solid Waste Managem...
Odour Regulation-Solution to control Odour from Municipal Solid Waste Managem...Odour Regulation-Solution to control Odour from Municipal Solid Waste Managem...
Odour Regulation-Solution to control Odour from Municipal Solid Waste Managem...
 

INTERENSHIP REPORT

  • 1. AGRICULTURAL ENGINEERING COLLEGE & RESEARCH INSTITUTE TAMIL NADU AGRICULTURAL UNIVERSITY COIMBATORE – 641 003 INDUSTRIAL INTERENSHIP PROGRAMME 2016 INTERENSHIP GUIDE : K.S.MUNEESWARAN M.E, PGDES (SENIOR MANAGER/SENIOR SCIENTIST) VIMTA LABS LTD WORK DONE BY : GANESH KUMAR B R (BTG-12-054)
  • 2. ACKNOWLEDGEMENT We take this opportunity with immense pleasure to thank many people from whom we received help and guidance during process of project. We place here on record our acknowledgement with thanks and gratitude. Our sincere and whole hearted thanks to our Internship Guide K.S.MUNEESWARAN M.E, PGDES (SENIOR MANAGER/SENIOR SCIENTIST), VIMTA LABS LTD, COIMBATORE for giving us his untiring guidance, constant encouragement, sustained patience, theoretical and material support, and valuable suggestion with untiring attention offered for the successful completion of the INDUSTRIAL INTERNSHIP PROGRAMME and presentation on time. He was always there cheering us up and stood by us through the good times and bad during the project. We extend our sincere and wholehearted gratitude to G.KRISHNAMOORTHY, ENVIRONMENT SCIENTIST, VIMTA LABS, COIMBATORE for his continuous encouragement showed for the completion of our INDUSTRIAL INTERNSHIP PROGRAMME work. We express our thanks to Dr. S.V.KOTTISWARAN, Professor, (SWCE) for timely help in the INDUSTRIAL INTERNSHIP PROGRAMME. We express our hearty regards to office staff for their invaluable help and encouragement and cooperation throughout our project study.
  • 3. CHAPTER 1 INTRODUCTION 1.1 COMPANY PROFILE VIMTA – Environment Division has been in the forefront of its vision to provide better environment through guiding and assisting the industry for sustainable development. A stalwart in the mission to protect and preserve the natural resources on earth for future generations, Vimta offers extensive research and consultancy services in the field of environment. With its rich experience, multi disciplinary expertise and with the support of its state- of-the-art analytical equipment the services offered by Vimta are wide ranging and encompasses entire gamut of environmental management and monitoring services. With its emphasis on quality services Vimta over the years has evolved itself into a single reference point in India for comprehensive environmental services. 1.2 SERVICES Environment essentially being a multi disciplinary science, the range of services offered by the division are also comprehensive and caters to the need of industry, pollution control agencies and regulatory authorities and in a larger pursuit of a green globe. The services under Environmental Assessments include:  Environmental Impact Assessments;  Environment Management plans;  Environmental Audits;  Solid and Hazardous Waste Management;  Risk Assessment (MCA, HAZON, HAZOP) & DMP;  Occupational Health and Safety, Industrial Hygiene;  Environmental Monitoring for Air, Meteorology, Water, Soil, Noise, Ecology and Socio- Economic studies;  Industrial Source Emission Monitoring;  Offshore Sampling and Analysis of Marine Water and Sediments;  Marine Ecological Studies;  Marine Impact Assessment;  Rehabilitation and Resettlement Studies;  Forestry and Ecological Studies;  Geological and Hydro-geological Studies;  Land Use/Land Cover Studies based on Remote Sensing;  Due Diligence Studies;  Epidemiological Studies;  Wasteland Management Studies; and  Study on Bio-indicators.
  • 4. The services under Environmental Chemistry include:  Analysis of Water, Wastewater, Soil, Solid Waste, Hazardous Waste as per Indian and International Codes;  Source Emissions and Work Zone Air/Noise quality monitoring;  Pesticide Residue Analysis;  Performance Evaluation of APC equipment;  Performance Evaluation of wastewater treatment systems;  Monitoring of POPs in indoor air, ambient air and source emissions;  Sampling and analysis for BTEX, AOX, PAH, PCB, TPH, Pesticides, VOC, SVOC, TOC, PCP, Organo-chlorine compounds, TCLP in water soil and sludge etc. and  Categorization of hazardous waste 1.3 ACCREDITIONS/ RECOGNITIONS 1.3.1 Accreditations  National Accreditation Board for Testing and Calibration Laboratories (NABL)  GOSSTANDART  National Accreditation Board for Education & Training 1.3.2 Recognitions  Bureau of Indian Standards  Ministry of Health and Family Welfare  Ministry of Environment and Forests (MoEF)  Research, Designs & Standards Organizations, Ministry of Railways 1.3.3 Memorandum of Understanding  Agricultural and Processed Food Products Export Development Authority (APEDA) 1.4 OBJECTIVES OF INTERNSHIP STUDY  To study and understand the environmental monitoring parameters  To monitor the ambient air quality in “SIDCO” industrial estate, kurichi, Coimbatore.  Comparing the analyzed values with the national ambient air quality standards-1994  To find the “AIR POLLUTION INDEX”
  • 5. CHAPTER 2 METHODOLOGY OF ENVIRONMENT MONITORING Environment Monitoring (EM) involves Ambient Air Quality (AAQ)  RPM (Respirable particulate matter)  NRPM (Non-respirable particulate matter) Meteorology  Wind Speed and Direction  Ambient air temperature  Barometric pressure Stack Monitoring  Temperature  Static Pressure & Pressure Drop  Velocity  Particulate Matter in the flue gas from the source Water Quality Noise level Lux Monitoring 2.1 Ambient Air Quality (AAQ) Ambient air quality monitoring involves the collection of air sample from atmosphere to know the level of air pollution. Sampling and air pollutant measurement is generally known as air quality monitoring. Through monitoring the current trends in air quality can be evaluated by comparing the data with National Ambient Air Quality standards. The obtained information helps in implementing control measures for reducing pollutant concentration to acceptable levels and in assessing the effect of air pollution control strategy. Following instruments generally used for AAQ monitoring are: 2.1.1 Respirable Dust Sampler (RDS) A Respirable Dust Sampler (RDS) ENVIROTECH APM 460BL may be used for measuring Total Suspended Particulate Matter (TSPM), Respirable Suspended Particulate Matter (RSPM), Non-Respirable Particulate Matter (NRPM) and P.M10 with a provision for measuring pollutant gases. A low volume sampler may be used for measuring ambient quantities of gaseous pollutants. Specifications of High Volume Air (Respirable Dust) sampler:
  • 6. High volume sampler complete in all respects including blower, cyclone separator, filter holder free from leakages, cabinet, roof shelter, automatic voltage stabilizer, time totalizer, flow measurement device and gas manifold arrangement of gaseous sampling with flow controller. Blower Flow Rate 1.1 to 1.8 m3/min free flow (without resistance) Voltage Stabilizer An automatic voltage stabilizer to keep the voltage between 210 and 230 V at 50 to 60 Hz shall be provided. Filter Holder A stainless steel (SS 304) filter holder assembly with rubber gasket to hold 25 cm x 20 cm (10 in 8 in) filter paper. Net size of filter paper for suction after putting the filter holder frame shall not be less than 23 cm x 18 cm. Gaseous Sampling The gas inlet should be kept on the pipe after the cast minimum aluminium hopper but before the blower. There can be three inlets for different gases or one inlet through a manifold. A calibrated rotameter (0 to 3 lpm) shall be provided for checking flow rate. Particulate Sampling The inlet opening in the housing to the filter shall be such that particles collecting on the filter surface are less than 100 microns. This will be done by keeping the angle of the cable roof at 45o to the horizontal. It collects within the range of 10 Micron in the filter paper. Main Housing The main housing on castors shall be rectangular (29 cm and 36 cm) and made of unpainted sturdy aluminium. Automatic Timer Totalize The sample should have a timer for 4 to 24 hours of settling with intermediate on-off. It should have in addition, a time totalize to indicate hours and minutes. Working
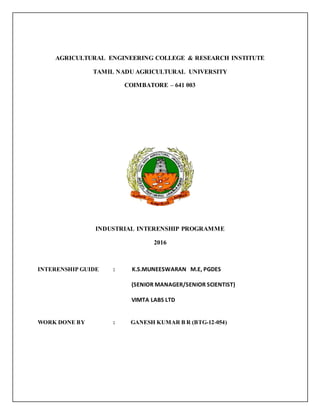
  • 7. Air is drawn through the sample filter at a controlled flow rate by a pump. The instruments are continuously operated for 24 hours or 8 hours depending on the type of location. Either Ambient (24 hrs) or Source (8 hrs).Particulate matter of diameter 2.5 - 10µm are collected in the filter paper and Particulate matter of size above 10 µm are collected in the Cup cover inside the instrument.
  • 9. Before Sampling After Sampling Filter Paper (RDS) Before Sampling After Sampling Cup cover (RDS)
  • 10. 2.1.2 Fine Particulate Sampler (FDS) A Fine Particulate Sampler (FDS) ENVIROTECH APM550 may be used for measuring Respirable Suspended Particulate Matter (RSPM), P.M10 and P.M2.5 with a provision for measuring pollutant gases. Specifications of High Volume Air and Particulate Matter (Fine Particulate) sampler: General High volume sampler complete in all respects including blower, cyclone separator, filter holder free from leakages, cabinet, roof shelter, automatic voltage stabilizer, time totalizer, flow measurement device and gas manifold arrangement of gaseous sampling with flow controller. Blower Flow Rate The air flow rate is 16.67 LPM. Voltage Stabilizer An automatic voltage stabilizer to keep the voltage between 210 and 230 V at 50 to 60 Hz shall be provided. Filter Holder Fine particles are collected on special Teflon (PTFE) membrane filter of 47mm diameter GF. A glass fiber filter disk may be used in place of Teflon membrane filters. Gaseous Sampling The gas inlet should be kept on the pipe after the cast minimum aluminium hopper but before the blower. There can be three inlets for different gases or one inlet through a manifold. A calibrated rotameter (0 to 3 lpm) shall be provided for checking flow rate. Particulate Sampling The inlet opening in the housing to the filter shall be such that particles collecting on the filter surface are less than 100 microns. This will be done by keeping the angle of the cable roof at 45o to the horizontal. It collects both PM10 and PM2.5. Main Housing The main housing on castors shall be rectangular (29 cm and 36 cm) and made of unpainted sturdy aluminium.
  • 11. Automatic Timer Totalize The sample should have a timer for 4 to 24 hours of settling with intermediate on-off. It should have in addition, a time totalize to indicate hours and minutes. The working of FDS is same as RDS Fine Particulate Sampler-ENVIROTECH APM 550 Before Sampling After Sampling Filter Paper (FDS)
  • 12. 2.1.3 Particulate matter Concentration Calculation: The Mass Concentration is calculated using the equation Mass concentration (μg/m3) = (Wf –Wi) x 106 Vs Where, Wf = Final weight of filter paper (Micrograms) Wi = Initial weight of filter paper (Micrograms) Vs = Volume of air sampled (m3) 2.1.4 Impinger Box: Impingers are generally used to determine the gaseous pollutant present in the atmosphere. These boxes are attached to the sampler instruments to record the concentration of gaseous pollutants. The common pollutants present in the atmosphere are  Sulphur di-oxide (SO2)  Oxides of Nitrogen (NOx)  Ammonia (NH3)  Ozone (O3) Working: Gases are sucked through a tapping provided on the suction side of the blower in RDS and FDS through a set of impingers containing 30 ml of absorbing solution. Maintain a flow rate of 1.2 litre per minute rotameter for 24 hours sampling period. Record the initial flow rate along with the sampling time and date. After 8 hours of continuous sampling, Transfer the solutions from impingers to sampling bottles and keep in icebox.
  • 13. Impinger box The sample collected from the impinger box is subjected into following tests for the determination of pollutant concentration. 2.1.5 SO2 and NOX Analysis Steps for analyzing the absorbance value of Sulphur di-oxide (SO2) 10 ml sample 2ml Formaldehyde 1ml Sulphamic acid 2ml Para-rosaniline wait for 20 mins Spectrophotometer (560nm)
  • 14. SO2 concentration (μg/m3) =µg of SO2 X 103/Vs Where, SO2 (μg/m3) = Absorbance X Calibration factor Vs = Volume of sample in litres Steps for analyzing the absorbance value of Oxides of Nitrogen (NOx) NOx concentration (μg/m3) = μg of NOx X 103 Vs Where, NOx (μg/m3) = Absorbance X Calibration factor Vs = Volume of sample in litres 10 ml sample 1ml Hydrogen Peroxide 10ml Sulfanilamide 1.4 ml NEDA wait for 20 mins Spectrophotometer(540nm)
  • 15. 2.1.6 Stack Monitoring: The flue gases from Gensets, Induction furnaces, Chimney in an industry are monitored for its pollution level. Stack kit is the instrument used for this monitoring. Stack monitoring kit Following parameters were analyzed by this instrument  Temperature  Static Pressure & Pressure Drop  Velocity  Particulate Matter in the flue gas from the source Temperature: Ambient Temperature (Ts) & Flue gas Temperature (Ta) were measured from the kit Determination of Static Pressure: Static Pressure can be determined with the help of the both positive and negative Pressure measuring probe in the kit Ps = P bar ± (∆ Ps / 13.6) Where, P bar = Barometric pressure ∆ Ps = Stack gas velocity pressure Ps = Static pressure Pressure Drop: Temperature measuring probe Pressure measuring probe PMcollection Probe
  • 16. Measuring Either Positive or Negative Pressure alone results in the Pressure drop. Determination of Stack Gas Velocity (Us): Us= 34.98 x Cp x √dp x √Ts / Mw x Ps Where Us = Stack gas velocity, m/s Cp = Pitot tube coefficient. Ts = absolute stack gas temperature, oK dp = Pressure drop Ps = Absolute stack gas pressure, Mw = Molecular weight of stack gas Determination of Particulate Matter Concentration: Determine the mass of dust collected in the thimble by difference i.e. weighing the thimble before and after the run. Dry the thimble in an oven for about 2 hours at 120o C prior to sampling. After sampling, cool, dry and again weigh the thimble along with dust maintaining the same condition as prior to sampling Dust Concentration in mg/Nm3 3.1.2 Water Quality: Following parameters were generally analyzed for Water Quality monitoring  Total Dissolved Solids (TDS)  Total Suspended Solids(TSS)  pH Em = (W2- W1)× 1000 Vstd Where, Vstd = Volume of dry gas W1 = Initial weight Thimble W2 = Final weight of Thimble
  • 17.  Alkalinity 3.1.3 Noise and Lux Monitoring: Noise and Lux level of the industry is measured and compared with the standard values prescribed by NAAQ standards. Noise meter Lux meter CENTRAL POLLUTION CONTROL BOARD (CPCB): DRINKING WATER STANDARDS (IS 10500:2012) Sl. No. Parameter Unit Acceptable Limit Permissible limit 1 Colour Hazen 5 15 2 Odour -- Agreeable Agreeable 3 Taste -- Agreeable Agreeable 4 Turbidity NTU 1 5 5 Ph -- 6.5 to 8.5 6.5 to 8.5 6 Total hardness as CaCO3 mg/l 200 600 7 Iron as Fe mg/l 0.30 0.30 8 Chloride as Cl mg/l 250 1000 9 Residual free Chlorine mg/l 0.20 1
  • 18. 10 Dissolved solids mg/l 500 2000 11 Calcium as Ca mg/l 75 200 12 Magnesiumas Mg mg/l 30 100 13 Copper as Cu mg/l 0.05 1.50 14 Manganese as Mn mg/l 0.10 0.30 15 Sulphate as SO4 mg/l 200 400 16 Nitrate as NO3 mg/l 45 45 17 Fluoride as F mg/l 1.0 1.5 18 Phenolic compounds as C6H5OH mg/l 0.001 0.002 19 Mercury as Hg mg/l 0.001 0.001 20 Cadmium as Cd mg/l 0.003 0.003 21 Selenium as Se mg/l 0.01 0.01 22 Total Arsenic as As mg/l 0.01 0.05 23 Cyanide as CN mg/l 0.05 0.05 24 Lead as Pd mg/l 0.01 0.01 25 Zinc as Zn mg/l 5 15 26 Anionic detergents as MBAS mg/l 0.20 1.0 27 Total Chromium as Cr mg/l 0.05 0.05 28 Mineral oil mg/l 0.5 0.5 29 Alkalinity as CaCO3 mg/l 200 600 30 Aluminium as Al mg/l 0.03 0.2 31 Boron mg/l 0.50 1.0 32 Ammonia as N mg/l 0.50 0.50 33 Barium as Ba mg/l 0.70 0.70 34 Chloramines as Cl2 mg/l 4 4 35 Silver as Ag mg/l 0.10 0.10 36 Sulphide as S2- mg/l 0.05 0.05 37 MolybdenumasMo mg/l 0.07 0.07 38 Nickel as Ni mg/l 0.02 0.02 39 Poly Chlorinated Biphenyls (PCBs) mg/l 0.0005 0.005
  • 19. 40 Polynuclear Aromatic Hydrocarbons (PAH) mg/l 0.0001 0.0001 41 Trihalomethanes Bromoform mg/l 0.1 0.1 Dibromochloromethane mg/l 0.1 0.1 Bromodichloromethane mg/l 0.06 0.06 Chloroform mg/l 0.2 0.2 42 Total Coliform MPN/100ml Absent Absent 43 Faecal Coliform MPN/100ml Absent Absent 44 Pesticides Detailed Separately TOLEREANCE LIMITS FOR TRADE EFFLUENTS STANDARDS Sl. No. Characteristics Tolerance limits for discharge of trade effluent into Inland Surface Waters Public Sewers On land for irrigation Marine Coastal Areas 1 Colour and Odour - - - - 2 Suspended Solids (mg/1) 100 600 200 a. For Process waste water – 100 b. For Cooling water effluent 10% above total suspended matterof influent cooling water. 3 Particle size of Suspended Solids Shall pass 850 micron I.S.Sieve - - a. Floatable Solids maximum 3 mm b. Settlable solids maximum 850 microns. 4 Dissolved Solids (inorganic) mg/1 2100 2100 2100 - 5 pH value 5.5 to 9 5.5 to 9 5.5 to 9 5.5 to 9
  • 20. 6 Temperature 45°C at the point of discharge 45°C at the point of discharge - 45°C at the point of discharge 7 Oil & Grease mg/1 10 20 10 20 8 Total Residual Chlorine mg/1 1.0 - - 1.0 9 Ammonical Nitrogen(asN0mg/1 50 50 - 50 10 Total Kjeldahl Nitrogen(asN) mg/1 100 - - 100 11 Free Ammonia (as NH3) mg/1 5.0 - - 5.0 12 Bio chemical oxygen demand (3 days at 27°C) mg/1 30 350 100 100 13 Chemical oxygen demand mg/1 250 - - 250 14 Arsenic (as As)mg/1 0.2 0.2 0.2 0.2 15 Mercury (as Hg) mg/1 0.01 0.01 0.01 0.01 16 Lead (as Pb) mg/1 0.1 1.0 1.0 1.0 17 Cadmium (as Cd) mg/1 2.0 1.0 1.0 2.0 18 Hexavalent Chromium (as Cr+6) mg/1 0.1 2.0 0.1 0.1 19 Total Chromium (as Cr) mg/1 2.0 2.0 2.0 1.0 20 Copper (as Cu) mg/1 3.0 3.0 3.0 3.0 21 Zinc (as Zn) mg/1 3.0 3.0 3.0 3.0 22 Selenium (as Se) mg/1 0.05 0.05 0.05 0.05 23 Nickel (as Ni) mg/1 3.0 3.0 3.0 3.0 24 Boron (as B) mg/1 2.0 2.0 2.0 2.0 25 Percent Sodium% - 60 60 - 26 Residual Sodium Carbonate mg/1 - - 5.0 - 27 Cyanide (as CN) mg/1 0.2 2.0 0.2 0.2 28 Chloride (as CI) mg/1 1000 1000 600 - 29 Flouride (as F) mg/1 2.0 1.5 2.0 1.5 30 Dissolved Phosphates (as P) mg/1 5.0 - - - 31 Sulphates (asSO4) mg/1 1000 1000 1000 1000 32 Sulphide (as S) mg/1 2.0 - 2.0 Absent
  • 21. NATIONAL AMBIENT AIR QUALITY STANDARDS [NAAQS Notification dated 18th November, 2009] Concentration in Ambient Air S.No Pollutant Time Weighted Average Industrial Residential, Rural and Other Area Ecologically Sensitive Area (notified by Central Government) Methods of Measurement (1) (2) (3) (4) (5) (6) 1 Sulphur Dioxide (SO2 ), µg/m3 Annual* 24 hours** 50 80 20 80 1. Improved West and Gaeke 2. Ultraviolet Fluorescence 2 Nitrogen Dioxide (NO2) µg/m3 Annual* 24 hours** 40 80 30 80 1. Modified Jacob &Hochheiser (Na- Arsenite) 2. Chemiluminesence 3 Particulate Matter (size less than 10µm) or PM10 µg/m3 Annual* 24 hours** 60 100 60 100 1. 1. Gravimetric 2. 2. TOEM 3. 3. Beta Attenuation 4 Particulate Matter (size less than 2.5µm) or PM2.5 µg/m3 Annual* 24 hours** 40 60 40 60 1. Gravimetric 2. TOEM 3. Beta Attenuation 5 Ozone (O3) µg/m3 8 hours* 1 hour** 100 180 100 180 1. UV Photometric 2. Chemilminescene 3. Chemical Method 6 Lead (Pb)µg/m3 Annual* 24 hours** 0.50 1.0 0.50 1.0 1. AAS/ICP method after sampling on EPM 2000 or equivalent filter paper 2. ED-XRF using Teflon filter 7 Carbon Monoxide (CO) mg/m3 8 hours** 1 hours ** 02 04 02 04 1.Non DispensiveInfra Red (NDIR) 2.Spectroscopy 8 Ammonia (NH3)µg/m3 Annual* 24 hours** 100 400 100 400 1. Chemiluminescene 2. Indophenol blue method
  • 22. 9 Benzene (C6H6)µg/m3 Annual* 05 05 1. Gas chromatography based continuous analyzer 2. Adsorption and Description followed by GC analysis 10 Benzo(a)Pyrene(BaP) – particulate phase only, ng/m3 Annual* 01 01 1. Solvent extraction followed by HPLC/GC analysis 11 Arsenic (As),ng/m3 Annual* 06 06 1. AAS/ICP method after sampling on EPM 2000 or equivalent filter paper 12 Nickel (Ni),ng/m3 Annual* 20 20 1. AAS/ICP method after sampling on EPM 2000 or equivalent filter paper * Annual arithmetic mean of minimum 104 measurements in a year at a particular site Twice a week 24 hourly at uniform intervals. ** 24 hourly or 08 hourly or 01 hourly monitored values, as applicable, shall be complied with 98% of the time in a year. 2% of the time, they may exceed the limits but not on two consecutive days of monitoring. (Note. – Whenever and wherever monitoring results on two consecutive days of monitoring exceed the limits specified above for the respective category, it shall be adequate reason to institute or continuous monitoring and further investigation.) AMBIENT NOISE STANDARDS AS PER“NOISEPOLLUTIONRULES, 2000” Area code Category of Area Limit in dB(A) Leq Day Time (6 am-10pm) Night Time (10pm- 6am) A Industrial Area 75 70
  • 23. B Commercial Area 65 55 C Residential Area 55 45 D Silence Zone 50 40 GENERAL EMISSION STANDARDS FOR STACK S.No. Parameter Standard Concentration not to exceed (in mg/Nm3 ) 1. Particulate Matter (PM) 150 2. Total Fluoride 25 3. Asbestos 4 Fibers/cc and dust should not be more than 2 mg/Nm3 4. Mercury 0.2 5. Chlorine 15 6. Hydrochloric acid vapour and mist 35 7. Sulphuric acid mist 50 8. Carbon monoxide 1% max.(v/v) 9. Lead 10 mg/Nm3 3.1.4 AIR POLLUTION INDEX: An Air Pollution Index is defined as a scheme that transforms the values of individual air pollution related parameters into a single number or set of numbers. 3.1.4.1 DETERMINATION OF AIR POLLUTION INDEX: There are several methods and equations available for determining the air pollution index For these, the following equation was used.
  • 24. API = 3 1        XNO x SOSPM S NO S SO S SPM 2 2 X 100 Where SSPM, SSO2, SNOX represents the ambient air quality standards for particulars matter, Sulphur dioxide and nitrogen dioxide respectively. 3.1.4.2 RATING SCALE FOR INDICES: A typical rating scale used is given below: Rating Scales for API Air pollution index Air pollution level Remarks 0-25 Clean air Good 26-50 Light air pollution Acceptable 51-75 Moderate air pollution Unsatisfactory 75-100 Heavy air pollution Unhealthy
  • 25. RESULT AND DISCUSSION In Coimbatore District, SIDCO is located at 10°55’11”N latitude and 76°57’35”E longitude which comprises of industrial cluster. This industrial area is located at distance of 7 km from Coimbatore Corporation Boundary. This industrial cluster area spreads over an area of about 180 acres. AAQ (Ambient Air Quality) of SIDCO Industrial area for two years, April 2014-March 2015 and April 2015-March 2016 were determined and compared with each other as well as with National Ambient Air Quality Standards. The following table shows the Monthly concentration of particulate and gaseous contaminants in SIDCO Industrial area, Coimbatore. National Ambient Air Quality Standards: TSPM (Total Suspended Particulate Matter) 500* (µg/m3) RPM (Respirable Particulate Matter) 150* (µg/m3) Sulphur di-oxide (SO2) 80^ (µg/m3) Nitrogen oxides (NOx) 80^ (µg/m3) * National Ambient Air Quality Standards for ambient air have been prescribe by Central Pollution Control Board vide Gazette Notification dated 11th April1994 for Industrial area. ^ National Ambient Air Quality Standards for ambient air have been prescribe by Central Pollution Control Board vide Gazette Notification dated 18th November 2009 for Industrial area
  • 26. On comparing the yearly average value of parameters such as TSPM, RPM, SO2 and NOX in SIDCO Industrial area, following results were obtained. AAQ 1: The yearly average TSPM value for April 2014-March 2015 and April 2015-March2016 are observed as 241.35 µg/m3 and 255.55 µg/m3 respectively. The yearly average RPM value for April 2014-March 2015 and April 2015-March2016 are observed as 79.079 µg/m3 and 82.713 µg/m3 respectively. The yearly average SO2 value for April 2014-March 2015 and April 2015-March2016 are observed as 9.5642 µg/m3 and 11.869 µg/m3 respectively. The yearly average NOx value for April 2014-March 2015 and April 2015-March2016 are observed as 15.83 µg/m3 and 18.403 µg/m3 respectively. The percentage increase of TSPM over a period of two years (2014-2016) = 5.86 % The percentage increase of RPM over a period of two years (2014-2016) = 4.59 % The percentage increase of SO2 over a period of two years (2014-2016) = 24.09 % The percentage increase of NOx over a period of two years (2014-2016) = 16.25 % AAQ 2: The yearly average TSPM value for April 2014-March 2015 and April 2015-March2016 are observed as 251.9 µg/m3 and 302.4 µg/m3 respectively. The yearly average RPM value for April 2014-March 2015 and April 2015-March2016 are observed as 83.16 µg/m3 and 96.65 µg/m3 respectively. The yearly average SO2 value for April 2014-March 2015 and April 2015-March2016 are observed as 10.65 µg/m3 and 13.082 µg/m3 respectively. The yearly average NOx value for April 2014-March 2015 and April 2015-March2016 are observed as 16.75 µg/m3 and 19.978 µg/m3 respectively.
  • 27. The percentage increase of TSPM over a period of two years (2014-2016) = 20.247 % The percentage increase of RPM over a period of two years (2014-2016) = 16.22% The percentage increase of SO2 over a period of two years (2014-2016) = 22.83% The percentage increase of NOx over a period of two years (2014-2016) = 19.27% AAQ 3: The yearly average TSPM value for April 2014-March 2015 and April 2015-March2016 are observed as 253.21 µg/m3 and 293.28 µg/m3 respectively. The yearly average RPM value for April 2014-March 2015 and April 2015-March2016 are observed as 84.259 µg/m3 and 94.85 µg/m3 respectively. The yearly average SO2 value for April 2014-March 2015 and April 2015-March2016 are observed as 11.024 µg/m3 and 12.786 µg/m3 respectively. The yearly average NOx value for April 2014-March 2015 and April 2015-March2016 are observed as 17.053 µg/m3 and 18.968 µg/m3 respectively. The percentage increase of TSPM over a period of two years (2014-2016) = 15.86% The percentage increase of RPM over a period of two years (2014-2016) = 12.56% The percentage increase of SO2 over a period of two years (2014-2016) = 13.98% The percentage increase of NOx over a period of two years (2014-2016) = 11.22% AIR POLLUTION INDEX: LOCATION 2014-2015 2015-2016 AAQ 1 26.67 29.65 AAQ 2 28.21 33.93 AAQ 3 28.57 32.78 The Air Pollution Index (API) was computed for the selected monitoring stations. From the results, the Air Pollution Index was found to be between 26 and 50 indicating Light Air Pollution.
  • 28. SUMMARY AND CONCLUSION A Comprehensive survey of air quality was carried out in SIDCO industrial area. Based on the results obtained following conclusions were made. Even though the levels of all the air quality parameters are within the permissible limits as prescribed by CPCB for this industrial area. The increase in percentage level of these parameters is quite high when compared to previous years. Hence necessary steps are to be taken by the industries in order to mitigate the particulate and gaseous emissions from various industrial activities parameters. Following suggestion can be taken to reduce the present pollutant level.  Energy efficiency measures such as replacement of old machineries, use of renewable energies can be encouraged.  Construction of green belt around the industry  Proper emission control strategies must be adopted in order to control the various industrial emissions, so that pollutant concentrations are contained and does not exceed the prescribed limits  Maintenance of pollution control equipments in industries
  • 29. REFERENCES 1.Mohammed Siraj Ansari, J. Sharpudin., ”Assessment of Ambient Air Quality in SIDCO Industrial Cluster–Coimbatore, from December 2012 to May 2013” International journal for research in emerging science and technology, volume– 1, issue- 7, December 2014. 2. U.S. Environmental Protection Agency. "Air Quality Criteria for Oxides of Nitrogen," Report No. EPA-600/8-82-026 (1982a). 3. U. S. Environmental Protection Agency. "Air Quality Criteria for Particulate Matter and Sulfur Oxides," Report No. EPA-600/8-82-029 (1982b). 4. Meenakshi, P., M.K. Saseetharan, September 2003, ”Analysis of Seasonal Varation of Suspended Particulate Matter and Oxides of Nitrogen with reference to Wind Direction in Coimbatore City”., IE (I) journal. EN Vol. 84 5. Palanivel, M., T.Elayaraja, D.Ganeshmoorthy, N.Jagadeeswaran, and K.Kalaiselvi “ Impact of Foundry Units On Coimbatore Environment” in Martin J. Bunch, V. Madha Suresh and T. Vasantha Kumar, eds., Proceedings of the Third International Conference on Environment and Health, Chennai, India, 15-17 December, 2003. Chennai: Department of Geography, University of Madras and Faculty of Environmental Studies, York University. Pages 322-327. 6. Vedamadavan, “Assessment of Ambient Air Quality in Coimbatore City”, Civil and Environmental Research Vol 2, No.1, 2012. 7. Schwela, D.H. 2000. Air pollution and health in urban area: Reviews. Env. Health. 15: 13-42. 8. Kalabokas P.D., 2010, “Atmospheric PM10 particle concentration measurements at Central and peripheral urban sites in athens and Thessaloniki, Greece, Global NEST Journal, Vol 12, No 1, pp 71-83. 9. Wiederkehr, P., Yoon, S.-J., 1998. Air Quality Indicators, in: Fenger, J., Hertel, O., Palmgren, F. (Eds.), Urban Air Pollution, European Aspects. Kluwer Academic Publisher, Dordrecht, pp. 403-418. 10. Ahmed Haytham A. Air Quality in Egypt August 1999, Air Quality Monthly Report, Monthly report, August 1999 11. Avinish Chauhan, Mayank Pawar, 2010, “Assessment of Ambient Air Quality Status In Urbanization, Industralisation And Commercial Centers Of Utharkand(India) “ .,New York Science Journal ; 3(7) 12. http://www.cpcb.nic.in/