FISB Infographic Long Form
•
0 gostou•95 visualizações

2021 Gaming Industry Statistics and Trend in the US

Recomendados
Recomendados
Mais conteúdo relacionado
Mais procurados
Mais procurados (20)
Semelhante a FISB Infographic Long Form
Semelhante a FISB Infographic Long Form (20)
Mais de Forest Interactive
Mais de Forest Interactive (20)
Último
Último (20)
FISB Infographic Long Form
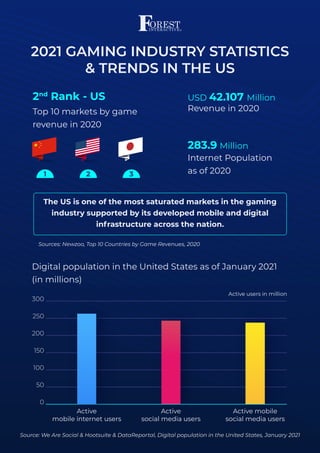
- 1. 2021 GAMING INDUSTRY STATISTICS & TRENDS IN THE US 2nd Rank - US USD 42.107 Million Revenue in 2020 Top 10 markets by game revenue in 2020 Digital population in the United States as of January 2021 (in millions) Internet Population as of 2020 283.9 Million 0 50 100 150 200 250 300 1 2 3 Active mobile internet users Active social media users Active mobile social media users Sources: Newzoo, Top 10 Countries by Game Revenues, 2020 Active users in million Source: We Are Social & Hootsuite & DataReportal, Digital population in the United States, January 2021 The US is one of the most saturated markets in the gaming industry supported by its developed mobile and digital infrastructure across the nation.
- 2. 298 million 61% of consumers in the US prefer to play games via smartphones consumers are using smartphones in the US 52% game consoles 49% personal computers Smartphone app usage by type in the US 2020 Games Messenger apps Email services Social media apps Internet browser 0% 10% 20% 30% 40% 50% 60% 70% 80% 75% 70% 68% 62% 65% Share of respondents. Number of respondents = 3805. Source: Statista Global Consumer Survey 2020 Subsribers in millions as of 2020 Mobile operating system used by US gamers in 2020: 52% use Android 44% use iOS Mobile Operators in the US: Source: Companies’ Annual Reports 0 50 100 150 200 AT&T Verizon T-Mobile US Cellular Gaming is one of the top 5 reasons consumers use their smartphones.
- 3. Hours played per week by US gamers According to a Facebook report on gaming, new users that are just starting on gaming are most likely to spend more time and money on what they are playing compared to existing gamers. This means maintaining existing gamers are important but it’s also very important to groom and generate new gamers. Average revenue per user by segment 0 50 100 150 200 2017 2018 2019 2020 2021 2022 2023 2024 2025 Total Game Downlaods Gaming Networks Mobile Games Online Games US New gamers Existing gamers 13.1 10.9 95.92 50,77 53,32 56,63 60,45 64,45 68,33 71,86 74,91 77,46 39,37 37,59 35,72 33,93 32,40 31,25 30,51 30,12 29,95 103,45 111,79 121,30 131,21 140,76 149,43 156,93 163,19 in USD (US$) Source: Statista, Forecast of Video Games ARPU by segment in the World from 2017 to 2025, as of June 2021
- 4. Average monthly spending for Existing gamers: 17 USD New gamers: 27.2 USD According to Facebook Gaming, 89% of consumers globally (not limited to gamers) are concerned with going into a physical store because of the pandemic, despite safety measures. This explains the increase in the online transaction volume. Source: Facebook, Games Marketing Insight for 2021, 2021. Device gamers use to purchase games 30% of consumers prefer to use mobile wallet as a payment method in 2020 30% also prefer credit card Computer Smart speaker On a game console In-person Over the phone Other 42% 33% 14% 48% 44% 16% 0% Mobile
- 5. Top reasons for spending money on games 42% To complete a game item/gear collection 43% To make the game exciting again 41% To personalize my character/account 36% To complete a game item/gear collection 41% To make the game exciting again 33% To remove ads New Gamers Top 3 reasons for spending Existing Gamers Top 3 reasons for spending Source: Facebook, Games Marketing Insight for 2021, 2021.
- 6. For more information, visit forest-interactive.com @Forest Interactive 2021 @ForestInteractive INTRODUCING Mobile Operator Solutions: Direct Carrier Billing Forest interactive’s Direct Carrier Billing (DCB) is a Platform-as-a-Service (PAAS) that gives users the best purchasing experience in both online and mobile environments. It allows users to make purchases by charging payments to their mobile phone bill.