Tax Chartbook 2016
•
0 gostou•234 visualizações

Where does your tax dollars go? Who pays federal taxes? What are tax expenditures? We explain the U.S. federal tax system in a few easy-to-understand charts. See more resources at http://www.fixthedebt.org/tax-reform-resource-page

Recomendados
Recomendados
Mais conteúdo relacionado
Mais procurados
Mais procurados (20)
Semelhante a Tax Chartbook 2016
Semelhante a Tax Chartbook 2016 (20)
Mais de Fix the Debt Campaign
Mais de Fix the Debt Campaign (20)
Último
Último (20)
Tax Chartbook 2016
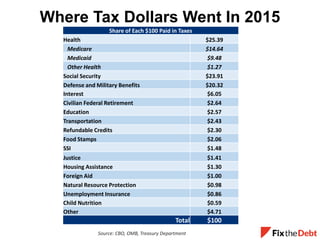
- 1. Share of Each $100 Paid in Taxes Health $25.39 Medicare $14.64 Medicaid $9.48 Other Health $1.27 Social Security $23.91 Defense and Military Benefits $20.32 Interest $6.05 Civilian Federal Retirement $2.64 Education $2.57 Transportation $2.43 Refundable Credits $2.30 Food Stamps $2.06 SSI $1.48 Justice $1.41 Housing Assistance $1.30 Foreign Aid $1.00 Natural Resource Protection $0.98 Unemployment Insurance $0.86 Child Nutrition $0.59 Other $4.71 Total $100 Where Tax Dollars Went In 2015 Source: CBO, OMB, Treasury Department
- 2. Where Does The Federal Government’s Money Come From? Individual income and payroll taxes cover over two- thirds of government spending. In 2016, one-seventh of the government’s spending will be financed by deficits. Individual Income $1,626 Payroll $1,099 Deficit $534 Other $309 Corporate Income $329 Billions Source: Congressional Budget Office, March 2016 budget projections.
- 3. Who Pays Federal Taxes? Source: Congressional Budget Office, “The Distribution of Household Income and Federal Taxes, 2011.” Bottom 20% 0.6% Second 20% 4% Middle 20% 9% Fourth 20% 18% 81st to 99th Percentiles 45% Top 1% 24% The top 20% of households pay almost 70% of the nation’s taxes. The top 1% is responsible for paying nearly a quarter. Percentage of all federal taxes paid, by household income
- 4. $0 $200 $400 $600 $800 $1,000 $1,200 $1,400 $1,600 1974 1978 1982 1986 1990 1994 1998 2002 2006 2010 2014 2018 Actual ProjectedTax Reform Act of 1986 Inflation-adjusted dollars There is now twice as much money in “tax expenditures” – deductions, credits, and other tax breaks – as there was after Congress last overhauled the tax code in 1986. Tax Breaks Have Grown Over Time Source: U.S. Department of the Treasury, compiled by the National Priorities Project.
- 5. 14% 16% 18% 20% 22% 24% 26% 1992 1994 1996 1998 2000 2002 2004 2006 2008 2010 2012 2014 2016 2018 2020 2022 2024 2026 Revenues 50 Year Avg. Spending = 20.2% Actual 50 Year Avg. Revenues = 17.4% Spending Projected Revenues Don’t Cover Spending Percent of GDP Source: Congressional Budget Office, March 2016 budget projections.
- 6. Tax Expenditures aren’t part of the budget that Congress passes every year, but are similar to government spending programs. Think about it: $1,000 given out in Pell grants and $1,000 given out through education tax credits will both give $1,000 to students. If they were counted as a normal part of the budget, tax expenditures would be a quarter of spending. Tax Expenditures: Another Kind of Spending Source: Congressional Budget Office, Joint Committee on Taxation Individual and Corporate Tax Expenditures 25% Other 10% Interest 5% Non-Defense Discretionary 12% Defense Discretionary 11% Health Care 20% Social Security 17%
- 7. $0 $20 $40 $60 $80 $100 $120 $140 Housing* Education** Income Support*** Tax Expenditures Program Spending Billions, FY2014 Tax Expenditures Rival Spending Programs in Size *Spending represented by HUD Budget. Source: Office of Management and Budget, President’s Budget FY 2016; Joint Committee on Taxation **Spending represented by Pell Grants. Source: Joint Committee on Taxation *** Refundable credits include EITC and Child Tax Credit. Spending includes SSI,TANF, and Foster Care Assistance. Source: HHS, SSA
- 8. 0.0% 0.2% 0.4% 0.6% 0.8% 1.0% 1.2% 1.4% 1.6% 1.8% MEG Model, Low Change In Employment MEG Model, High Change In Employment OLG Model Low Estimate High Estimate The Tax Reform Act of 2014 would have increased the size of the economy by between 0.1 percent and 1.6 percent by 2023. Tax Reform Promotes Economic Growth Source: Joint Committee on Taxation Additional GDP Growth After 10 Years