SlideShare uma empresa Scribd logo
1 de 22
Locating People at Risk
Extents of flood with different
exceedance probabilities
Population with different
probabilities to be affected by flood
Population at Risk Annual Probability
Population at Risk (by return
period)
Risk Curve
Interpolated interim Return Periods
Application of methodology - Thane District – India
RP Pop Cumulated Pop % Pop
25 662497.78 662497.78 6.0%
50 74338.64 736836.42 6.7%
100 69165.72 806002.15 7.3%
200 79145.58 885147.73 8.0%
1000 186301.29 1071449.02 9.7%
25 years RP 1000 years RP
EM-DAT Historical Records Flood
EM-DAT Historical Data
Are coordinates within
the country boundary?
http://www.geonames.org/search.html?q=tegucigalpa&country=Honduras
http://www.geonames.org/search.html?q=Comayagua&country=Honduras
http://www.geonames.org/search.html?q=Valle de Angeles&country=Honduras
http://www.geonames.org/search.html?q=Choluteca&country=Honduras
Tegucigalpa,-87.20681,14.0818
Choluteca,-87.19083,13.30028
Valle de Angeles,-87.03333,14.15
Comayagua,-87.6375,14.45139
Geocoding historical accidents
YES NO
India geocoding of Accidents (~1000 Cases EM-DAT)
Total of 1100 events with a successful matching of 950
Cameroon geocoding of Accidents (~50 Cases EM-DAT)
Total of 46 events with a successful matching of 38
Colombia geocoding of Accidents (~500 Cases EM-DAT)
Total of 502 events with a successful matching of 475
Risk profiling of all 86 WFP countries
Honduras geocoding of Accidents (~120 Cases EM-DAT)
High Risk
Historical Records
Medium Risk
Historical Records
No Risk
Precipitation Pattern
Precipitation Data (FAO)
AugustJuneJanuary
Calculation
Comparing historical precipitation patterns and accidents
Peru
Correlating Precipitation and Floods Monthly
Global CorrelationClasses Cases Percentage Level
>0.9 56 0.49%Very Highly Correlated
0.7-0.9 1381 12.19%Highly Correlated
0.5-0.7 3442 30.38%Moderately Correlated
0.3-0.5 1962 17.32%Low Correlation Significant Correlation 60.38%
<0.3 4488 39.62%Little Correlation Unignificant Correlation 39.62%
tot 11329
0.49%
12.19%
30.38%
17.32%
39.62%
Very Highly Correlated Highly Correlated Moderately Correlated Low Correlation Little Correlation
Percentage of Correlation
People at risk for 25 years Return Period (WFP Countries)
EM-DAT Historical Data Registered Occurrences
Correlation between occurrences and precipitation
National Calculations Admin2 Calculations
Example Table of all Adm2 calculated values
All GAUL administrative levels codesISO3 All GAUL administrative levels Reliability
Database structure
Annual Population at risk
Correlation between precipitation and historical accidents
Registered Flood occurrences (EM-DAT)
WFP country polygons containing ISO,GAUL and GADM codes
Monthly precipitation values (mm) from FAO
Monthly precipitation values normalized (-1/+1)
Ancillary data for assigning countries to WFP operational areas
Annual Population at risk divided by month

Mais conteúdo relacionado

Semelhante a Flood Hazard Assessment - Final

Early warning Systems for Vector Borne Climate Sensitive Diseases to Improve...
Early warning Systems for Vector Borne Climate Sensitive Diseases to  Improve...Early warning Systems for Vector Borne Climate Sensitive Diseases to  Improve...
Early warning Systems for Vector Borne Climate Sensitive Diseases to Improve...
Nanyingi Mark
 
Changes_in_vegetation_and_rainfall_patterns_in_subSaharan_Africa_over_the_las...
Changes_in_vegetation_and_rainfall_patterns_in_subSaharan_Africa_over_the_las...Changes_in_vegetation_and_rainfall_patterns_in_subSaharan_Africa_over_the_las...
Changes_in_vegetation_and_rainfall_patterns_in_subSaharan_Africa_over_the_las...
grssieee
 
Michael Hutchinson_Topographic-dependent modelling of surface climate for ear...
Michael Hutchinson_Topographic-dependent modelling of surface climate for ear...Michael Hutchinson_Topographic-dependent modelling of surface climate for ear...
Michael Hutchinson_Topographic-dependent modelling of surface climate for ear...
TERN Australia
 

Semelhante a Flood Hazard Assessment - Final (20)

Geospatial Tools for Targeting and Prioritisation in Agriculture
Geospatial Tools for Targeting and Prioritisation in AgricultureGeospatial Tools for Targeting and Prioritisation in Agriculture
Geospatial Tools for Targeting and Prioritisation in Agriculture
 
Joint GWP CEE/DMCSEE training: From Drought Management Strategies to Drought...
Joint GWP CEE/DMCSEE training: From Drought Management Strategies to  Drought...Joint GWP CEE/DMCSEE training: From Drought Management Strategies to  Drought...
Joint GWP CEE/DMCSEE training: From Drought Management Strategies to Drought...
 
Perspectives of predictive epidemiology and early warning systems for Rift Va...
Perspectives of predictive epidemiology and early warning systems for Rift Va...Perspectives of predictive epidemiology and early warning systems for Rift Va...
Perspectives of predictive epidemiology and early warning systems for Rift Va...
 
South Asia Drought Monitoring System (SADMS)
South Asia Drought Monitoring System (SADMS)South Asia Drought Monitoring System (SADMS)
South Asia Drought Monitoring System (SADMS)
 
Mapping hotspots of climate change and food insecurity across the global tropics
Mapping hotspots of climate change and food insecurity across the global tropicsMapping hotspots of climate change and food insecurity across the global tropics
Mapping hotspots of climate change and food insecurity across the global tropics
 
Climate change and internal displacement in countries of Latin-America and th...
Climate change and internal displacement in countries of Latin-America and th...Climate change and internal displacement in countries of Latin-America and th...
Climate change and internal displacement in countries of Latin-America and th...
 
DoD Poster Howell 2010
DoD Poster Howell 2010DoD Poster Howell 2010
DoD Poster Howell 2010
 
Flood forecasting presentation final
Flood forecasting presentation finalFlood forecasting presentation final
Flood forecasting presentation final
 
ICT for Disaster Risk Management-Managing Disaster Information-Global Risk Id...
ICT for Disaster Risk Management-Managing Disaster Information-Global Risk Id...ICT for Disaster Risk Management-Managing Disaster Information-Global Risk Id...
ICT for Disaster Risk Management-Managing Disaster Information-Global Risk Id...
 
Integración de la información climática para la previsión de riesgos
Integración de la información climática  para la previsión de riesgosIntegración de la información climática  para la previsión de riesgos
Integración de la información climática para la previsión de riesgos
 
Responding to Natural Disasters: The Role of Space Based Information
Responding to Natural Disasters: The Role of Space Based InformationResponding to Natural Disasters: The Role of Space Based Information
Responding to Natural Disasters: The Role of Space Based Information
 
Early warning Systems for Vector Borne Climate Sensitive Diseases to Improve...
Early warning Systems for Vector Borne Climate Sensitive Diseases to  Improve...Early warning Systems for Vector Borne Climate Sensitive Diseases to  Improve...
Early warning Systems for Vector Borne Climate Sensitive Diseases to Improve...
 
Policies, Programmes and Traditional Coping Mechanisms_Raju, ICSAR_16 October...
Policies, Programmes and Traditional Coping Mechanisms_Raju, ICSAR_16 October...Policies, Programmes and Traditional Coping Mechanisms_Raju, ICSAR_16 October...
Policies, Programmes and Traditional Coping Mechanisms_Raju, ICSAR_16 October...
 
Changes_in_vegetation_and_rainfall_patterns_in_subSaharan_Africa_over_the_las...
Changes_in_vegetation_and_rainfall_patterns_in_subSaharan_Africa_over_the_las...Changes_in_vegetation_and_rainfall_patterns_in_subSaharan_Africa_over_the_las...
Changes_in_vegetation_and_rainfall_patterns_in_subSaharan_Africa_over_the_las...
 
EcoTas13 Hutchinson e-MAST ANU
EcoTas13 Hutchinson e-MAST ANUEcoTas13 Hutchinson e-MAST ANU
EcoTas13 Hutchinson e-MAST ANU
 
Climate and crop modeling by Gummadi Sridhar,Gizachew Legesse,Pauline Chiveng...
Climate and crop modeling by Gummadi Sridhar,Gizachew Legesse,Pauline Chiveng...Climate and crop modeling by Gummadi Sridhar,Gizachew Legesse,Pauline Chiveng...
Climate and crop modeling by Gummadi Sridhar,Gizachew Legesse,Pauline Chiveng...
 
Michael Hutchinson_Topographic-dependent modelling of surface climate for ear...
Michael Hutchinson_Topographic-dependent modelling of surface climate for ear...Michael Hutchinson_Topographic-dependent modelling of surface climate for ear...
Michael Hutchinson_Topographic-dependent modelling of surface climate for ear...
 
Available data for crop modelling
Available data for crop modelling Available data for crop modelling
Available data for crop modelling
 
Google Earth Engine: Health Applications of Google’s Cloud Platform for Big E...
Google Earth Engine: Health Applications of Google’s Cloud Platform for Big E...Google Earth Engine: Health Applications of Google’s Cloud Platform for Big E...
Google Earth Engine: Health Applications of Google’s Cloud Platform for Big E...
 
DSD-INT 2019 Adding value and user context - Werner
DSD-INT 2019 Adding value and user context - WernerDSD-INT 2019 Adding value and user context - Werner
DSD-INT 2019 Adding value and user context - Werner
 

Flood Hazard Assessment - Final

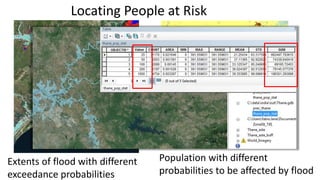
  • 1. Locating People at Risk Extents of flood with different exceedance probabilities Population with different probabilities to be affected by flood
  • 2. Population at Risk Annual Probability Population at Risk (by return period) Risk Curve Interpolated interim Return Periods
  • 3. Application of methodology - Thane District – India RP Pop Cumulated Pop % Pop 25 662497.78 662497.78 6.0% 50 74338.64 736836.42 6.7% 100 69165.72 806002.15 7.3% 200 79145.58 885147.73 8.0% 1000 186301.29 1071449.02 9.7% 25 years RP 1000 years RP
  • 6. Are coordinates within the country boundary? http://www.geonames.org/search.html?q=tegucigalpa&country=Honduras http://www.geonames.org/search.html?q=Comayagua&country=Honduras http://www.geonames.org/search.html?q=Valle de Angeles&country=Honduras http://www.geonames.org/search.html?q=Choluteca&country=Honduras Tegucigalpa,-87.20681,14.0818 Choluteca,-87.19083,13.30028 Valle de Angeles,-87.03333,14.15 Comayagua,-87.6375,14.45139 Geocoding historical accidents YES NO
  • 7. India geocoding of Accidents (~1000 Cases EM-DAT) Total of 1100 events with a successful matching of 950
  • 8. Cameroon geocoding of Accidents (~50 Cases EM-DAT) Total of 46 events with a successful matching of 38
  • 9. Colombia geocoding of Accidents (~500 Cases EM-DAT) Total of 502 events with a successful matching of 475
  • 10. Risk profiling of all 86 WFP countries
  • 11. Honduras geocoding of Accidents (~120 Cases EM-DAT) High Risk Historical Records Medium Risk Historical Records No Risk Precipitation Pattern
  • 14. Comparing historical precipitation patterns and accidents Peru
  • 16. Global CorrelationClasses Cases Percentage Level >0.9 56 0.49%Very Highly Correlated 0.7-0.9 1381 12.19%Highly Correlated 0.5-0.7 3442 30.38%Moderately Correlated 0.3-0.5 1962 17.32%Low Correlation Significant Correlation 60.38% <0.3 4488 39.62%Little Correlation Unignificant Correlation 39.62% tot 11329 0.49% 12.19% 30.38% 17.32% 39.62% Very Highly Correlated Highly Correlated Moderately Correlated Low Correlation Little Correlation Percentage of Correlation
  • 17. People at risk for 25 years Return Period (WFP Countries)
  • 18. EM-DAT Historical Data Registered Occurrences
  • 19. Correlation between occurrences and precipitation
  • 21. Example Table of all Adm2 calculated values All GAUL administrative levels codesISO3 All GAUL administrative levels Reliability
  • 22. Database structure Annual Population at risk Correlation between precipitation and historical accidents Registered Flood occurrences (EM-DAT) WFP country polygons containing ISO,GAUL and GADM codes Monthly precipitation values (mm) from FAO Monthly precipitation values normalized (-1/+1) Ancillary data for assigning countries to WFP operational areas Annual Population at risk divided by month