
![A government change that began to unfold last year in
the U.S., and economic and political turmoil else-
where, did not curb spending on environmental needs
pushed by global demographic trends and natural
events. Even with budget constraints and delayed con-
tracting, ENR’s Top 200 Environmental Firms saw
their revenue grow 3.8% in 2015 to $53.4 billion. En-
vironmental regulation drew fire for its impact on con-
struction schedules, but it spurred innovation—and
growth—last year for many listed companies.
The strength of the American economy was evi-
dent, as U.S.-generated revenue rose 10.7% to $41.4
billion—over the $40 billion mark for the first time in
four years—but revenue beyond its borders fell by the
same proportion, to $11.86 billion. A full-year of im-
pacts from the continuing oil-price slide predictably
hurt environmental work in resource-heavy Australia
and Canada, with Top 200 revenue totals down in those
countries by 51% and 18%, respectively. But Europe
rebounded from its market falloff last year, as revenue
generated there rose by 20%. Whether that strength
is sustainable in the continent’s post-Brexit era—since
the U.K. voted in June to leave the European Union—
is anyone’s guess.
“If Republicans win in November’s presidential
election, [party nominee Donald] Trump could
threaten continued U.S. involvement in the Paris [cli-
mate change] Agreement and has threatened to dis-
solve the EPA if he gets into the White House,” says
one Top 200 engineering firm CEO. He adds that
while the World Bank predicts only modest global
economic growth of 2.9% in 2016, “it’s an improve-
ment” on the 2.4% in 2015. But he adds, “In the U.K.,
Brexit is a concern, triggering a greater level of caution
and even indecision among some client organizations.”
Project delays and cancellations in the oil-and-gas
sector likely kept private-sector revenue growth nearly
stagnant for the Top 200, up just 0.08% last year, al-
though that sector remains firms’ largest client group,
accounting for $24.2 billion in revenue.
Some companies see the power sector, spurred by
demand and developing environmental rulemaking, as
the new catalyst. “Energy, mining and steel industries
are down, but utilities are spending more,” says Dean
Pisani, CEO of ENTACT LLC. Burns & McDonnell
says new U.S. power industry mandates to handle coal
combustion residuals will result in substantial added
work. “A very significant surge in coal-fired power plant
retirements and [residuals] pond closures are generating
significant near-term market opportunity,” adds Gregg
Nickel, senior vice president of Great Lakes Dredge
and Dock. “If the regulations stay in place [after the
election], we see positive impacts for environmental
service providers in the power generation industry.”
“From an
engineering
standpoint, the
Flint problem is
not all that
difficult. It’s
aquatic
chemistry we
all take in
college. But It
has sensitized
the public to
ask: ‘Is our
water safe?’
The good news
is that we have
an answer.”
Marshall Davert,
Americas-Asia
president for
government and
infrastructure,
MWH Global
Looking at Markets
THE TOP 200 ENVIRONMENTAL FIRMS
60 Ⅲ ENR Ⅲ August 8/15, 2016 enr.com
Comparing the Past
Decade’s Top 200
Firm Revenue
$51.7
2012
$53.7
2013
$42.2
2006
$46.3
2007
$53.0
2008
$48.3
2009
$51.3
2010
$51.4
2014
$54.4
2011
(in $ billions) SOURCE: ENR DATA
$53.4
2015
Nuclear
Waste
$5,777.1
10.8%
Waste
Water
$8,728.1
16.3%
Environmental
Science
$4,760.7 8.9%
SOURCE: ENR DATA
(Measured $ millions)
Other
$1,203.5
2.2%
Environmental
Management
$4,263.2 7.9%
Water
Supply
$11,654.4
21.7%
Hazardous
Waste
$14,180.4
26.4%
Air
$3,061.7
5.7%
% of total environmental
services revenue
Firms Reporting Profit
Firms Reporting Loss
Number of Firms
Reporting Profitability Change
175
15
U.S.
Other Global
Top 200 Environmental Firms’ Revenue
(in $ billions)
41.3
11.9
53.4
Total
* Not all firms provided domestic/international breakdowns.
ENR0808-08152016_EF_Top200_Story.indd 60 8/9/16 11:58 AM](data:image/gif;base64,R0lGODlhAQABAIAAAAAAAP///yH5BAEAAAAALAAAAAABAAEAAAIBRAA7)
Recomendados
Recomendados
Mais conteúdo relacionado
Mais procurados
Mais procurados (20)
Destaque
Destaque (20)
Semelhante a 0815FINAL.FULLPDFTop200
Semelhante a 0815FINAL.FULLPDFTop200 (20)
0815FINAL.FULLPDFTop200
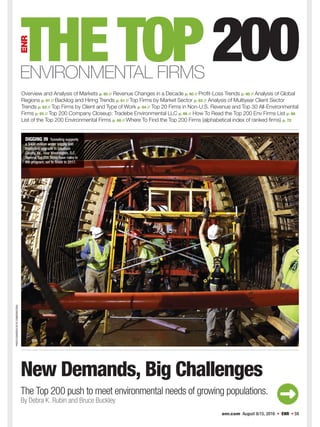
- 1. New Demands, Big Challenges The Top 200 push to meet environmental needs of growing populations. By Debra K. Rubin and Bruce Buckley Overview and Analysis of Markets p. 60 // Revenue Changes in a Decade p. 60 // Profit-Loss Trends p. 60 // Analysis of Global Regions p. 61 // Backlog and Hiring Trends p. 61 // Top Firms by Market Sector p. 63 // Analysis of Multiyear Client Sector Trends p. 63 // Top Firms by Client and Type of Work p. 64 // Top 20 Firms in Non-U.S. Revenue and Top 30 All-Environmental Firms p. 65 // Top 200 Company Closeup: Tradebe Environmental LLC p. 66 // How To Read the Top 200 Env Firms List p. 66 List of the Top 200 Environmental Firms p. 68 // Where To Find the Top 200 Firms (alphabetical index of ranked firms) p. 72 PHOTOCOURTESYOFPCCONSTRUCTION enr.com August 8/15, 2016 Ⅲ ENR Ⅲ 59 ENVIRONMENTAL FIRMS DIGGING IN Tunneling supports a $400-million water supply and treatment upgrade in Loudoun County, Va., near Washington, D.C. Several Top 200 firms have roles in the program, set to finish in 2017. 0815_top200ef_intro.indd 59 8/9/16 12:03 PM
- 2. A government change that began to unfold last year in the U.S., and economic and political turmoil else- where, did not curb spending on environmental needs pushed by global demographic trends and natural events. Even with budget constraints and delayed con- tracting, ENR’s Top 200 Environmental Firms saw their revenue grow 3.8% in 2015 to $53.4 billion. En- vironmental regulation drew fire for its impact on con- struction schedules, but it spurred innovation—and growth—last year for many listed companies. The strength of the American economy was evi- dent, as U.S.-generated revenue rose 10.7% to $41.4 billion—over the $40 billion mark for the first time in four years—but revenue beyond its borders fell by the same proportion, to $11.86 billion. A full-year of im- pacts from the continuing oil-price slide predictably hurt environmental work in resource-heavy Australia and Canada, with Top 200 revenue totals down in those countries by 51% and 18%, respectively. But Europe rebounded from its market falloff last year, as revenue generated there rose by 20%. Whether that strength is sustainable in the continent’s post-Brexit era—since the U.K. voted in June to leave the European Union— is anyone’s guess. “If Republicans win in November’s presidential election, [party nominee Donald] Trump could threaten continued U.S. involvement in the Paris [cli- mate change] Agreement and has threatened to dis- solve the EPA if he gets into the White House,” says one Top 200 engineering firm CEO. He adds that while the World Bank predicts only modest global economic growth of 2.9% in 2016, “it’s an improve- ment” on the 2.4% in 2015. But he adds, “In the U.K., Brexit is a concern, triggering a greater level of caution and even indecision among some client organizations.” Project delays and cancellations in the oil-and-gas sector likely kept private-sector revenue growth nearly stagnant for the Top 200, up just 0.08% last year, al- though that sector remains firms’ largest client group, accounting for $24.2 billion in revenue. Some companies see the power sector, spurred by demand and developing environmental rulemaking, as the new catalyst. “Energy, mining and steel industries are down, but utilities are spending more,” says Dean Pisani, CEO of ENTACT LLC. Burns & McDonnell says new U.S. power industry mandates to handle coal combustion residuals will result in substantial added work. “A very significant surge in coal-fired power plant retirements and [residuals] pond closures are generating significant near-term market opportunity,” adds Gregg Nickel, senior vice president of Great Lakes Dredge and Dock. “If the regulations stay in place [after the election], we see positive impacts for environmental service providers in the power generation industry.” “From an engineering standpoint, the Flint problem is not all that difficult. It’s aquatic chemistry we all take in college. But It has sensitized the public to ask: ‘Is our water safe?’ The good news is that we have an answer.” Marshall Davert, Americas-Asia president for government and infrastructure, MWH Global Looking at Markets THE TOP 200 ENVIRONMENTAL FIRMS 60 Ⅲ ENR Ⅲ August 8/15, 2016 enr.com Comparing the Past Decade’s Top 200 Firm Revenue $51.7 2012 $53.7 2013 $42.2 2006 $46.3 2007 $53.0 2008 $48.3 2009 $51.3 2010 $51.4 2014 $54.4 2011 (in $ billions) SOURCE: ENR DATA $53.4 2015 Nuclear Waste $5,777.1 10.8% Waste Water $8,728.1 16.3% Environmental Science $4,760.7 8.9% SOURCE: ENR DATA (Measured $ millions) Other $1,203.5 2.2% Environmental Management $4,263.2 7.9% Water Supply $11,654.4 21.7% Hazardous Waste $14,180.4 26.4% Air $3,061.7 5.7% % of total environmental services revenue Firms Reporting Profit Firms Reporting Loss Number of Firms Reporting Profitability Change 175 15 U.S. Other Global Top 200 Environmental Firms’ Revenue (in $ billions) 41.3 11.9 53.4 Total * Not all firms provided domestic/international breakdowns. ENR0808-08152016_EF_Top200_Story.indd 60 8/9/16 11:58 AM
- 3. Partner Engineering & Science Inc. CEO Joe Derhake says a strenghening commercial real estate sector has boosted refinancing that will create greater demand for his firm’s environmental due diligence activity. But the push to meet environmental infrastructure needs driven by population shifts and changing user demand was clear in government sectors, with firms reporting revenue from state and local work up 3% last year to $17 billion—32%of the total. Federal work rose 26% to $12 billion, reversing recent declines. The water supply crisis in Flint, Mich., that became a na- tional focus began developing last year as details of state and local decisionmaking unfolded. Some esti- mate the cost to fix the city’s leaded-tainted supply lines at up to $100 million. “Aging infrastructure needs to be addressed and states and municipalities are figuring out funding mechanisms—with or without federal help,” says John W. Braccio, CEO of Wright-Pierce. “Environmental regulations will continue to drive the market.” Changing Players Making its last independent appearance on the list in 2016 is ninth-ranked water-sector giant MWH Global, which was acquired by Canada-based Stantec, No. 18, earlier this year to expand the parent firm’s worldwide market reach and add construction management at-risk services for the first time, on water-related projects in the U.S. and the U.K. AECOM benefitted from market diversity in gain- ing the No. 1 slot on the Top 200, in its first full year of revenue since the late 2014 acquisition of former list giant URS Corp. That firm’s strength in government nuclear and hazardous waste markets propelled AECOM’s proportion of federal revenue to 40% in 2015, from 9% on the 2014 pre-acquisition Top 200 list. Senior Vice President Mark Morris says the firm’s Looking at Global Regions OVERVIEW PHOTOBYDAVIDGURALNICK/DETROITNEWSVIAAP enr.com August 8/15, 2016 ENR 61 SOURCE: ENR DATA (Measured $ millions) Africa $95.1 0.8% Middle East $531.1 4.5% Latin America $1,791.4 15.1% Asia $498.1 4.2% Australia / New Zealand $1,149.2 9.7% Europe $3,334.5 28.1% Canada $4,462.7 37.6% % = percentage of total non-U.S. market Environmental Firms Reporting Hiring Changes Source: ENR DATA Environmental Firms Reporting Backlog Changes Increase Decrease No Change (According to firms reporting)24 49 104 111 26 61 2001 Revenue 2008 Revenue 2015 Revenue Regional Changes Canada 2001 Revenue 2008 Revenue 2015 Revenue Europe 2.3 4.4 .057 4.01 3.34 1.96 Source: ENR DATA (Measured $ billions) Source: ENR DATA (Measured $ millions) PUSH Work on a new water source line in Flint, Mich., was rushed in the wake of its contamination crisis. ENR0808-08152016_EF_Top200_Story.indd 61 8/9/16 11:58 AM
- 4. The Top Firms by Market enr.com August 8/15, 2016 ENR 63 The Top Firms by Market Segment THE TOP 200 ENVIRONMENTAL FIRMS WATER TREAT. / SUPPLY Top 20 Revenue: $9.35 Billion Share of Total Sector Revenue: 80.2% 2016 2015 $ MIL. 1 6 BECHTEL 1552.0 2 ** TETRA TECH 1094.5 3 4 SUEZ 868.1 4 3 CH2M 836.0 5 2 AECOM 726.9 6 6 MWH GLOBAL 547.4 7 8 THE WALSH GROUP LTD. 511.7 8 ** AEGION CORP. 476.1 9 7 KIEWIT CORP. 441.2 10 9 GARNEY HOLDING CO. 396.9 11 12 CDM SMITH 391.9 12 18 ARCADIS NV 361.3 13 11 VEOLIA NORTH AMERICA 316.9 14 10 BLACK & VEATCH 292.0 15 13 LAYNE CHRISTENSEN CO. 267.4 16 14 PCL CONSTRUCTION ENTERPRISES 243.8 17 17 STANTEC INC. 168.1 18 15 HDR 143.2 19 ** RICE LAKE CONSTRUCTION GROUP 116.5 20 ** KOKOSING INC. 107.8 HAZARDOUS WASTE Top 20 Revenue: $9.86 Billion Share of Total Sector Revenue: 69.5% 2016 2015 $ MIL. 1 1 CLEAN HARBORS INC. 2,358.0 2 5 AECOM 1,282.8 3 2 VEOLIA NORTH AMERICA 924.4 4 3 ARCADIS NV 602.2 5 4 CH2M 567.5 6 7 NORTHSTAR GROUP SERVICES INC. 554.5 7 6 BECHTEL 529.3 8 8 AMEC FOSTER WHEELER 473.3 9 ** TRADEBE ENVIRON. SERVICES 427.6 10 9 CB&I 352.5 11 11 GHD 303.9 12 10 PARSONS CORP. 242.5 13 ** TETRA TECH INC. 218.9 14 12 NATIONAL RESPONSE CORP. 182.7 15 14 ENV. RESOURCES MANAGEMENT (ERM) 175.9 16 ** CLEAN EARTH INC. 175.4 17 17 ENTACT LLC 166.3 18 ** TRC COS. INC. 162.6 19 18 GEOSYNTEC CONSULTANTS INC. 159.3 20 13 CDM SMITH 157.2 WASTEWATER TREATMENT Top 20 Revenue: $5.84 Billion Share of Total Sector Revenue: 67% 2016 2015 $ MIL. 1 1 VEOLIA NORTH AMERICA 818.8 2 3 MWH GLOBAL 628.5 3 2 CH2M 625.0 4 6 CDM SMITH 442.3 5 7 BLACK & VEATCH 354.4 6 9 SUEZ 347.3 7 5 AECOM 342.1 8 8 LAYNE CHRISTENSEN CO. 319.7 9 10 THE WALSH GROUP LTD. 287.8 10 20 HDR 219.7 11 15 GARNEY HOLDING CO. 213.7 12 ** LYLES CONSTRUCTION GROUP 211.2 13 11 BROWN AND CALDWELL 177.3 14 14 PC CONSTRUCTION 175.6 15 ** KIEWIT CORP. 160.6 16 ** CAROLLO ENGINEERS INC. 133.4 17 17 CLEAN HARBORS INC. 131.0 18 ** BOWEN 129.3 19 ** HAZEN & SAWYER 126.3 20 ** KOKOSING INC. 121.0 AIR QUALITY Top 10 Revenue: $2.1 Billion Share of Total Sector Revenue: 68.5% 2016 2015 $ MIL. 1 1 VEOLIA NORTH AMERICA 528.2 2 2 BECHTEL CORP. 404.8 3 ** AECOM 324.8 4 ** MCCARTHY HOLDINGS INC. 236.6 5 5 ALBERICI/FLINTCO 154.8 6 4 BLACK & VEATCH 121.6 7 7 BARNARD CONSTRUCTION CO. INC. 95.6 8 ** TRINITY CONSULTANTS 86.2 9 ** PARSONS CORP. 83.7 10 ** ENV. RESOURCES MANAGEMNT (ERM) 76.6 NUCLEAR WASTE Top 10 Revenue: $5.47 Billion Share of Total Sector Revenue: 94.6% 2016 2015 $ MIL. 1 1 FLUOR CORP. 1,496.7 2 2 CH2M 1,273.4 3 3 BECHTEL CORP. 902.9 4 4 AECOM 726.9 5 ** BATTELLE 711.8 6 ** CB&I 105.2 7 5 NORTHSTAR GROUP SERVICES INC. 97.8 8 ** LOS ALAMOS TECHNICAL ASSOC. INC. 86.0 9 7 PARSONS CORP. 67.3 10 9 PERMA-FIX ENVIRONMENTAL SERVICES 49.9 ENVIRON. MANAGEMENT Top 10 Revenue: $2.22 Billion Share of Total Sector Revenue: 52% 2016 2015 $ MIL. 1 1 TETRA TECH INC. 437.8 2 ** CH2M 352.8 3 2 ENV. RESOURCES MANAGEMNT (ERM) 325.2 4 45 ANTEA GROUP 243.6 5 5 ARCADIS NV 214.1 6 6 AECOM 213.8 7 3 GOLDER ASSOCIATES 163.3 8 7 ICF INTERNATIONAL 134.8 9 8 CLEAN HARBORS 131.0 10 ** CB&I 123.3 ENVIRONMENTAL SCIENCE Top 10 Revenue: $2.9 Billion Share of Total Sector Revenue: 61% 2016 2015 $ MIL. 1 8 AECOM 559.5 2 2 HDR 458.5 3 1 TETRA TECH INC. 437.8 4 5 ENV. RESOURCES MANAGEMNT (ERM) 332.8 5 6 STANTEC INC. 280.2 6 9 WEEKS MARINE INC. 233.0 7 7 AMEC FOSTER WHEELER 214.6 8 3 GOLDER ASSOCIATES 197.1 9 10 ICF INTERNATIONAL 192.5 10 ** PARSONS CORP. 146.1 2001 2008 2015 Top 200 Environmental Firms’ Changing Client Trends (in $ billions) 22.3 24.2 12.6 17.217.0 10.1 13.5 12.0 9.98 Private Sector State / Local Federal SOURCE: ENR DATA OVERVIEW ENR0808-08152016_EF_Top200_Story.indd 63 8/9/16 11:59 AM
- 5. 64 ENR August 8/15, 2016 enr.com The Top Firms by Type of Client The Top Firms by Type of Work added scale and resources have “allowed AECOM to quickly ramp up” for site in- vestigation and remediation work. Hazardous waste remediation and management remains the largest single sector for Top 200 revenue—accounting for 26% of the total, and up 1% over last year. List newcomer Tradebe Environ- mental Services, a Spain-based waste- management and technology firm now moving into new global markets added significantly to that sector (see story, p. 66). Abatement and remediation firm Northstar Group Services also nudged up the list, with the full impact last year of its late 2014 purchase of sector specialist WRS. Other new entrants among the list’s Top 50 are water-wastewater treat- ment plant contractor Kokosing Inc. and federal nuclear-sector research and tech- nology developer Battelle, which returns after several years. Top 200 revenue in the nuclear waste cleanup and management sector rose 35% as work continued at federal sites and in nuclear powerplant decommissioning. Fluor Corp, CH2M, Bechtel and AE- COM maintained their top four rankings in that niche. Los Alamos Technical As- sociates, this year ranked at No. 8 among the top 10 sector firms. The cleanup con- tractor for the U.S. Energy Dept.’s former gaseous diffusion plant in Paducah, Ky., it completed demolition of the last of 32 inactive facilities at the complex as it re- turned to the government after commer- cial uranium enrichment operations stopped. Michael Kennicott, the firm’s chief operating officer, sees an improved nuclear waste market ahead, noting sev- eral new federal opportunities set for re- lease in the next 12 months, “with impact for the next five to 10 years.” Added Liquidity Comprising 38% of total Top 200 rev- enue, water and wastewater treatment and supply markets gained new momen- tum in 2015 for designers, builders and CONSTRUCT / REMEDIATION Top 10 Revenue: $7.38 Billion Share of Total Sector Revenue: 42.7% 2016 2015 $ MIL. 1 1 BECHTEL 1,619.0 2 2 FLUOR CORP. 1,225.8 3 3 AECOM 1,124.6 4 4 KIEWIT CORP. 649.2 5 6 THE WALSH GROUP LTD. 639.6 6 5 LAYNE CHRISTENSEN CO. 594.3 7 7 GARNEY HOLDING CO. 549.6 8 8 NORTHSTAR GROUP SERVICES INC. 502.3 9 ** AEGION CORP. 476.1 10 10 AMEC FOSTER WHEELER 432.3 ENGINEERING / DESIGN Top 10 Revenue: $5.92 Billion Share of Total Sector Revenue: 59.4% 2016 2015 $ MIL. 1 2 CH2M 1,261.6 2 3 BECHTEL 871.8 3 4 MWH GLOBAL 835.0 4 1 AECOM 761.1 5 6 TETRA TECH INC. 547.3 6 5 ARCADIS NV 488.4 7 9 CDM SMITH 387.9 8 8 BLACK & VEATCH 384.8 9 ** HDR 382.1 10 10 RAMBOLL ENVIRON INC. 375.1 CONSULTING / STUDIES Top 10 Revenue: $7.42 Billion Share of Total Sector Revenue: 60% 2016 2015 $ MIL. 1 2 CH2M 1,817.6 2 1 TETRA TECH INC. 1,532.3 3 3 AECOM 1488.0 4 4 ENV. RESOURCES MANAGEMNT (ERM) 633.5 5 5 ARCADIS NV 499.1 6 6 AMEC FOSTER WHEELER 449.1 7 8 ICF INTERNATIONAL 385.0 8 ** HDR 334.3 9 5 GOLDER ASSOCIATES 281.5 10 9 STANTEC INC. 259.2 CM / PM Top 10 Revenue: $3.23 Billion Share of Total Sector Revenue: 59.3% 2016 2015 $ MIL. 1 1 CH2M 755.4 2 ** BECHTEL 622.7 3 ** AECOM 564.4 4 ** CLEAN HARBORS 262.0 5 3 VEOLIA NORTH AMERICA 256.2 6 4 CDM SMITH 216.6 7 ** BATTELLE 208.3 8 ** CB&I 176.2 9 6 LOUIS BERGER 165.1 10 7 THE WALSH GROUP LTD. 159.9 PRIVATE Top 10 Revenue: $11.82 Billion Share of Total Sector Revenue: 48.9% 2015 2016 $ MIL. 1 1 CLEAN HARBORS INC. 2,227.0 2 2 VEOLIA NORTH AMERICA 2,010.0 3 3 BECHTEL CORP. 1,774.7 4 9 AECOM 1,402.4 5 4 TETRA TECH INC. 1,217.3 6 5 CH2M 1,008.5 7 6 ARCADIS NV 923.3 8 8 ENVIR. RESOURCES MANAGEMNT (ERM) 918.1 9 10 AMEC FOSTER WHEELER 597.4 10 ** NORTHSTAR GROUP SERVICES INC. 534.9 STATE / LOCAL Top 10 Revenue: $7.53 Billion Share of Total Sector Revenue: 44.2% 2016 2015 $ MIL. 1 2 AECOM 1,325.6 2 3 SUEZ 1,165.8 3 1 CH2M 1,165.8 4 4 MWH GLOBAL 810.9 5 5 THE WALSH GROUP LTD. 759.5 6 6 CDM SMITH 686.1 7 7 VEOLIA NORTH AMERICA 604.8 8 8 GARNEY HOLDING CO. 549.6 9 ** TETRA TECH INC. 547.3 10 9 AEGION CORP. 471.3 FEDERAL Top 10 Revenue: $8.55 Billion Share of Total Sector Revenue: 70.9% 2016 2015 $ MIL. 1 4 CH2M 1,748.6 2 1 AECOM 1,710.4 3 3 FLUOR CORP. 1,496.7 4 2 BECHTEL 1,338.8 5 ** BATTELLE 887.5 6 5 TETRA TECH INC. 525.4 7 8 KIEWIT CORP. 301.9 8 ** CB&I 282.8 9 6 AMEC FOSTER WHEELER 258.7 10 7 CDM SMITH 220.7 THE TOP 200 ENVIRONMENTAL FIRMS ENR0808-08152016_EF_Top200_Story.indd 64 8/9/16 11:59 AM
- 6. enr.com August 8/15, 2016 ENR 65 The Top 30 All-Environmental Firms The Top 20 Firms Working in Non-U.S. Locations REVENUE $ MIL. RANK 2016 2015 1 1 VEOLIA NORTH AMERICA 2,641.2 2 2 SUEZ 1,240.2 3 3 ENV. RESOURCES MANAGMNT (ERM) 945.5 4 5 NORTHSTAR GROUP SERVICES INC. 652.3 5 4 GARNEY HOLDING CO. 610.7 6 6 BROWN AND CALDWELL 341.0 7 10 CAROLLO ENGINEERS INC. 211.7 8 7 NATIONAL RESPONSE CORP. 203.0 9 11 HAZEN AND SAWYER 183.1 10 ** CLEAN EARTH INC. 175.4 REVENUE $ MIL. RANK 2016 2015 11 13 ENTACT LLC 166.3 12 12 SCS ENGINEERS 158.1 13 9 SEVENSON ENVIRON. SERVICES 139.3 14 15 APEX COS. LLC 139.0 15 8 ULLIMAN SCHUTTE CONSTRUCTION 133.1 16 ** ECOLOGY AND ENVIRONMENT INC. 126.7 17 ** TRINITY CONSULTANTS 112.0 18 ** PAL ENVIRONMENTAL SAFETY CORP. 104.4 19 25 USA ENVIRONMENT LP 104.0 20 19 ENVIRONMENTAL RESTORATION LLC 93.1 REVENUE $ MIL. RANK 2016 2015 21 26 SWCA ENVIR. CONSULTANTS 90.5 22 22 MAX FOOTE CONSTRUCTION CO. INC. 87.6 23 20 ANCHOR QEA LLC. 87.0 24 17 GROUNDWATER & ENV. SERVICES 85.0 25 ** KENNEDY/JENKS CONSULTANTS 84.1 26 29 ROUX ASSOCIATES INC. 80.3 27 ** ENVIROBUSINESS CONSULTING INC. 78.3 28 27 GREELEY AND HANSEN LLC 75.6 29 18 C.H. NICKERSON & CO. INC. 74.2 30 21 J.R. FILANC CONSTRUCTION CO. INC. 69.7 REVENUE $ MIL. RANK 2016 2015 1 1 BECHTEL 1,681.3 2 2 CH2M 1,507.0 3 3 TETRA TECH INC. 875.6 4 7 MWH GLOBAL 727.3 5 6 CLEAN HARBORS INC. 550.2 6 8 VEOLIA NORTH AMERICA 462.2 7 9 ENVIRONMENTAL RESOURCES MANAGEMENT INC. (ERM) 449.1 8 5 GOLDER ASSOCIATES 433.5 9 12 AECADIS NV 413.5 10 17 WSP/PARSONS BRINCKERHOFF 364.0 REVENUE $ MIL. RANK 2016 2015 11 15 FLUOR CORP 361.3 12 ** TRADEBE ENVIRONMENTAL SERVICES 323.8 13 10 STANTEC INC. 322.2 14 13 AMEC FOSTER WHEELER 315.5 15 11 BLACK & VEATCH 315.2 16 14 ANTEA GROUP 300.5 17 ** RAMBOLL ENVIRON 262.1 18 19 GHD 241.6 19 ** WORLEYPARSONS 232.8 20 ** CDM SMITH 143.1 others on the list. “Water deficiencies continue, whether it’s driven by drought or increasing demo- graphics,” says Marshall Davert, MWH Global president of government and infrastructure for the Americas and Asia. “That’s driving water supply portfolio planning.” Sector work is set to pick up in Canada, with the infusion of funding into infrastructure by the new Trudeau government to bolster oil-and-gas revenue declines, and by municipal and federal embrace of public-private partnership project delivery. Canada has “a standard value-for-money conversation that evalu- ates whether P3s make sense,” says Michael Orth, ex- ecutive vice president at Black & Veatch. While he sees similar potential in the U.S., “for some reason, there’s more of a control issue around water and wastewater assets that hasn’t embraced [P3], as you’ve seen in schools, roadways and judicial systems. I don’t have the reason why that is. But we are seeing some movement.” Jean-Louis Chaussade, CEO of France-based global water infrastructure management firm Suez, was bullish on global opportunity in a briefing to analysts last month. “In China, our growth is speed- ing up. Environmental worries are at the heart of the Chinese government’s development policies,” he said. He added that the firm is “preferred bidder” to operate the Carlsbad desalination plant in Cali- fornia, which was completed last fall and is the larg- est in the western hemisphere. Chaussade said in- vestment in the firm’s regulated water business in the U.S. has increased by 12% in the first half of the year compared to the same period in 2015. Peter Nichol, president of CH2M’s water business, sees opportunity in more advanced treatment and re- covery technology. “Where does wastewater treatment start versus water treatment?” he says. “We’re building factories today and our output is water. We continue to see opportunities for reuse, as the incoming quality that people are dealing with erodes. You can treat wastewater to fairly high degrees now, so a couple more steps isn’t a big leap.” Although the speed of municipal project movement varies in the U.S., some Top 200 firms still see a less competitively pressured water and wastewater sector. “In the U.S., our markets are very good, resulting in less competition for each project and allowing for higher margins,” says Ron Davoli, CEO of contractor Wharton-Smith, who also sees pickup in Caribbean markets that have been “dormant” for several years. While continuing fallout from the Flint crisis has OVERVIEW FIRMS REPORTING 100% OF TOTAL GROSS REVENUE IN ENVIRONMENTAL SERVICES Number of firms that see little or no change in markets in next 12 months 54 Amount of revenue total from construction and/or remediation 32% 10.7% DropinTop200 non-US revenuein2015 ENR0808-08152016_EF_Top200_Story.indd 65 8/9/16 11:59 AM
- 7. PHOTOCOURTESYOFTRADEBEENVIRONMENTALLLC 66 ENR August 8/15, 2016 enr.com resulted in criminal proceedings against Top 200 firm Veolia North America and other companies and engi- neers linked to the city’s system, some see a possible silver lining. “The Flint problem is not that difficult. It’s aquatic chemistry we all take in college,” says MWH’s Davert. “It has sensitized the public to ask the question: ‘Is our water safe?’ The good news is that we have an answer.” Experts predict more attention to management of data for improved environmental compliance and cap- ital investment. “The ability to gather more informa- tion in real time [with new databases and software helps with real-time control,” says Davert. “We’re doing quite a bit about how to use big data to be smart on the capital spend.” Industry publication Environmental Business Journal says the U.S. environmental infor- mation systems and services sector which generated $1.75 billion in 2015 revenue, “will grow faster in 2016 than in any previous year.” Neno Duplan, CEO of cloud-based environmental data management firm Locus Technologies, says “a confluence of climate change, clean water shortage and desire to lower op- erating expenses will drive the market to new highs.” On Aug. 8, Arcadis North America released its first “water index” of 50 global cities, which measures how well they are managing water as a sustainable urban asset. The consultancy says no U.S. cities placed in the top 10 in managing water resiliency issues that can af- fect economic development. According to its findings, Los Angeles ranks near the bottom of the list because of its susceptibility to drought, earthquakes and storms. “Cities that carefully and creatively use their water as- sets for strategic urban advantage will ultimately be more livable, safe and competitive,” says Michael MacPhee, president of the firm’s water business. “Con- tinuing to grow [a country’s] GDP is dependent on water,” adds Orth. “The solutions are there, and firms can play a key role in the conversation.” n Top 200 Company Closeup | By Bruce Buckley, with Debra K. Rubin With worldwide sales in hazardous waste recycling and management passing the half-billion-dollar mark last year and two-thirds beyond national borders, Barcelona-based Tradebe Environmental Services is emerging as a key global player after three decades in business. Reporting $517.5 mil- lion in total 2015 revenue, it debuts on the Top 200 list at No. 27. Through aggressive acquisition, Tradebe (pronounced TRA-DEB-E) now has operations—from waste treatment and remediation to emergency response—in Europe, the Middle East, South America and the U.S. CEO and key shareholder Josep Creixall was termed in a Spanish media report as “one of the stars” of a 2014 regional government mission to Brazil. The firm won a five-year contract there from Camargo Correa group to supply fuel from cement plant wastes. Tradebe touts its recycling technology, using green processes on 60% of treated waste. In the U.S., the firm says its patented Solids Distillation System (pictured)—doubled in size in February at an Indiana treatment site—uniquely extracts organics from hazardous waste solids to produce 2.7 million gal annually of reusable solvents. The firm banks heavily on oil-and-gas and petrochemical clients, landing Con- oco Philips among its first U.S. contracts. Tradebe says it grew 10.5% last year despite the oil-price crash, with 72 global treatment facilities and about 2,100 employees. “The last few years have seen the diversification and consolidation of our business,” said Creixell in the 2013-14 annual report. WasteFiresUpSpain’sTradebe Firms are ranked based on the % of 2015 gross revenue for environmental services. Figures are in $ millions; percents are rounded and may not add up to 100. A company update is marked by number in red, with a detailed footnote on the side of each list page. The list of firm subsidiary names is online at www.enr.com. Two asterisks (**) indicates firms not ranked on the 2015 Top 200 list. An alphabetical listing of firms can be found on p. 72. Hazardous/Solid Waste Chemical and industrial waste cleanup, management and/or disposal; asbestos and lead abatement; non-hazardous waste landfill and recycling facilities Nuclear Waste Nuclear or radioactive materials remediation, storage or disposal. Air Facility air-pollutant emissions; permitting and energy efficiency. Water Municipal or industrial water- system supply and treatment. Wastewater Treatment Municipal or industrial wastewater or stormwater sewers and treatment systems. Environmental Management Compliance, due diligence, audits and environmental information technology. Environmental Sciences Planning, EIS/EIRs, natural resources, wetlands, modeling Other Environmental markets not included in the above category descriptions. Clients: Work for these types of owners is shown as a % of environmental revenue: Private corporations, utilities or other. Federal U.S. agencies, military services or foreign governments. State, county or municipal government entities. Type of Firms: Based on the largest % of environmental revenue in categories described below. Multiple listings appear if the largest % is evenly split between two or more categories or within 5% of each other. How To Read the Top 200 List DES Engineering and/or design; CSL Consulting and/or studies; CON Construction, contracting and/or remediation; CM-PM Construction management and/or program management; EQP Equipment or device manufacture; OPS Contract operations; R&D Technology and/or research and development, OTH Services not already designated. THE TOP 200 ENVIRONMENTAL FIRMS OVERVIEW ENR0808-08152016_EF_Top200_Story.indd 66 8/9/16 11:59 AM
- 8. THE TOP 200 ENVIRONMENTAL FIRMS PRIVATE STATE/LOCAL FEDERAL OTHER ENV.SCIENCE ENV.MANAGEMENT WASTEWATERTRMT. WATER AIR NUCLEARWASTE HAZARDOUSWASTE MARKETS (% OF ENVIRONMENTAL REVENUE) LARGEST % OF ENV. REVENUE TYPE OF WORK % OF NON- U.S. % OF ALL FIRM REV. TOTAL (IN $ MIL.) 2015 ENVIRONMENTAL REVENUE RANK 2016 2015 CLIENTS (% OF ENV. REV.) 1 2 AECOM, Los Angeles, Calif. 4,276.0 24 28 CSL 30 17 9 17 8 5 13 1 40 31 29 2 1 CH2M, Englewood, Colo. 3,834.7 64 39 CSL 15 33 2 22 16 9 3 0 46 28 26 3 3 BECHTEL, San Francisco, Calif. 3,113.5 10 54 CON 17 29 13 37 2 0 0 2 43 0 57 4 4 VEOLIA NORTH AMERICA, Boston, Mass. 2,641.2 100 18 OTH/OPS 35 0 20 12 31 2 0 0 1 23 76 5 5 CLEAN HARBORS INC., Norwell, Mass.1 2,620.0 80 21 OTH 90 0 0 0 5 5 0 0 5 10 85 6 6 TETRA TECH INC., Pasadena, Calif. 2,189.0 96 40 CSL 10 0 0 50 0 20 20 0 24 25 51 7 8 FLUOR CORP., Irving, Texas 1,530.4 8 24 CON 0 98 2 0 0 0 0 0 98 0 2 8 7 ARCADIS NV, Amsterdam, Holland 1,338.2 35 31 CSL/DES 45 0 0 27 6 16 6 0 9 22 69 9 9 MWH GLOBAL, Broomfield, Colo.2 1,267.1 96 57 DES 0 0 2 43 50 4 1 0 6 64 30 10 10 SUEZ, Paramus, N.J. 1,240.2 100 6 OPS 2 0 0 70 28 0 0 0 0 94 6 11 11 AMEC FOSTER WHEELER, Alpharetta, Ga. 1,051.7 13 30 CSL/CON 45 2 3 4 2 4 20 20 25 19 57 12 13 CDM SMITH, Boston, Mass. 1,007.5 79 14 DES 16 0 2 39 44 0 0 0 22 68 10 13 16 HDR, Omaha, Neb. 955.2 45 11 DES/CSL 8 0 4 15 23 2 48 0 15 44 41 14 15 ENV. RESOURCES MANAGEMENT INC. (ERM), London, England, U.K. 945.5 100 48 CSL 19 0 8 0 4 34 35 0 2 1 97 15 ** BATTELLE, Columbus, Ohio 905.6 18 0 R&D 5 79 0 0 1 1 14 0 98 1 2 16 14 BLACK & VEATCH, Overland Park, Kan. 800.0 27 39 DES 3 0 15 37 44 1 0 0 3 50 47 17 19 THE WALSH GROUP LTD., Chicago, Ill. 799.5 16 4 CON 0 0 0 64 36 0 0 0 5 95 0 18 18 STANTEC INC., Edmonton, Alberta, Canada 700.5 31 46 DES 20 0 1 24 10 2 40 3 8 25 67 19 17 CB&I, The Woodlands, Texas 670.1 5 4 CON 53 16 6 0 0 18 7 0 42 17 41 20 21 KIEWIT CORP., Omaha, Neb. 666.5 7 0 CON 0 0 10 66 24 0 0 0 45 30 25 21 24 NORTHSTAR GROUP SERVICES INC., New York, N.Y. 652.3 100 10 CON 85 15 0 0 0 0 0 0 13 5 82 22 22 GARNEY HOLDING CO., Kansas City, Mo. 610.7 100 0 CON 0 0 0 65 35 0 0 0 0 90 10 23 20 PARSONS CORP., Pasadena, Calif. 606.3 17 14 DES 40 11 14 6 2 3 24 0 29 44 27 24 23 LAYNE CHRISTENSEN CO., The Woodlands, Texas 594.3 87 0 CON 0 0 0 45 54 1 0 0 0 38 61 25 12 GOLDER ASSOCIATES, Mississauga, Ontario, Canada 563.0 59 77 CSL 10 1 11 8 5 29 35 1 7 1 92 26 26 GHD, Sydney, NSW, Australia 506.4 40 48 CON/CSL 60 0 2 2 8 20 8 0 5 15 80 27 ** TRADEBE ENVIRONMENTAL SERVICES, Barcelona, Spain 506.0 97 64 OPS 85 0 0 0 4 1 2 9 2 3 95 28 25 AEGION CORP., St. Louis, Mo. 476.1 35 27 CON 0 0 0 100 0 0 0 0 1 99 0 29 27 RAMBOLL ENVIRON INC., Copenhagen, Denmark 468.8 29 56 DES 25 0 14 2 19 19 10 11 20 5 75 30 40 WSP | PARSONS BRINCKERHOFF, Montreal, Quebec, Canada 404.4 7 90 CON/CSL 15 0 5 25 20 10 25 0 9 15 76 31 29 ICF INTERNATIONAL, Farifax, Va.3 385.0 34 NA CSL 0 0 0 0 5 35 50 10 NA NA NA 32 28 ANTEA GROUP, Almere, Holland 384.3 15 78 CSL/CON 17 1 1 6 3 63 2 7 12 25 62 33 31 BROWN AND CALDWELL, Walnut Creek, Calif. 341.0 100 0 CSL 14 0 0 20 52 14 0 0 4 67 29 34 30 MCCARTHY HOLDINGS INC., St. Louis, Mo. 338.0 12 0 DES 0 3 70 23 4 0 0 0 0 50 50 35 37 WEEKS MARINE INC., Cranford, N.J. 330.0 45 25 CON 4 0 0 16 9 0 71 0 23 76 1 36 34 PCL CONSTRUCTION ENTERPRISES INC., Denver, Colo. 320.4 5 37 CON 0 0 0 76 24 0 0 0 1 99 1 37 33 LOUIS BERGER, Morristown, N.J. 313.9 32 45 CM-PM 36 0 0 31 10 12 11 0 50 30 20 38 38 TRC COS. INC., Lowell, Mass. 309.1 54 1 CSL 53 0 12 0 0 28 7 0 2 14 84 39 39 BARNARD CONSTRUCTION CO. INC., Bozeman, Mont. 302.5 59 38 CON 0 0 32 15 0 0 0 53 1 45 54 40 36 LEIDOS, Reston, Va. 280.3 6 1 CSL 33 8 26 0 0 12 10 12 58 17 25 41 66 WORLEYPARSONS, Sydney, NSW, Australia 261.5 4 89 CSL 32 0 0 7 2 37 22 0 2 7 91 42 48 PC CONSTRUCTION CO., South Burlington, Vt. 250.9 50 0 CON 0 0 0 30 70 0 0 0 5 95 0 43 47 GEOSYNTEC CONSULTANTS INC., Atlanta, Ga. 241.4 88 14 CSL/DES 66 6 3 4 10 7 4 0 9 9 82 44 62 LYLES CONSTRUCTION GROUP, Fresno, Calif. 236.0 88 0 CON 0 0 0 11 90 0 0 0 0 99 1 45 ** KOKOSING INC., Westerville, Ohio 228.8 22 0 CON 0 0 0 47 53 0 0 0 0 92 8 46 42 BOWEN, Indianapolis, Ind. 217.7 98 0 CON 0 0 31 10 59 0 0 0 0 10 90 47 41 ALBERICI/FLINTCO, St. Louis, Mo. 216.2 10 26 CON 0 0 72 15 14 0 0 0 0 14 86 48 52 CAROLLO ENGINEERS INC., Walnut Creek, Calif. 211.7 100 0 DES 0 0 0 37 63 0 0 0 1 95 4 49 46 NATIONAL RESPONSE CORP., Great River, N.Y. 203.0 100 25 OPS 90 0 0 0 0 5 5 0 5 20 75 50 50 BURNS & MCDONNELL, Kansas City, Mo. 193.6 7 5 DES 45 2 6 13 30 4 0 0 2 43 55 The Top 200 List FOOTNOTES:1TYPEOFWORKOTHFIRMREPORTSMOSTREVENUEINHAZARDOUSWASTETRANSPORTATIONANDDISPOSAL,ENVIRONMENTALCLEANINGANDEMERGENCYRESPONSE;2 MWHGLOBALWASACQUIREDIN2016BYSTANTEC,ALSORANKEDONTHETOP200LIST;3FIRMDECLINESTOREPORTREVENUEDATAFORCLIENTSECTORSORFORGLOBALLOCATIONS 68 ENR August 8/15, 2016 enr.com 0815_EF200_List.indd 68 8/8/16 1:14 PM
- 9. FOOTNOTES:1TYPEOFWORKOTHFIRMREPORTSMOSTREVENUEINHAZARDOUSWASTETRANSPORTATIONANDDISPOSAL,ENVIRONMENTALCLEANINGANDEMERGENCYRESPONSE;2 MWHGLOBALWASACQUIREDIN2016BYSTANTEC,ALSORANKEDONTHETOP200LIST;3FIRMDECLINESTOREPORTREVENUEDATAFORCLIENTSECTORSORFORGLOBALLOCATIONS LARGEST % OF ENV. REVENUE PRIVATE STATE/LOCAL FEDERAL OTHER ENV.SCIENCE ENV.MANAGEMENT WASTEWATERTRMT. WATER AIR NUCLEARWASTE HAZARDOUSWASTE MARKETS (% OF ENVIRONMENTAL REVENUE) TYPE OF WORK % OF NON- U.S. % OF ALL FIRM REV. TOTAL (IN $ MIL.) 2015 ENVIRONMENTAL REVENUE RANK 2016 2015 CLIENTS (% OF ENV. REV.) #45 KOKOSING INC. The Ohio contractor debuts on the 2016 Top 200; about one-quarter of its $1-billion revenue is in environmental construction. 51 44 WESTON SOLUTIONS INC., West Chester, Pa. 191.9 72 0 CSL 77 1 5 5 2 7 3 0 60 12 28 52 53 HAZEN AND SAWYER, New York, N.Y. 183.1 100 3 DES 0 0 0 31 69 0 0 0 0 98 2 53 45 GREAT LAKES DREDGE & DOCK, Oak Brook, Ill. 181.7 60 0 CON 60 0 0 0 0 0 0 40 4 9 87 54 54 CLEAN EARTH INC., Hatboro, Pa. 175.4 100 0 CON 100 0 0 0 0 0 0 0 8 37 55 55 57 ENTACT LLC, Westmont, Ill. 166.3 100 0 CON 100 0 0 0 0 0 0 0 0 0 100 56 113 BUREAU VERITAS, Fort Lauderdale, Fla. 164.0 40 0 CSL 17 0 11 2 5 65 0 0 4 5 91 57 64 RICE LAKE CONSTRUCTION GROUP, Deerwood, Minn. 161.8 74 18 CON 0 0 0 72 28 0 0 0 0 96 4 58 56 SCS ENGINEERS, Long Beach, Calif. 158.1 100 3 CSL 96 0 0 0 0 4 0 0 1 35 64 59 61 TERRACON CONSULTANTS INC., Olathe, Kan. 157.0 29 0 CSL 67 0 1 1 1 22 8 0 2 13 85 60 55 WOODARD & CURRAN, Portland, Maine 148.2 92 0 OPS/CSL/DES 16 0 2 14 38 26 0 4 0 44 56 61 60 OBG, Syracuse, N.Y.4 148.0 78 1 CSL/CM-PM 51 0 5 10 25 8 1 0 3 26 71 62 59 WHARTON-SMITH INC., Sanford, Fla. 140.7 63 0 CON 0 0 0 29 71 0 0 0 6 87 7 63 51 SEVENSON ENVIRONMENTAL SERVICES INC., Niagara Falls, N.Y. 139.3 100 0 CON 100 0 0 0 0 0 0 0 41 5 54 64 67 MICHAEL BAKER INTERNATIONAL, Pittsburgh, Pa. 135.4 27 0 CSL 5 0 0 58 12 0 25 0 46 44 10 65 68 APEX COS. LLC, Rockville, Md. 134.6 100 0 CM-PM/CON/CSL 26 0 1 2 31 20 20 0 1 12 87 66 49 ULLIMAN SCHUTTE CONSTRUCTION LLC, Miamisburg, Ohio 133.1 100 0 CON 0 0 0 15 85 0 0 0 7 93 0 67 71 ECOLOGY AND ENVIRONMENT INC., Lancaster, N.Y. 126.7 100 32 CSL/DES 31 1 2 1 3 32 31 0 32 27 41 68 43 KLEINFELDER, San Diego, Calif. 125.7 36 29 CM-PM 75 0 0 0 0 11 14 0 5 12 83 69 72 SNC-LAVALIN INC., Montreal, Quebec, Canada 124.4 2 99 CSL 1 0 3 6 0 3 87 0 10 25 65 70 79 LOS ALAMOS TECHNICAL ASSOCIATES INC., Albuquerque, N.M. 123.3 92 0 CON 28 70 0 0 1 1 1 0 98 2 0 71 75 EA ENGINEERING, SCIENCE, AND TECHNOLOGY INC., Hunt Valley, Md. 122.3 85 0 CSL/DES 52 1 1 2 6 17 21 0 61 23 16 72 ** C. OVERAA & CO., Richmond, Va. 121.6 49 0 CON 0 0 0 53 47 0 0 0 0 100 0 73 63 REMEDIAL CONSTRUCTION SERVICES L.P., Houston, Texas 114.6 83 29 CON 0 0 0 0 0 0 0 100 0 0 100 74 112 ECC, Burlingame, Calif. 114.4 37 15 CON 72 0 0 22 5 2 0 0 77 0 23 75 ** ATC GROUP SERVICES LLC, Lafayette, La. 112.7 65 0 CON 23 0 6 1 0 69 0 2 1 19 80 76 65 PEPPER CONSTRUCTION GROUP, Chicago, Ill. 112.3 10 0 CM-PM 6 0 0 38 56 0 0 0 0 94 6 77 78 TRINITY CONSULTANTS, Dallas, Texas 112.0 100 6 CSL 0 0 77 0 2 16 0 5 1 2 97 78 77 GILBANE BUILDING CO., Providence, R.I. 109.3 2 19 CON 35 15 2 40 0 3 5 0 76 13 11 79 70 ATKINS NORTH AMERICA, Tampa, Fla. 106.7 18 2 CSL 4 1 1 11 12 31 40 0 23 43 34 80 189 SUKUT CONSTRUCTION INC., Santa Ana, Calif. 104.7 38 0 CON 95 0 0 0 5 0 0 0 0 87 13 81 ** PAL ENVIRONMENTAL SAFETY CORP., Long Island City, N.Y. 104.4 100 0 CON 100 0 0 0 0 0 0 0 0 20 80 82 93 USA ENVIRONMENT LP, Deer Park, Texas 104.0 100 0 CON 91 9 0 0 0 0 0 0 1 2 97 83 76 HALEY & ALDRICH INC., Burlington, Mass. 100.5 70 0 CSL 65 3 5 3 5 15 4 0 1 1 98 84 87 CASCADE ENVIRONMENTAL LLC, Woodinville, Wash. 97.2 64 2 CSL 83 0 0 8 0 9 0 0 21 3 76 85 97 LANGAN ENG. AND ENV. SERVICES INC., Parsippany, N.J. 97.0 42 0 DES/CSL 50 0 2 2 6 20 20 0 1 2 97 86 82 ENVIRONMENTAL RESTORATION, St. Louis, Mo. 93.1 100 0 CON 100 0 0 0 0 0 0 0 68 4 28 87 94 SWCA ENVIRONMENTAL CONSULTANTS, Phoenix, Ariz. 90.5 100 0 CSL 0 0 1 6 0 46 47 0 7 13 80 88 86 MAX FOOTE CONSTRUCTION CO. LLC, Mandeville, La. 87.6 100 0 CON 0 0 0 17 84 0 0 0 0 95 5 89 83 ANCHOR QEA LLC, Seattle, Wash. 87.0 100 6 CSL 0 0 0 0 0 0 36 64 7 29 64 90 88 HYDROGEOLOGIC INC., Reston, Va. 87.0 99 1 CON 61 0 0 0 12 2 8 17 99 1 0 91 90 CIVIL & ENVIRONMENTAL CONSULTANTS INC., Pittsburgh, Pa. 85.2 71 1 DES 31 0 12 7 24 19 7 0 0 5 95 92 80 GROUNDWATER & ENV. SERVICES INC., Wall Township, N.J. 85.0 100 3 CON 25 2 2 8 21 37 5 0 4 6 90 93 98 KENNEDY/JENKS CONSULTANTS INC., San Francisco, Calif. 84.1 100 0 DES 15 0 1 30 42 2 10 0 1 70 29 94 109 NORTH WIND GROUP, Idaho Falls, Idaho 82.7 89 0 CON 60 20 0 0 0 7 12 0 94 2 5 95 104 ROUX ASSOCIATES INC., Islandia, N.Y. 80.3 100 1 CSL 70 0 0 0 5 5 5 15 0 3 97 96 91 GZA, Norwood, Mass. 79.6 66 1 CSL 35 0 5 2 2 13 39 5 0 8 92 97 95 SHOOK CONSTRUCTION CO., Dayton, Ohio 78.7 36 0 CON 0 0 0 100 0 0 0 0 0 100 0 98 ** ENVIROBUSINESS CONSULTING INC., Burlington, Mass. 78.3 100 0 CSL 13 0 1 1 0 81 4 0 3 3 94 99 85 HATCH GROUP, Mississauga, Ontario, Canada 77.8 6 71 DES 0 0 9 15 26 39 11 0 0 34 66 100 89 CROWDER CONSTRUCTORS INC., Charlotte, N.C. 76.2 32 0 CON 0 0 0 8 92 0 0 0 0 100 0 FOOTNOTE:4FORMERLYKNOWNASO’BRIEN&GERE enr.com August 8/15, 2016 ENR 69 0815_EF200_List.indd 69 8/8/16 1:14 PM
- 10. THE TOP 200 ENVIRONMENTAL FIRMS PRIVATE STATE/LOCAL FEDERAL OTHER ENV.SCIENCE ENV.MANAGEMENT WASTEWATERTRMT. WATER AIR NUCLEARWASTE HAZARDOUSWASTE MARKETS (% OF ENVIRONMENTAL REVENUE) LARGEST % OF ENV. REVENUE TYPE OF WORK % OF NON- U.S. % OF ALL FIRM REV. TOTAL (IN $ MIL.) 2015 ENVIRONMENTAL REVENUE RANK 2016 2015 CLIENTS (% OF ENV. REV.) 101 101 GREELEY AND HANSEN LLC, Chicago, Ill. 75.6 100 2 DES 0 0 0 15 85 0 0 0 0 95 5 102 58 ALLAN MYERS, Worcester, Pa. 75.2 11 0 CON 0 0 0 31 69 0 0 0 0 70 30 103 81 C.H. NICKERSON & CO. INC., Torrington, Conn. 74.2 100 0 CON 0 0 0 11 89 0 0 0 0 96 4 104 103 ENERCON SERVICES INC., Kennesaw, Ga. 73.5 25 0 CSL/DES/CON 17 6 7 0 0 29 41 0 21 7 72 105 108 THE CADMUS GROUP, Waltham, Mass. 72.5 90 1 CSL 0 0 0 40 0 0 0 60 25 10 65 106 84 J.R. FILANC CONSTRUCTION CO. INC., Escondido, Calif. 69.7 100 0 CON 0 0 0 43 49 0 0 8 21 78 0 107 130 NAVARRO RESEARCH AND ENGINEERING INC., Oak Ridge, Tenn. 69.4 75 0 CON 12 60 5 1 2 10 10 0 100 0 0 108 119 DUDEK, Encinitas, Calif. 68.7 100 0 CSL 8 0 5 9 10 23 45 0 0 41 59 109 92 ENVIRONMENTAL QUALITY MANAGEMENT INC., CincinnatI, Ohio 68.4 100 0 CON 70 0 15 0 5 10 0 0 80 5 15 110 142 CHARTER CONTRACTING CO. LLC, Boston, Mass. 68.0 100 0 CON 20 0 0 0 0 0 0 80 30 10 60 111 120 ENVIRONMENTAL SCIENCE ASSOCIATES, San Francisco, Calif. 67.4 100 0 CSL 0 0 1 1 2 3 93 0 3 58 39 112 115 TRIHYDRO CORP., Laramie, Wyo. 66.3 94 0 CSL 50 0 19 8 5 10 8 0 8 6 86 113 117 JUDY CONSTRUCTION CO., Cynthiana, Ky. 65.3 97 0 CON 0 0 0 31 69 0 0 0 0 100 0 114 134 AKRF INC., New York, N.Y. 64.8 100 0 CSL 20 0 5 5 10 10 50 0 0 60 40 115 111 GANNETT FLEMING, Camp Hill, Pa. 64.1 17 2 DES 15 0 0 56 19 2 8 0 10 50 40 116 153 M.B. KAHN CONSTRUCTION CO. INC., Columbia, Mass. 64.0 20 0 CON 0 4 0 80 16 0 0 0 0 79 21 117 116 WESTON & SAMPSON, Peabody, Mass. 62.6 94 0 DES 13 0 0 21 41 7 4 16 1 83 17 118 124 PERMA-FIX ENVIRONMENTAL, Atlanta, Ga. 62.4 100 2 OPS 15 80 0 0 0 5 0 0 65 2 34 119 127 GEI CONSULTANTS INC., Woburn, Mass. 60.7 42 0 CON/CSL/DES 69 0 1 4 1 17 6 4 1 7 92 120 133 HEPACO LLC, Charlotte, N.C. 60.4 100 0 OTH/CON 98 0 0 2 0 0 0 0 0 1 99 121 100 BRASFIELD & GORRIE LLC, Birmingham, Ala. 60.3 3 0 CON 0 0 0 83 17 0 0 0 0 89 11 122 121 BARR ENGINEERING CO., Minneapolis, Minn. 58.6 42 1 CSL 15 0 11 2 4 46 21 1 0 17 83 123 96 CROSSLAND HEAVY CONTRACTORS INC., Columbus, Kan. 56.7 67 0 OPS 0 0 0 62 38 0 0 0 0 100 0 124 131 ENSAFE INC, Memphis, Tenn. 56.2 99 1 CSL 16 0 3 0 2 71 4 5 13 28 59 125 114 HASKELL, Jacksonville, Fla. 56.0 10 0 CON 0 0 0 12 88 0 0 0 0 90 10 126 129 ESG OPERATIONS INC., Macon, Ga. 54.9 100 0 OPS 0 0 0 40 40 20 0 0 0 92 8 127 123 CAPE ENVIRONMENTAL MANAGEMENT INC., Norcross, Ga. 52.8 55 0 CON 81 0 0 4 5 9 0 0 85 5 10 128 144 PARTNER ENGINEERING AND SCIENCE INC., Torrance, Calif. 52.7 45 1 CSL 5 0 7 0 0 88 0 0 5 5 90 129 105 GSE CONSTRUCTION CO. INC., Livermore, Calif. 51.0 97 0 CON 0 0 0 47 53 0 0 0 0 82 18 130 141 INTERTEK–PSI, Oakbrook Terrace, Ill.5 50.5 5 0 CSL 45 0 0 0 0 45 10 0 5 15 80 131 159 ENGINEERING/REMEDIATION RESOURCES GROUP INC., Martinez, Calif. 50.5 100 0 CON 85 0 0 0 10 5 0 0 63 17 20 132 126 PORTAGE INC., Idaho Falls, Idaho 50.2 100 0 CON 0 85 0 0 0 15 0 0 100 0 0 133 139 KCI TECHNOLOGIES INC., Sparks, Md. 48.9 29 0 DES 5 0 0 23 35 0 21 16 0 90 10 134 146 ONEIDA TOTAL INTEGRATED ENTERPRISES (OTIE), Milwaukee, Wis. 48.2 78 9 CON 70 0 0 9 2 0 12 7 95 2 2 135 122 VERSAR INC., Springfield, Va. 46.6 29 1 CSL/CON/OPS 27 0 7 0 0 35 31 0 92 5 3 136 143 WADE TRIM, Detroit, Mich. 45.1 72 0 DES 0 0 0 31 64 0 5 0 1 79 20 137 125 GAI CONSULTANTS INC., Homestead, Pa. 44.0 33 0 CSL 11 0 0 4 4 0 76 5 3 6 91 138 148 WHITMAN, REQUARDT AND ASSOCIATES LLP, Baltimore, Md. 43.4 34 0 DES 0 0 0 35 45 0 20 0 0 100 0 139 168 CREAMER ENVIRONMENTAL INC., Cedar Grove, N.J. 43.1 100 0 CON 100 0 0 0 0 0 0 0 0 3 97 140 136 DEWBERRY, Fairfax, Va. 43.1 13 0 DES 6 0 3 25 53 6 7 0 25 65 10 141 150 WENCK ASSOCIATES INC., Maple Plain, Minn. 42.7 79 3 CSL 20 0 15 6 8 12 34 5 5 30 65 142 118 ET ENVIRONMENTAL CORP. LLC, Atlanta, Ga. 42.5 100 17 CM-PM 94 0 0 0 5 0 1 0 0 4 96 143 149 PRECISION ENVIRONMENTAL CO., Independence, Ohio 42.1 96 0 CON 100 0 0 0 0 0 0 0 10 12 78 144 156 S&ME INC., Raleigh, N.C. 41.8 26 0 CSL 30 0 2 0 2 40 26 0 5 20 75 145 158 ENVIRONMENTAL COMPLIANCE SERVICES INC., Agawam, Mass. 41.1 96 0 CON 88 0 1 0 0 11 0 0 5 25 70 146 147 COMANCO ENVIRONMENTAL CORP., Plant City, Fla. 40.3 100 0 CON 99 0 0 0 1 0 0 0 0 18 82 147 151 T&M ASSOCIATES, Middletown, N.J. 39.5 60 0 DES 20 0 5 10 30 30 5 0 2 70 28 148 ** INNOVATIVE CONSTRUCTION SOLUTIONS, Santa Ana, Calif. 39.1 90 0 CON 60 0 0 30 0 0 0 10 2 28 70 149 155 D&B ENGINEERS AND ARCHITECTS PC, Woodbury, N.Y. 39.0 94 0 DES 23 0 0 8 69 0 0 0 0 95 5 150 ** ARC ABATEMENT, Waco, Texas 38.5 94 0 CON 94 0 0 0 0 0 0 6 5 50 45 FOOTNOTE:5PSIWASACQUIREDIN2015BYINTERTEKGROUPPLC 70 ENR August 8/15, 2016 enr.com 0815_EF200_List.indd 70 8/8/16 1:15 PM
- 11. FOOTNOTE:5PSIWASACQUIREDIN2015BYINTERTEKGROUPPLC LARGEST % OF ENV. REVENUE PRIVATE STATE/LOCAL FEDERAL OTHER ENV.SCIENCE ENV.MANAGEMENT WASTEWATERTRMT. WATER AIR NUCLEARWASTE HAZARDOUSWASTE MARKETS (% OF ENVIRONMENTAL REVENUE) TYPE OF WORK % OF NON- U.S. % OF ALL FIRM REV. TOTAL (IN $ MIL.) 2015 ENVIRONMENTAL REVENUE RANK 2016 2015 CLIENTS (% OF ENV. REV.) #130 INTERTEK-PSI is the new entity formed last year by U.K.-based Intertek’s purchase of Illinois cleanup consultant PSI for $330 million. 151 135 SLAYDEN CONSTRUCTORS INC., Stayton, Ore. 38.4 62 0 CON 0 0 0 35 65 0 0 0 3 94 3 152 106 THE CONTI GROUP, Edison, N.J. 37.7 13 2 CON 30 0 0 70 0 0 0 0 76 6 18 153 161 FOTH COS., De Pere, Wis. 37.4 26 2 DES/CM-PM 31 0 11 2 6 1 49 0 1 25 74 154 154 TURNER SPECIALTY SERVICES LLC, Baton Rouge, La. 36.7 100 0 OPS 30 0 0 10 60 0 0 0 0 5 95 155 ** CABRERA SERVICES INC., East Hartford, Conn. 36.3 100 0 CON 6 69 0 0 5 12 8 0 97 0 3 156 160 TIGHE & BOND INC., Westfield, Mass. 34.2 72 0 DES/CSL 20 0 0 28 37 2 13 0 0 60 40 157 ** BSI EHS SERVICES AND SOLUTIONS, San Jose, Calif. 34.2 100 13 CSL 3 0 4 0 1 12 0 80 1 5 94 158 157 LEGGETTE, BRASHEARS & GRAHAM INC., Shelton, Conn. 33.9 100 0 CSL/CON 50 0 0 27 2 20 1 0 0 20 80 159 172 GRESHAM, SMITH AND PARTNERS, Nashville, Tenn. 33.9 22 0 DES 0 0 0 19 49 7 0 25 0 95 5 160 180 THE VERTEX COS. INC., Weymouth, Mass. 33.6 42 1 CSL 28 0 19 0 0 50 3 0 1 1 98 161 145 IREX CONTRACTING GROUP, Lancaster, Pa. 33.6 16 2 CON 88 0 0 0 0 12 0 0 7 0 93 162 177 PENNONI, Philadelphia, Pa. 33.2 20 0 CSL 40 0 5 15 5 5 5 25 5 25 70 163 167 ENVIROTRAC LTD., Yaphank, N.Y. 32.5 100 0 CON/CSL/DES 65 0 10 0 5 10 10 0 0 23 77 164 164 BUILDING CRAFTS INC., Wilder, Ky. 32.5 88 0 CON 0 0 0 24 76 0 0 0 0 85 15 165 169 STRAND ASSOCIATES INC., Madison, Wis. 32.3 46 0 DES 0 0 0 15 85 0 0 0 0 100 0 166 165 WRIGHT-PIERCE, Topsham, Maine 32.3 97 0 CON/DES 0 0 0 22 76 1 1 0 0 94 6 167 137 DLZ, Columbus, Ohio 32.0 31 0 DES 6 0 0 12 71 6 5 0 0 90 10 168 ** JOHNSON, MIRMIRAN & THOMPSON INC., Sparks, Md. 32.0 16 0 DES 0 0 0 8 41 23 28 0 2 98 1 169 173 VHB, Watertown, Mass. 31.7 17 0 CSL 7 0 2 0 10 3 78 0 3 33 64 170 152 BAY WEST LLC, St. Paul, Minn. 31.6 100 0 CON 93 0 3 0 2 2 0 0 72 14 14 171 188 EAGLE CONTRACTING, L.P., Fort Worth, Texas 31.1 100 0 CON 0 0 0 0 100 0 0 0 0 100 0 172 162 PARAMETRIX, Seattle, Wash. 30.3 51 0 DES/CSL 13 0 0 7 30 0 50 0 4 68 29 173 176 LOCUS TECHNOLOGIES, Mountain View, Calif. 29.6 100 5 R&D 10 5 0 0 0 0 0 85 15 0 85 174 186 LAND REMEDIATION INC., Averill Park, N.Y. 29.5 100 0 CON 100 0 0 0 0 0 0 0 5 5 90 175 197 JOHNSTON CONSTRUCTION CO., Dover, Pa. 29.0 100 0 CON 1 0 0 19 80 0 0 0 34 29 37 176 138 POSILLICO ENVIRONMENTAL INC., Farmingdale, N.Y. 28.8 11 0 CON 0 0 0 0 0 25 75 0 14 6 80 177 ** ENGINEERING CONSULTING SERVICES LTD., Chantilly, Va. 28.7 18 1 CSL 80 0 0 0 20 0 0 0 0 10 90 178 ** NORMANDEAU ASSOCIATES INC., Bedford, N.H. 28.6 100 0 CSL 40 0 0 0 0 50 10 0 5 15 80 179 175 RJN GROUP, INC., Wheaton, Ill. 28.5 100 0 DES 0 0 0 4 97 0 0 0 0 99 1 180 193 STV GROUP INC., New York, N.Y. 28.1 7 0 CSL 30 0 10 0 10 20 30 0 5 85 10 181 163 BURGESS & NIPLE INC., Columbus, Ohio 28.0 41 0 CSL 2 0 1 32 55 10 0 0 0 82 18 182 174 RMC WATER AND ENVIRONMENT, Walnut Creek, Calif. 27.3 100 0 CSL 0 0 0 64 31 0 5 0 0 100 0 183 181 POWER ENGINEERS INC., Hailey, Idaho 27.1 7 0 CSL 2 0 8 0 14 9 67 0 0 23 77 184 183 SCHNABEL ENGINEERING INC., Glen Allen, Va. 26.5 43 0 DES 2 0 0 87 6 0 5 0 12 51 37 185 171 AMERICAN CONTRACTING & ENV. SERVICES INC., Columbia, Md. 26.3 100 0 CON 6 0 0 23 72 0 0 0 9 91 0 186 190 HNTB COS., Kansas City, Mo. 26.2 3 0 DES 0 0 0 49 41 0 5 5 6 90 5 187 191 MCKIM & CREED INC., Raleigh, N.C. 25.8 51 0 DES 6 0 0 37 50 0 7 0 1 79 20 188 185 ENVIRONMENTAL CONSULTING & TECHNOLOGY INC., Gainesville, Fla. 24.2 100 0 CSL 37 0 7 0 19 12 25 0 1 29 70 189 ** PPM CONSULTANTS INC., Monroe, La. 23.6 100 0 CON 15 0 25 0 10 25 25 0 5 5 90 190 199 SHORT-ELLIOTT-HENDRICKSON (SEH), St. Paul, Minn. 23.5 22 0 DES 3 0 3 16 36 34 8 0 2 78 20 191 170 J.F. AHERN CO., Fond du Lac, Wis. 23.3 10 0 CON 0 0 5 15 80 0 0 0 0 90 10 192 ** INTERA INC., Austin, Texas 23.2 100 5 CSL 25 30 0 25 0 10 10 0 35 35 30 193 ** ABSCOPE ENVIRONMENTAL INC., Canastota, N.Y. 23.1 100 0 CON 90 5 0 0 5 0 0 0 5 10 85 194 178 STANLEY CONSULTANTS, Muscatine, Iowa 22.7 14 2 DES 15 0 40 11 27 7 0 0 2 30 68 195 179 CHESTER ENGINEERS INC., Moon Township, Pa. 22.5 98 0 DES 0 0 2 30 50 5 7 6 0 75 25 196 194 EARTHCON CONSULTANTS INC., Marietta, Ga. 22.4 100 17 CSL 60 0 2 0 5 12 5 16 1 5 94 197 ** JONES EDMUNDS & ASSOCIATES INC., Gainesville, Fla. 20.6 81 0 DES/CSL 11 0 2 8 42 18 19 0 11 83 6 198 198 SKELLY AND LOY INC., Harrisburg, Pa. 20.3 100 0 CSL 20 0 0 4 17 16 40 3 5 66 29 199 ** GRW ENGINEERS INC., Lexington, Ky. 20.2 63 0 DES 0 0 0 33 67 0 0 0 0 94 6 200 195 SLETTEN COS., Great Falls, Mont. 20.1 9 0 CON 0 0 0 0 98 0 0 2 0 98 2 enr.com August 8/15, 2016 ENR 71 0815_EF200_List.indd 71 8/8/16 1:15 PM
- 12. 72 ENR August 8/15, 2016 enr.com RANK RANK RANK RANKFIRM FIRMFIRM FIRM A Firm Name Company 000 Firm Name Company 000 Firm Name Company 000 Firm Name Company 000 Firm Name Company 000 Firm Name Company 000 Firm Name Company 000 Firm Name Company 000 Firm Name Company 000 Firm Name Company 000 Firm Name Company 000 Firm Name Company 000 Firm Name Company 000 Firm Name Company 000 Firm Name Company 000 Firm Name Company 000 Firm Name Company 000 Firm Name Company 000 B Firm Name Company 000 Firm Name Company 000 Firm Name Company 000 Firm Name Company 000 Firm Name Company 000 Firm Name Company 000 Firm Name Company 000 Firm Name Company 000 Firm Name Company 000 Firm Name Company 000 Firm Name Company 000 Firm Name Company 000 Firm Name Company 000 Firm Name Company 000 Firm Name Company 000 Firm Name Company 000 Firm Name Company 000 Firm Name Company 000 C Firm Name Company 000 Firm Name Company 000 Firm Name Company 000 Firm Name Company 000 Firm Name Company 000 Firm Name Company 000 Firm Name Company 000 Firm Name Company 000 Firm Name Company 000 Firm Name Company 000 Firm Name Company 000 Firm Name Company 000 Firm Name Company 000 Firm Name Company 000 Firm Name Company 000 Firm Name Company 000 Firm Name Company 000 Firm Name Company 000 D Firm Name Company 000 Firm Name Company 000 Firm Name Company 000 Firm Name Company 000 Firm Name Company 000 Firm Name Company 000 Firm Name Company 000 Firm Name Company 000 Firm Name Company 000 Firm Name Company 000 Firm Name Company 000 Firm Name Company 000 Firm Name Company 000 Firm Name Company 000 Firm Name Company 000 Firm Name Company 000 Firm Name Company 000 Firm Name Company 000 E Firm Name Company 000 Firm Name Company 000 Firm Name Company 000 Firm Name Company 000 Firm Name Company 000 Firm Name Company 000 Firm Name Company 000 Firm Name Company 000 Firm Name Company 000 Firm Name Company 000 Firm Name Company 000 Firm Name Company 000 Firm Name Company 000 Firm Name Company 000 Firm Name Company 000 Firm Name Company 000 Firm Name Company 000 Firm Name Company 000 F Firm Name Company 000 Firm Name Company 000 Firm Name Company 000 Firm Name Company 000 Firm Name Company 000 Firm Name Company 000 Firm Name Company 000 Firm Name Company 000 Firm Name Company 000 Firm Name Company 000 Firm Name Company 000 Firm Name Company 000 Firm Name Company 000 Firm Name Company 000 Firm Name Company 000 Firm Name Company 000 Firm Name Company 000 Firm Name Company 000 G Firm Name Company 000 Firm Name Company 000 Firm Name Company 000 Firm Name Company 000 Firm Name Company 000 Firm Name Company 000 Firm Name Company 000 Firm Name Company 000 Firm Name Company 000 Firm Name Company 000 Firm Name Company 000 Firm Name Company 000 Firm Name Company 000 Firm Name Company 000 Firm Name Company 000 Firm Name Company 000 Firm Name Company 000 Firm Name Company 000 H Firm Name Company 000 Firm Name Company 000 THE TOP 200 ENVIRONMENTAL FIRMS RANK RANK RANK RANKFIRM FIRMFIRM FIRM Where To Find the Top 200 THE TOP 200 ENVIRONMENTAL FIRMS A Abscope Environmental Inc. 193 AECOM 1 AEGION Corp. 28 AKRF Inc. 114 Alberici/Flintco 47 Allan Myers 102 Amec Foster Wheeler 11 American Contracting & Environ. Services Inc. 185 Anchor QEA LLC 89 Antea Group 32 Apex Cos. LLC 65 ARC Abatement 150 Arcadis NV 8 ATC Group Services LLC 75 Atkins North America 79 B Barnard Construction Co. Inc. 39 Barr Engineering Co. 122 Battelle 15 Bay West LLC 170 Bechtel 3 Black & Veatch 16 Bowen 46 Brasfield & Gorrie LLC 121 Brown and Caldwell 33 BSI EHS Services and Solutions 157 Building Crafts Inc. 164 Bureau Veritas 56 Burgess & Niple Inc. 181 Burns & McDonnell 50 C C. Overaa & Co. 72 C.H. Nickerson & Co. Inc. 103 Cabrera Services Inc. 155 Cape Environmental Management Inc. 127 Carollo Engineers Inc. 48 Cascade Environmental LLC 84 CB&I 19 CDM Smith 12 CH2M 2 Charter Contracting Co. LLC 110 Chester Engineers Inc. 195 Civil & Environmental Consultants Inc. 91 Clean Earth Inc. 54 Clean Harbors 5 COMANCO Environmental Corp. 146 Creamer Environmental Inc. 139 Crossland Heavy Contractors Inc. 123 Crowder Constructors Inc. 100 D D&B Engineers and Architects PC 149 Dewberry 140 DLZ 167 Dudek 108 E EA Engineering, Science, and Technology Inc. 71 Eagle Contracting L.P. 171 EarthCon Consultants Inc. 196 ECC 74 Ecology and Environment inc. 67 Enercon Services Inc. 104 Engineering Consulting Services Ltd. 178 Engineering/Remediation Resources Group, Inc. 131 Ensafe Inc. 124 ENTACT LLC 55 Environ. Resources Management Inc. (ERM) 14 EnviroBusiness Consulting Inc. 98 Environmental Compliance Services Inc. 145 Environmental Consulting & Technology Inc. 188 Environmental Quality Management Inc. 109 Environmental Restoration LLC 86 Environmental Science Associates 111 EnviroTrac Ltd. 163 ESG Operations Inc. 126 ET Environmental Corp. LLC 142 F Fluor Corp. 7 Foth Cos. 153 G GAI Consultants Inc. 137 Gannett Fleming 115 Garney Holding Co. 22 GEI Consultants Inc. 119 Geosyntec Consultants Inc. 43 GHD 26 Gilbane Building Co. 78 Golder Associates 25 Great Lakes Dredge & Dock 53 Greeley and Hansen LLC 101 Gresham, Smith and Partners 159 Groundwater & Env. Services Inc. 92 GRW Engineers Inc. 199 GSE Construction Co. Inc. 129 GZA 96 H Haley & Aldrich Inc. 83 Haskell 125 Hatch Group 99 Hazen and Sawyer 52 HDR 13 HEPACO LLC 120 HNTB Cos. 186 HydroGeoLogic Inc. 90 I ICF International 31 Innovative Construction Solutions 148 INTERA Inc. 192 Intertek - PSI 130 Irex Contracting Group 161 J J. F. Ahern Co. 191 J.R. Filanc Construction Co. Inc. 106 Johnson, Mirmiran & Thompson Inc. 168 Johnston Construction Co. 175 Jones Edmunds & Associates Inc. 197 Judy Construction Co. 113 K KCI Technologies Inc. 133 Kennedy/Jenks Consultants Inc. 93 Kiewit Corp. 20 Kleinfelder 68 Kokosing Inc. 45 L LAND Remediation Inc. 174 Langan Engineering and Environ. Services Inc. 85 Layne Christensen Co. 24 Leggette, Brashears & Graham Inc. 158 Leidos 40 Locus Technologies 173 Los Alamos Technical Associates Inc. 70 Louis Berger 37 Lyles Construction Group 44 M M. B. Kahn Construction Co. Inc. 116 Max Foote Construction Co. LLC 88 McCarthy Holdings Inc. 34 McKim & Creed Inc. 187 Michael Baker International 64 MWH Global 9 N National Response Corp. 49 Navarro Research and Engineering Inc. 107 Normandeau Associates Inc. 176 North Wind Group 94 NorthStar Group Services Inc. 21 O OBG 61 Oneida Total Integrated Enterprises (OTIE) 134 P PAL Environmental Safety Corp. 81 Parametrix 172 Parsons Corp. 23 Partner Engineering and Science Inc. 128 PC Construction Co. 42 PCL Construction Enterprises Inc. 36 Pennoni 162 Pepper Construction Group 76 Perma-Fix Environmental Services 118 Portage Inc. 132 Posillico Environmental Inc. 177 POWER Engineers Inc. 183 PPM Consultants Inc. 189 Precision Environmental Co. 143 R Ramboll Environ Inc. 29 Remedial Construction Services L.P. 73 Rice Lake Construction Group 57 RJN Group Inc. 179 RMC Water and Environment 182 Roux Associates Inc. 95 S S&ME Inc. 144 Schnabel Engineering Inc. 184 SCS Engineers 58 Sevenson Environmental Services Inc. 63 Shook Construction Co. 97 Short-Elliott-Hendrickson (SEH) 190 Skelly and Loy Inc. 198 Slayden Constructors Inc. 151 Sletten Cos. 200 SNC-Lavalin Inc. 69 Stanley Consultants 194 Stantec Inc. 18 Strand Associates Inc. 165 STV Group Inc. 180 SUEZ 10 Sukut Construction Inc. 80 SWCA Environmental Consultants 87 T T&M Associates 147 Terracon Consultants Inc. 59 Tetra Tech Inc. 6 The Cadmus Group 105 The Conti Group 152 The Vertex Cos. Inc. 160 The Walsh Group Ltd. 17 Tighe & Bond Inc. 156 Tradebe Environmental Services 27 TRC Cos. Inc. 38 Trihydro Corp. 112 Trinity Consultants 77 Turner Specialty Services LLC 154 U Ulliman Schutte Construction LLC 66 USA Environment LP 82 V Veolia North America 4 Versar Inc. 135 VHB 169 W Wade Trim 136 Weeks Marine Inc. 35 Wenck Associates Inc. 141 Weston & Sampson 117 Weston Solutions Inc. 51 Wharton-Smith Inc. 62 Whitman, Requardt and Associates LLP 138 Woodard & Curran 60 WorleyParsons 41 Wright-Pierce 166 WSP|Parsons Brinckerhoff 30 0815_Top200_WTF.indd 72 8/9/16 12:26 PM