SlideShare uma empresa Scribd logo
1 de 4
Baixar para ler offline
Insurance broking
pulse check
January 2016 key findings
What’s the state of play in insurance broking today? Which firms are outperforming —
and why? And how does your business compare?
To answer these and other key questions, Macquarie Business Banking recently conducted
a short pulse check survey of insurance broking firms around the country. A unique snapshot
of a changing industry in a challenging market, our pulse check builds on the insights from
our benchmarking studies in 2011 and 2013 — and paves the way for our next in-depth
benchmarking survey in 2016.
The market
Revenues rise despite the challenges
Our latest pulse check confirms that the insurance broking market remains highly competitive, with softer premiums putting
revenues under pressure. Yet the research also shows that most firms have remained resilient, with the majority well positioned
to capitalise on better conditions over the next 12 months.
Revenue. 69% of firms achieved revenue growth in FY2015, down from 83% in FY2013. On the flipside, 18% saw revenues fall,
more than twice the proportion reported in our 2013 survey.
9%8%
33%
36%
6%7%
1%
6%
9%
25%
43%
9%
6%
2%
7%7%
21%
34%
13%
16%
2%
Increased
30% or more
Increased
20-29%
Increased
10-19%
Increased
1-9%
No changeDecreased
1-9%
Decreased
10-19%
Decreased
20-29%
2011
2013
2015
Revenue growth
2011 2013 2015
Increased 86% 83% 69%
No change 6% 9% 13%
Decreased 8% 8% 18%
2
Insurance broking pulse check
Janurary 2016 key findings
Profit. 75% of firms posted EBITDA margins of 10% or more in FY2015, an impressive result in a tough operating environment.
Encouragingly, only 6% reported margins under 1%, suggesting that most firms remain profitable and well positioned to ride
out difficult market conditions.
Mergers and acquisitions. Industry consolidation is continuing, indicating that many firms see scale as a key driver in
achieving further growth and business efficiency.
Outlook. The vast majority of respondents expect conditions to improve next year, with 86% forecasting a profit increase, four
points higher than in 2013. New client growth is expected to be overwhelmingly the most important profit driver, while only one
in five forecast hardening premiums to positively impact profit.
Profit margins
Willing buyers have eased, while sellers have increased
Most expect profits to rise between 1% and 19%
2011
2013
2015
3%
14%
32%
23%
19%
9%
6%
10%
20%
30%
19%
15%
6%
19%
20%
23%
21%
11%
<1% 1-9% 10-19% 20-29% 30-39% ≥40%
28%
24%
31%
7%
6%
10%
14%
22%
16%
51%
48%
43%
Overall 2011
Overall 2013
Overall 2015
None of theseA willing seller A willing buyer or sellerA willing buyer
Increase
30% or more
Increase
20-29%
Increase
10-19%
Increase
1-9%
No changeDecrease
1-9%
2011
2013
2015
7%
10%
29%
38%
9%
3% 3%
8%
28%
43%
13%
2%
6%
9%
31%
40%
10%
3%
Decrease
10-19%
1% 1%
2011 2013 2015
Increase 84% 82% 86%
No change 9% 13% 10%
Decrease 4% 3% 4%
2011 2013 2015
<10% 17% 16% 25%
10-29% 55% 50% 43%
≥30% 28% 34% 32%
3
Insurance broking pulse check
Janurary 2016 key findings
The outperformers
What were the two key characteristics of high performing firms in 2015?
Despite tightening conditions, around one in three firms achieved profit margins of 30% or more in FY 2015 — roughly the
same proportion as in our 2011 and 2013 surveys. While these firms are clearly doing many things well, our pulse check points
to a few key factors that set them apart. In particular, they are more likely to focus on business efficiency and staff development
measures to boost performance — enabling them to deliver a higher quality service at a competitive price point, while keeping
margins strong.
Searching for efficiencies. Asked which factors they expect to positively impact profit growth, high performing firms were
more likely to emphasise improved efficiency, while low profit firms were more likely to rely on client growth. High performers
also said they would benefit from improved economic conditions, suggesting many are well positioned to capitalise on
opportunities created by a future upturn in activity across the economy.
Finding and keeping talented people. Our pulse check confirms that high performing firms work harder than their peers
to attract, retain and develop talent. Among other incentives, they are more likely to offer training and development, flexible
working arrangements, career opportunities, and out-of-cycle salary rises.
High performing firms use a wider range of strategies to find and keep talented staff
What are the factors you expect will positively impact profit?
65%
50%
35%
25% 28%
18%
8% 5%
67% 64%
54%
46%
26%
17%
6% 7%
71%
79%
56%
50%
19%
31%
6%
Non-salary
benefits (i.e.
flexible working)
Training and
development
Offering
bonuses
Career
progression
Discounted
premiums
Out of cycle
salary reviews
None of the
above
Other
Low (<10% of revenue) Med (10-29% of revenue) High (≥30% of revenue)
63%
improved
efficiency
29%
improved economic
conditions
25%
Low
<10%
of revenue
43%
Medium
10-29%
of revenue
32%
High
≥30%
of revenue
Defining outperformance: 32% of businesses achieved margins of 30% or more
Insurance broking pulse check
Janurary 2016 key findings
For a closer look at how your business is performing against key industry benchmarks, please
contact your Macquarie Relationship Manager or call 1300 812 673.
The information in this summary has been prepared by Macquarie Bank Limited ABN 46 008 583 542 AFSL & Australian Credit Licence 237502 (‘Macquarie’) for general
information purposes only and is based on statistics and information collected by Macquarie from the 2015 Macquarie Business Banking Insurance Broking Pulse Check Survey (‘the
Survey’). This information does not constitute advice. Before acting on this information, you must consider its appropriateness having regard to your own objectives, financial situation
and needs. You should obtain financial, legal and taxation advice before making any decision regarding this information.
Macquarie does not warrant the accuracy of any information collected in the Survey. Forward looking forecasts are estimates only and are based on the Survey results. Macquarie
does not warrant the accuracy of these estimates and actual results may vary based on a number of market, regulatory, financial and environmental factors. Additionally, past
performance is not a reliable indicator of future performance.
© Copyright is reserved throughout. The information contained in this document must not be copied, either in whole or in part, or distributed to any other person without the express
permission of Macquarie.
Small
0–9 staff
66% increased revenues in FY15
28% had margins of 30% or more
57% forecast 10%+ profit growth
57% offer staff development
Medium
10–19 staff
72% increased revenues in FY15
36% had margins of 30% or more
36% forecast 10%+ profit growth
70% offer staff development
Large
20–29 staff
72% increased revenues in FY15
40% had margins of 30% or more
24% forecast 10%+ profit growth
84% offer staff development
Discover how we can keep your business in front
Snapshot by business size
How does your firm compare?
While our pulse check shows that businesses of every size can be highly profitable, it is also clear that business strategies
and performance will be affected by the size of your firm and the resources at hand. Here is a snapshot of some of the
key differences between large, medium and small firms in today’s market.

Mais conteúdo relacionado

Mais procurados

SVB Q3 State of the Markets Report
SVB Q3 State of the Markets ReportSVB Q3 State of the Markets Report
SVB Q3 State of the Markets ReportSilicon Valley Bank
 
Hubs ir deck q1'18 final
Hubs ir deck q1'18 finalHubs ir deck q1'18 final
Hubs ir deck q1'18 finalIR_HubSpot
 
From cost to value: short-term tactics, long-term strategies - Tom Lewis, IPA
From cost to value: short-term tactics, long-term strategies - Tom Lewis, IPAFrom cost to value: short-term tactics, long-term strategies - Tom Lewis, IPA
From cost to value: short-term tactics, long-term strategies - Tom Lewis, IPAGlobal Business Intelligence
 
Trends in Healthcare Investments and Exits 2017
Trends in Healthcare Investments and Exits 2017Trends in Healthcare Investments and Exits 2017
Trends in Healthcare Investments and Exits 2017Silicon Valley Bank
 
2018 Expansion SaaS Benchmarks
2018 Expansion SaaS Benchmarks2018 Expansion SaaS Benchmarks
2018 Expansion SaaS BenchmarksOpenView
 
Pacific crest-ets-2015-saa s-business-metrics-panel-discussion1
Pacific crest-ets-2015-saa s-business-metrics-panel-discussion1Pacific crest-ets-2015-saa s-business-metrics-panel-discussion1
Pacific crest-ets-2015-saa s-business-metrics-panel-discussion1Lewis Lin 🦊
 
Life Science and Healthcare Startup Outlook 2017
Life Science and Healthcare Startup Outlook 2017Life Science and Healthcare Startup Outlook 2017
Life Science and Healthcare Startup Outlook 2017Silicon Valley Bank
 
Trends in Healthcare Investments and Exits 2016
Trends in Healthcare Investments and Exits 2016Trends in Healthcare Investments and Exits 2016
Trends in Healthcare Investments and Exits 2016Silicon Valley Bank
 
Australia hiring-market-update
Australia hiring-market-updateAustralia hiring-market-update
Australia hiring-market-updateMorgan McKinley
 
payscales-2016-compensation-best-practices-report
payscales-2016-compensation-best-practices-reportpayscales-2016-compensation-best-practices-report
payscales-2016-compensation-best-practices-reportChris Bennett
 
SVB State of the Markets Report
SVB State of the Markets Report SVB State of the Markets Report
SVB State of the Markets Report Silicon Valley Bank
 
State of SaaS in Finland 2018 survey report
State of SaaS in Finland 2018 survey reportState of SaaS in Finland 2018 survey report
State of SaaS in Finland 2018 survey reportTimo Felin
 
Conquest Quarterly Performance Report 4Q15
Conquest Quarterly Performance Report 4Q15Conquest Quarterly Performance Report 4Q15
Conquest Quarterly Performance Report 4Q15RC_Stewart
 

Mais procurados (20)

SVB Q3 State of the Markets Report
SVB Q3 State of the Markets ReportSVB Q3 State of the Markets Report
SVB Q3 State of the Markets Report
 
2019 CEOs Speak Presentation
2019 CEOs Speak Presentation2019 CEOs Speak Presentation
2019 CEOs Speak Presentation
 
Hubs ir deck q1'18 final
Hubs ir deck q1'18 finalHubs ir deck q1'18 final
Hubs ir deck q1'18 final
 
SVB Digital Health Report 2016
SVB Digital Health Report 2016SVB Digital Health Report 2016
SVB Digital Health Report 2016
 
State of Private Capital Markets 2011: Update
State of Private Capital Markets 2011: UpdateState of Private Capital Markets 2011: Update
State of Private Capital Markets 2011: Update
 
June a rdr factsheet
June a rdr factsheetJune a rdr factsheet
June a rdr factsheet
 
The Finance Team Engaged - Tim Hines, Joy global.
The Finance Team Engaged - Tim Hines, Joy global.The Finance Team Engaged - Tim Hines, Joy global.
The Finance Team Engaged - Tim Hines, Joy global.
 
UK Startup Outlook Report 2017
UK Startup Outlook Report 2017UK Startup Outlook Report 2017
UK Startup Outlook Report 2017
 
From cost to value: short-term tactics, long-term strategies - Tom Lewis, IPA
From cost to value: short-term tactics, long-term strategies - Tom Lewis, IPAFrom cost to value: short-term tactics, long-term strategies - Tom Lewis, IPA
From cost to value: short-term tactics, long-term strategies - Tom Lewis, IPA
 
Trends in Healthcare Investments and Exits 2017
Trends in Healthcare Investments and Exits 2017Trends in Healthcare Investments and Exits 2017
Trends in Healthcare Investments and Exits 2017
 
2018 Expansion SaaS Benchmarks
2018 Expansion SaaS Benchmarks2018 Expansion SaaS Benchmarks
2018 Expansion SaaS Benchmarks
 
Pacific crest-ets-2015-saa s-business-metrics-panel-discussion1
Pacific crest-ets-2015-saa s-business-metrics-panel-discussion1Pacific crest-ets-2015-saa s-business-metrics-panel-discussion1
Pacific crest-ets-2015-saa s-business-metrics-panel-discussion1
 
Life Science and Healthcare Startup Outlook 2017
Life Science and Healthcare Startup Outlook 2017Life Science and Healthcare Startup Outlook 2017
Life Science and Healthcare Startup Outlook 2017
 
Trends in Healthcare Investments and Exits 2016
Trends in Healthcare Investments and Exits 2016Trends in Healthcare Investments and Exits 2016
Trends in Healthcare Investments and Exits 2016
 
Australia hiring-market-update
Australia hiring-market-updateAustralia hiring-market-update
Australia hiring-market-update
 
payscales-2016-compensation-best-practices-report
payscales-2016-compensation-best-practices-reportpayscales-2016-compensation-best-practices-report
payscales-2016-compensation-best-practices-report
 
SVB State of the Markets Report
SVB State of the Markets Report SVB State of the Markets Report
SVB State of the Markets Report
 
29407_Book
29407_Book29407_Book
29407_Book
 
State of SaaS in Finland 2018 survey report
State of SaaS in Finland 2018 survey reportState of SaaS in Finland 2018 survey report
State of SaaS in Finland 2018 survey report
 
Conquest Quarterly Performance Report 4Q15
Conquest Quarterly Performance Report 4Q15Conquest Quarterly Performance Report 4Q15
Conquest Quarterly Performance Report 4Q15
 

Destaque

Proyecto de vida.. JEAN GUAMAN
Proyecto de vida.. JEAN GUAMANProyecto de vida.. JEAN GUAMAN
Proyecto de vida.. JEAN GUAMANjean guaman
 
Universidad de las fuerzas armadas
Universidad de las fuerzas armadasUniversidad de las fuerzas armadas
Universidad de las fuerzas armadasjean guaman
 
Email Recommendation
Email Recommendation Email Recommendation
Email Recommendation Anna Steele
 
Pres Playmaker Sportmarketing 2016
Pres Playmaker Sportmarketing 2016Pres Playmaker Sportmarketing 2016
Pres Playmaker Sportmarketing 2016Playmaker
 
Testlink_Version 0.3
Testlink_Version 0.3Testlink_Version 0.3
Testlink_Version 0.3surbhi saxena
 
Proyecto de-vida Daniel Garcia
Proyecto de-vida Daniel GarciaProyecto de-vida Daniel Garcia
Proyecto de-vida Daniel Garciajean guaman
 
TJ Boyle's Final Portfolio
TJ Boyle's Final PortfolioTJ Boyle's Final Portfolio
TJ Boyle's Final PortfolioTJ Boyle
 
Global Citizenship
Global CitizenshipGlobal Citizenship
Global CitizenshipFelix Dodds
 
Proyecto de vida.
Proyecto de vida.Proyecto de vida.
Proyecto de vida.jean guaman
 

Destaque (15)

Cada final es un nuevo amanecer
Cada final es un nuevo amanecerCada final es un nuevo amanecer
Cada final es un nuevo amanecer
 
multimedia
multimediamultimedia
multimedia
 
мордвинцев
мордвинцевмордвинцев
мордвинцев
 
Proyecto de vida.. JEAN GUAMAN
Proyecto de vida.. JEAN GUAMANProyecto de vida.. JEAN GUAMAN
Proyecto de vida.. JEAN GUAMAN
 
Universidad de las fuerzas armadas
Universidad de las fuerzas armadasUniversidad de las fuerzas armadas
Universidad de las fuerzas armadas
 
Email Recommendation
Email Recommendation Email Recommendation
Email Recommendation
 
Pres Playmaker Sportmarketing 2016
Pres Playmaker Sportmarketing 2016Pres Playmaker Sportmarketing 2016
Pres Playmaker Sportmarketing 2016
 
Meizhou report29 1-15
Meizhou report29 1-15Meizhou report29 1-15
Meizhou report29 1-15
 
Testlink_Version 0.3
Testlink_Version 0.3Testlink_Version 0.3
Testlink_Version 0.3
 
Proyecto de-vida Daniel Garcia
Proyecto de-vida Daniel GarciaProyecto de-vida Daniel Garcia
Proyecto de-vida Daniel Garcia
 
Afghanistan
AfghanistanAfghanistan
Afghanistan
 
TJ Boyle's Final Portfolio
TJ Boyle's Final PortfolioTJ Boyle's Final Portfolio
TJ Boyle's Final Portfolio
 
Global Citizenship
Global CitizenshipGlobal Citizenship
Global Citizenship
 
"Cada final es un nuevo amanecer"
"Cada final es un nuevo amanecer""Cada final es un nuevo amanecer"
"Cada final es un nuevo amanecer"
 
Proyecto de vida.
Proyecto de vida.Proyecto de vida.
Proyecto de vida.
 

Semelhante a ib-pulse-check-executive-summary

Inst investor deck 2-13-17 (1)
Inst investor deck   2-13-17 (1)Inst investor deck   2-13-17 (1)
Inst investor deck 2-13-17 (1)Instructure
 
2014 north americantrendsreport
2014 north americantrendsreport2014 north americantrendsreport
2014 north americantrendsreportMaksim Simonenko
 
2015_16_IN_Salary_Employment_Outlook_Report
2015_16_IN_Salary_Employment_Outlook_Report2015_16_IN_Salary_Employment_Outlook_Report
2015_16_IN_Salary_Employment_Outlook_ReportJiten Rathore
 
INST investor deck 05.08.2017
INST investor deck 05.08.2017INST investor deck 05.08.2017
INST investor deck 05.08.2017Instructure
 
Sleep country draft roadshow presentation
Sleep country   draft roadshow presentationSleep country   draft roadshow presentation
Sleep country draft roadshow presentationSleepCountry
 
Inst investor deck aug 2016
Inst investor deck   aug 2016Inst investor deck   aug 2016
Inst investor deck aug 2016Instructure
 
2016 SaaS Metrics Report
2016 SaaS Metrics Report2016 SaaS Metrics Report
2016 SaaS Metrics ReportTotango
 
Vistage Ceo Economic Trends Report
Vistage Ceo Economic Trends ReportVistage Ceo Economic Trends Report
Vistage Ceo Economic Trends ReportRaina Kropp
 
MPFS - FINANCIAL SERVICES SALARY SURVEY 2016
MPFS - FINANCIAL SERVICES SALARY SURVEY 2016MPFS - FINANCIAL SERVICES SALARY SURVEY 2016
MPFS - FINANCIAL SERVICES SALARY SURVEY 2016Jonathan Gilmore
 
Finance Salary Survey 2016
Finance Salary Survey 2016Finance Salary Survey 2016
Finance Salary Survey 2016Emily Nunes
 
Enhanced business performance
Enhanced business performanceEnhanced business performance
Enhanced business performanceVincent Kwon
 
Magnifeye - Business Vision Barometer
Magnifeye - Business Vision BarometerMagnifeye - Business Vision Barometer
Magnifeye - Business Vision BarometerThe Agency Works
 
magnifeye-business-vision-barometer
magnifeye-business-vision-barometermagnifeye-business-vision-barometer
magnifeye-business-vision-barometerJason Neale
 
Shopify Investor Deck - August 2016
Shopify Investor Deck - August 2016Shopify Investor Deck - August 2016
Shopify Investor Deck - August 2016shopifyInvestors
 
2017 barclay final web
2017 barclay final web2017 barclay final web
2017 barclay final webpinnaclefood
 

Semelhante a ib-pulse-check-executive-summary (20)

Marks Sattin Market Insight 2013 (North West)
Marks Sattin Market Insight 2013 (North West)Marks Sattin Market Insight 2013 (North West)
Marks Sattin Market Insight 2013 (North West)
 
Inst investor deck 2-13-17 (1)
Inst investor deck   2-13-17 (1)Inst investor deck   2-13-17 (1)
Inst investor deck 2-13-17 (1)
 
2014 north americantrendsreport
2014 north americantrendsreport2014 north americantrendsreport
2014 north americantrendsreport
 
2015_16_IN_Salary_Employment_Outlook_Report
2015_16_IN_Salary_Employment_Outlook_Report2015_16_IN_Salary_Employment_Outlook_Report
2015_16_IN_Salary_Employment_Outlook_Report
 
Marks Sattin Market Insight 2013 (yorkshire)
Marks Sattin Market Insight 2013 (yorkshire)Marks Sattin Market Insight 2013 (yorkshire)
Marks Sattin Market Insight 2013 (yorkshire)
 
INST investor deck 05.08.2017
INST investor deck 05.08.2017INST investor deck 05.08.2017
INST investor deck 05.08.2017
 
Sleep country draft roadshow presentation
Sleep country   draft roadshow presentationSleep country   draft roadshow presentation
Sleep country draft roadshow presentation
 
Marks Sattin Market Insight 2013 (commerce & industry)
Marks Sattin Market Insight 2013 (commerce & industry)Marks Sattin Market Insight 2013 (commerce & industry)
Marks Sattin Market Insight 2013 (commerce & industry)
 
Inst investor deck aug 2016
Inst investor deck   aug 2016Inst investor deck   aug 2016
Inst investor deck aug 2016
 
Marks Sattin Market Insight 2013 (financial services)
Marks Sattin Market Insight 2013 (financial services)Marks Sattin Market Insight 2013 (financial services)
Marks Sattin Market Insight 2013 (financial services)
 
Marks Sattin Market Insight 2013 (Professional Services)
Marks Sattin Market Insight 2013 (Professional Services)Marks Sattin Market Insight 2013 (Professional Services)
Marks Sattin Market Insight 2013 (Professional Services)
 
2016 SaaS Metrics Report
2016 SaaS Metrics Report2016 SaaS Metrics Report
2016 SaaS Metrics Report
 
Vistage Ceo Economic Trends Report
Vistage Ceo Economic Trends ReportVistage Ceo Economic Trends Report
Vistage Ceo Economic Trends Report
 
MPFS - FINANCIAL SERVICES SALARY SURVEY 2016
MPFS - FINANCIAL SERVICES SALARY SURVEY 2016MPFS - FINANCIAL SERVICES SALARY SURVEY 2016
MPFS - FINANCIAL SERVICES SALARY SURVEY 2016
 
Finance Salary Survey 2016
Finance Salary Survey 2016Finance Salary Survey 2016
Finance Salary Survey 2016
 
Enhanced business performance
Enhanced business performanceEnhanced business performance
Enhanced business performance
 
Magnifeye - Business Vision Barometer
Magnifeye - Business Vision BarometerMagnifeye - Business Vision Barometer
Magnifeye - Business Vision Barometer
 
magnifeye-business-vision-barometer
magnifeye-business-vision-barometermagnifeye-business-vision-barometer
magnifeye-business-vision-barometer
 
Shopify Investor Deck - August 2016
Shopify Investor Deck - August 2016Shopify Investor Deck - August 2016
Shopify Investor Deck - August 2016
 
2017 barclay final web
2017 barclay final web2017 barclay final web
2017 barclay final web
 

ib-pulse-check-executive-summary

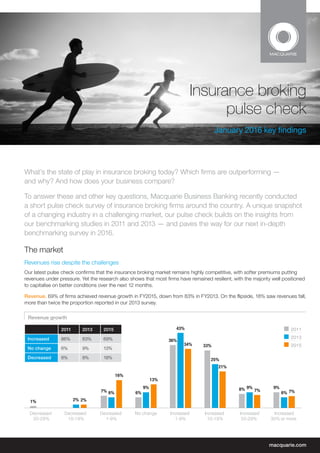
  • 1. Insurance broking pulse check January 2016 key findings What’s the state of play in insurance broking today? Which firms are outperforming — and why? And how does your business compare? To answer these and other key questions, Macquarie Business Banking recently conducted a short pulse check survey of insurance broking firms around the country. A unique snapshot of a changing industry in a challenging market, our pulse check builds on the insights from our benchmarking studies in 2011 and 2013 — and paves the way for our next in-depth benchmarking survey in 2016. The market Revenues rise despite the challenges Our latest pulse check confirms that the insurance broking market remains highly competitive, with softer premiums putting revenues under pressure. Yet the research also shows that most firms have remained resilient, with the majority well positioned to capitalise on better conditions over the next 12 months. Revenue. 69% of firms achieved revenue growth in FY2015, down from 83% in FY2013. On the flipside, 18% saw revenues fall, more than twice the proportion reported in our 2013 survey. 9%8% 33% 36% 6%7% 1% 6% 9% 25% 43% 9% 6% 2% 7%7% 21% 34% 13% 16% 2% Increased 30% or more Increased 20-29% Increased 10-19% Increased 1-9% No changeDecreased 1-9% Decreased 10-19% Decreased 20-29% 2011 2013 2015 Revenue growth 2011 2013 2015 Increased 86% 83% 69% No change 6% 9% 13% Decreased 8% 8% 18%
  • 2. 2 Insurance broking pulse check Janurary 2016 key findings Profit. 75% of firms posted EBITDA margins of 10% or more in FY2015, an impressive result in a tough operating environment. Encouragingly, only 6% reported margins under 1%, suggesting that most firms remain profitable and well positioned to ride out difficult market conditions. Mergers and acquisitions. Industry consolidation is continuing, indicating that many firms see scale as a key driver in achieving further growth and business efficiency. Outlook. The vast majority of respondents expect conditions to improve next year, with 86% forecasting a profit increase, four points higher than in 2013. New client growth is expected to be overwhelmingly the most important profit driver, while only one in five forecast hardening premiums to positively impact profit. Profit margins Willing buyers have eased, while sellers have increased Most expect profits to rise between 1% and 19% 2011 2013 2015 3% 14% 32% 23% 19% 9% 6% 10% 20% 30% 19% 15% 6% 19% 20% 23% 21% 11% <1% 1-9% 10-19% 20-29% 30-39% ≥40% 28% 24% 31% 7% 6% 10% 14% 22% 16% 51% 48% 43% Overall 2011 Overall 2013 Overall 2015 None of theseA willing seller A willing buyer or sellerA willing buyer Increase 30% or more Increase 20-29% Increase 10-19% Increase 1-9% No changeDecrease 1-9% 2011 2013 2015 7% 10% 29% 38% 9% 3% 3% 8% 28% 43% 13% 2% 6% 9% 31% 40% 10% 3% Decrease 10-19% 1% 1% 2011 2013 2015 Increase 84% 82% 86% No change 9% 13% 10% Decrease 4% 3% 4% 2011 2013 2015 <10% 17% 16% 25% 10-29% 55% 50% 43% ≥30% 28% 34% 32%
  • 3. 3 Insurance broking pulse check Janurary 2016 key findings The outperformers What were the two key characteristics of high performing firms in 2015? Despite tightening conditions, around one in three firms achieved profit margins of 30% or more in FY 2015 — roughly the same proportion as in our 2011 and 2013 surveys. While these firms are clearly doing many things well, our pulse check points to a few key factors that set them apart. In particular, they are more likely to focus on business efficiency and staff development measures to boost performance — enabling them to deliver a higher quality service at a competitive price point, while keeping margins strong. Searching for efficiencies. Asked which factors they expect to positively impact profit growth, high performing firms were more likely to emphasise improved efficiency, while low profit firms were more likely to rely on client growth. High performers also said they would benefit from improved economic conditions, suggesting many are well positioned to capitalise on opportunities created by a future upturn in activity across the economy. Finding and keeping talented people. Our pulse check confirms that high performing firms work harder than their peers to attract, retain and develop talent. Among other incentives, they are more likely to offer training and development, flexible working arrangements, career opportunities, and out-of-cycle salary rises. High performing firms use a wider range of strategies to find and keep talented staff What are the factors you expect will positively impact profit? 65% 50% 35% 25% 28% 18% 8% 5% 67% 64% 54% 46% 26% 17% 6% 7% 71% 79% 56% 50% 19% 31% 6% Non-salary benefits (i.e. flexible working) Training and development Offering bonuses Career progression Discounted premiums Out of cycle salary reviews None of the above Other Low (<10% of revenue) Med (10-29% of revenue) High (≥30% of revenue) 63% improved efficiency 29% improved economic conditions 25% Low <10% of revenue 43% Medium 10-29% of revenue 32% High ≥30% of revenue Defining outperformance: 32% of businesses achieved margins of 30% or more
  • 4. Insurance broking pulse check Janurary 2016 key findings For a closer look at how your business is performing against key industry benchmarks, please contact your Macquarie Relationship Manager or call 1300 812 673. The information in this summary has been prepared by Macquarie Bank Limited ABN 46 008 583 542 AFSL & Australian Credit Licence 237502 (‘Macquarie’) for general information purposes only and is based on statistics and information collected by Macquarie from the 2015 Macquarie Business Banking Insurance Broking Pulse Check Survey (‘the Survey’). This information does not constitute advice. Before acting on this information, you must consider its appropriateness having regard to your own objectives, financial situation and needs. You should obtain financial, legal and taxation advice before making any decision regarding this information. Macquarie does not warrant the accuracy of any information collected in the Survey. Forward looking forecasts are estimates only and are based on the Survey results. Macquarie does not warrant the accuracy of these estimates and actual results may vary based on a number of market, regulatory, financial and environmental factors. Additionally, past performance is not a reliable indicator of future performance. © Copyright is reserved throughout. The information contained in this document must not be copied, either in whole or in part, or distributed to any other person without the express permission of Macquarie. Small 0–9 staff 66% increased revenues in FY15 28% had margins of 30% or more 57% forecast 10%+ profit growth 57% offer staff development Medium 10–19 staff 72% increased revenues in FY15 36% had margins of 30% or more 36% forecast 10%+ profit growth 70% offer staff development Large 20–29 staff 72% increased revenues in FY15 40% had margins of 30% or more 24% forecast 10%+ profit growth 84% offer staff development Discover how we can keep your business in front Snapshot by business size How does your firm compare? While our pulse check shows that businesses of every size can be highly profitable, it is also clear that business strategies and performance will be affected by the size of your firm and the resources at hand. Here is a snapshot of some of the key differences between large, medium and small firms in today’s market.