Perspectives & Planning - Washington Trust Wealth Management
HISTORY OF INTEREST RATES
1. January 2014 Vol. No. 1 Investment Updates
Advisor Corner
Please enjoy our January
newsletter. We invite your
feedback. Let us know what
topics you would like to read
about.
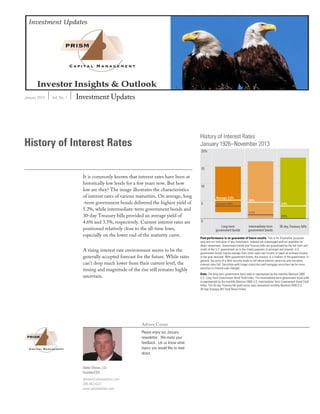
History of Interest Rates
It is commonly known that interest rates have been at
historically low levels for a few years now. But how
low are they? The image illustrates the characteristics
of interest rates of various maturities. On average, long
-term government bonds delivered the highest yield of
5.2%, while intermediate-term government bonds and
30-day Treasury bills provided an average yield of
4.6% and 3.5%, respectively. Current interest rates are
positioned relatively close to the all-time lows,
especially on the lower end of the maturity curve.
A rising interest rate environment seems to be the
generally accepted forecast for the future. While rates
can’t drop much lower from their current level, the
timing and magnitude of the rise still remains highly
uncertain.
Dieter Drews, J.D.
Founder/CEO
ddrews@prismadvisor.com
206-443-4321
www.prismadvisor.com
2. Prism Capital Management, LLC Investment Updates January 2014 2
Economic Outlook for 2014
As the end of 2013 draws near, the U.S. economy
appears very much like an ocean liner, finding it very
difficult to change either speed or direction. As the
table illustrates, overall GDP growth rates,
employment growth and consumption have all been
stuck in a very narrow range for the last three years.
Morningstar economists expect little change in the
overall GDP growth rate for 2014, although the
composition of that growth is likely to be somewhat
different. Inventories should be a much smaller
contributor to growth, net exports are likely to be a
larger subtraction from GDP as imports grow, and
government spending should be a much smaller
negative in 2014.
Consumption, housing and business investments
(excluding inventories) are likely to change little from
their 2013 growth rates. Other forecasts may be more
bullish on overall GDP growth, but Morningstar
economists suspect growth rates in autos will
decelerate, existing home sales will likely be flat, and
government spending will still be a drag, albeit smaller
than the rather large subtraction in 2013.
With little change in the 2% GDP growth rate,
employment growth may not change that much,
either. Slow growth, a wide output gap (a fancy
capacity utilization measure) and a bumper farm crop
should all keep inflation in check in 2014, though
medical costs may rise faster than in 2013, bringing up
the overall rate of inflation. With the Fed now
officially tapering bond purchases, 10-year Treasury
bond rates should move up to reflect the inflation rate
plus a spread. Auto sales should continue to do well in
2014 with continued employment growth, new
models, and an aging fleet. Unfortunately, auto sales
are now approaching previous highs and the law of
large numbers is beginning to set in, with year-over-
year growth rates likely to slow. An acceleration in
housing starts may still occur, as it has taken home
builders some time to gear up for increased demand
(zoning, land acquisition, etc.). However, existing
homes will be hard pressed to grow much with higher
rates, more competition from new homes, tight
inventories, and lower affordability.
Probably the biggest news in the fourth quarter was
that the Fed would begin tapering its large $85 billion
bond purchase program. This program was a truly
extraordinary measure; never before has the Fed
reacted so boldly and so beyond its sphere of short-
term interest rates. Given extraordinarily tight fiscal
measures and a slow-growth economy, the program
was both helpful and necessary. With the economy at
least a little better and an easing of the fiscal tensions,
however, it was probably time for it to end. Markets
had already anticipated the tapering last spring, and
interest rates had previously made their move up.
Further rate increases are possible, but the worst may
be behind us.
3. Prism Capital Management, LLC Investment Updates January 2014 3
Morningstar Research Examines
Retirement Costs
Morningstar Investment Management published new
research in December that examines the most
common assumptions used to estimate retirement
needs and lays out a framework for investors to take a
more personalized approach to setting retirement
savings goals.
“There are three common assumptions that many
software tools and financial advisors use to come up
with a retirement savings goal—a 70 or 80 percent
replacement rate based on pre-retirement income, an
income need that rises with inflation, and a 30-year
retirement time horizon,” David Blanchett, head of
retirement research for Morningstar Investment
Management, said. “When we looked at actual retiree
spending patterns and life expectancy, however, we
found that these assumptions don’t hold true for many
people and, on average, can significantly overestimate
how much people will actually need to fund their
retirement.”
Many expenses disappear after retirement, such as
Medicare taxes, Social Security taxes, and retirement
savings. The paper first demonstrates the effect on
replacement rate calculations of accounting for taxable
and non-taxable expenses that are no longer paid after
retirement. Next, using government data, the analysis
explores the actual spending patterns of retirees, and
finds that they grow at a rate lower than inflation
through most of retirement and then accelerate in later
years because of higher health care costs. While the
difference between the actual spending growth rate
and the inflation rate is relatively small, it has a
material effect over time. When the researchers
modeled actual spending patterns over a couple’s life
expectancy, rather than a fixed 30-year period, the
data showed that many retirees may need
approximately 20% less in savings than the common
assumptions would indicate.
Results from this research show the actual replacement
rate is likely to vary considerably by retiree household,
from under 54% to over 87%. Retiree expenditures do
not, on average, increase each year by inflation or by
some otherwise static percentage; the actual “spending
curve” of a retiree household varies by total
consumption and funding level. Specifically,
households with lower levels of consumption and
higher funding ratios tend to increase spending
through the retirement period and households with
higher levels of consumption but relatively lower
funding ratios tend to decrease spending through the
retirement period. When consumption and funding
levels are combined and correctly modeled, the true
cost of retirement is highly personalized based on each
household’s unique facts and circum¬stances, and is
likely to be lower than amounts determined using
more traditional models.
“While a replacement rate between 70 and 80 percent
may be a reasonable starting place for many
households, we find that the actual replacement rate
can vary considerably,” Blanchett continued. “Take,
for example, a high-income couple, living in a high
income tax state like California, and saving a
significant amount for retirement each year. If that
couple retires in Florida or Texas, where there is no
income tax, the replacement rate might be closer to 60
percent. By contrast, a low-income couple saving very
little for retirement and retiring in California could
have a replacement around 85 percent. It’s important
for investors to consider their level of pre-retirement
household income, expenses that discontinue after
retirement, and post-retirement taxation.”
These findings have important implications for
retirees, especially when estimating the amount that
must be saved to fund retirement. A more advanced
perspective on retiree spending needs can significantly
change the estimate of the true cost of retirement.
Source: David Blanchett, CFA, CFP, Head of
Retirement Research, Morningstar Investment
Management: Estimating the True Cost of
Retirement, Working Paper, Nov. 5, 2013.