Informe energía eólica AWEA (EEUU)
•
0 gostou•538 visualizações

Informe del Tercer Trimestre de 2013 de la Industria Eólica, presentado con AWEA (American wind Energy Association).

Recomendados
Recomendados
Mais conteúdo relacionado
Mais procurados
Mais procurados (20)
Destaque
Destaque (15)
Semelhante a Informe energía eólica AWEA (EEUU)
Semelhante a Informe energía eólica AWEA (EEUU) (20)
Mais de Efienar Eficiencia Energética
Mais de Efienar Eficiencia Energética (14)
Último
Último (20)
Informe energía eólica AWEA (EEUU)
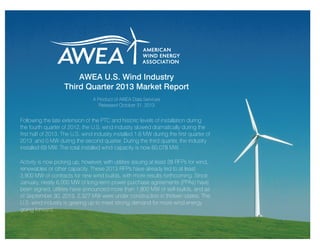
- 1. AWEA U.S. Wind Industry Third Quarter 2013 Market Report A Product of AWEA Data Services Released October 31, 2013 Following the late extension of the PTC and historic levels of installation during the fourth quarter of 2012, the U.S. wind industry slowed dramatically during the first half of 2013. The U.S. wind industry installed 1.6 MW during the first quarter of 2013 and 0 MW during the second quarter. During the third quarter, the industry installed 69 MW. The total installed wind capacity is now 60,078 MW. Activity is now picking up, however, with utilities issuing at least 28 RFPs for wind, renewables or other capacity. These 2013 RFPs have already led to at least 3,900 MW of contracts for new wind builds, with more results forthcoming. Since January, nearly 6,000 MW of long-term power purchase agreements (PPAs) have been signed, utilities have announced more than 1,800 MW of self-builds, and as of September 30, 2013, 2,327 MW were under construction in thirteen states. The U.S. wind industry is gearing up to meet strong demand for more wind energy going forward.
- 2. Table of Contents Summary U.S. Annual and Cumulative Wind Power Growth U.S. Wind Power Capacity Installations by State Wind Power Capacity Completions by Quarter Wind Power Capacity under Construction Wind Power Capacity Installations by Region U.S. Wind Projects Completed through the Third Quarter of 2013 U.S. Wind Projects Under Construction during Third Quarter of 2013 2013 Electric Utility Requests for Proposals (RFPs) Results for 2013 RFPs 2013 Electric Utility Requests for Proposals (RFPs) Map Power Purchase Agreements Signed in 2013 Map of Wind Projects with PPAs signed in 2013 Utility Quotes on Wind Power 3 4 5 6 7 8 Full Version Full Version Full Version Full Version Full Version Full Version Full Version 9 American Wind Energy Association | U.S. Wind Industry Third Quarter Market Report 2013 | AWEA Executive Summary| 2
- 3. Summary • Following the late extension of the Production Tax Credit (PTC) and Investment Tax Credit (ITC) plus the historic level of installations in the fourth quarter of 2012, the U.S. wind industry installed 1.6 megawatts (MW) of new capacity during the first quarter of 2013 and 0 MW during the second quarter of 2013. During the third quarter, the U.S. wind industry installed 68.3 MW through the completion of projects in Alaska, California and Colorado. There are now 60,078 MW of installed wind capacity in the United States. • There were more than 2,327 MW under construction as of September 30, 2013. These projects span across thirteen states: Texas leads with more than 539 MW under construction, followed by Michigan with 362 MW, Nebraska with 275 MW, Washington with 267 MW, Kansas with 254 MW, California with 226 MW and North Dakota with 205 MW. New York, Minnesota, Iowa, Colorado, Massachussetts and Indiana also have wind projects under construction. • Of the projects under construction, at least 1,650 MW of wind energy projects have long-term power offtake agreements in place through long-term PPAs or direct utility ownership. Over 525 MW of projects have merchant hedge agreements in ERCOT. Additional wind energy capacity has secured long-term power offtake agreements but has not yet started construction. • At least 42 power purchase agreements (PPAs) have been signed or announced this year, totaling nearly than 6,000 MW. These projects are spread across 14 states. State utility regulators have approved an additional 1,870 MW of new builds with direct utility ownership. • At least 27 requests for proposals (RFPs) were issued for wind, renewables, or generic capacity due in 2013. These RFPs span 22 states and the District of Columbia. Year to date, at least 4,178 MW of new wind builds - only 205 MW which are currently under construction - have resulted from these RFPs. • 12 RFPs due in 2013 are wind-specific, totaling at least 1,300 MW of new capacity. The results for some of these RFPs have been announced and in some cases far surpass the amount of MW for which the RFP was issued. • 12 RFPs are for renewables, including wind. • 2 RFPs are for all generating sources, including wind. • In addition, the Massachusetts Department of Public Utilities (DPU) passed an order in March allowing Unitil, National Grid, NSTAR Electric Company and Western Massachusetts Electric Company to pursue long-term renewable energy contracts on an expedited schedule. This procurement led to over 560 MW of new wind PPAs. • In many of these RFPs, utilities are explicitly citing the 2013 PTC/ITC extension as motivation for the timing of their RFPs and in some cases have developed fast-track approval processes to take advantage of the extension. • The IRS released guidance on PTC/ITC eligibility on April 15, 2013, allowing project developers to proceed with additional new construction in the coming months. A second guidance was released on September 20, 2013. American Wind Energy Association | U.S. Wind Industry Third Quarter Market Report 2013 | AWEA Executive Summary| 3
- 4. U.S. Wind Power Capacity Growth 70,000 Cumulative Capacity Annual Capacity Installations 60,007 60,000 60,078 1Q Capacity Installations 2Q Capacity Installations Wind Power Capacity (MW) 50,000 3Q Capacity Installations 46,930 4Q Capacity Installations 40,283 40,000 35,068 30,000 25,065 20,000 16,702 11,450 8,993 10,000 4,147 0 2001 4,557 2002 6,222 2003 6,619 2004 2005 2006 2007 2008 2009 2010 2011 2012 71 2013 American Wind Energy Association | U.S. Wind Industry Third Quarter Market Report 2013 | AWEA Executive Summary| 4
- 5. U.S. Wind Power Capacity Installations by State AK 61 0 to 100 MW >100 MW to 1,000 MW >1,000 MW to 5,000 MW >5,000 MW to 10,000 MW >10,000 MW WA 2,808 OR 3,153 CA 5,587 NV 152 MT 645 ID 973 WY 1,410 UT 325 AZ 238 HI 206 ND 1,681 SD 783 VT 119 MN 2,987 IA 5,133 NE 459 CO 2,324 NM 778 WI 648 KS 2,713 OK 3,134 TX 12,214 MO 459 NH 171 MA 103 NY 1,638 MI 988 OH 428 IN IL 3,568 1,543 ME 431 KY PA 1,340 WV 583 VA CT RI 9 NJ 9 DE 2 MD 120 NC TN 29 SC AR MS AL GA LA FL PR 125 American Wind Energy Association | U.S. Wind Industry Third Quarter Market Report 2013 | AWEA Executive Summary| 5
- 6. Wind Power Capacity Completions by Quarter 9,000 1Q 2Q 3Q 4Q 8,380 8,000 7,000 Wind Power Capacity (MW) 6,000 5,000 4,114 4,105 4,000 3,080 3,000 3,446 3,298 2,000 1,621 1,3061,331 1,837 1,695 1,589 1,221 1,118 1,0501,205 1,000 541 704 1,211 673 2 0 2008 2009 2010 2011 2012 0 69 2013 American Wind Energy Association | U.S. Wind Industry Third Quarter Market Report 2013 | AWEA Executive Summary| 6
- 7. Wind Power Capacity Under Construction 11000 New Under Construction 10,000 9,000 All Under Construction Completed Capacity As of September 30, 2013 there were 2,327 MW under construction across 21 projects in thirteen states. New construction began on 1,116 MW at twelve projects. 8,000 Wind Power Capacity (MW) 7,000 6,000 5,000 4,000 3,000 2,000 1,000 0 1Q08 2Q08 3Q08 4Q08 1Q09 2Q09 3Q09' 4Q09 1Q10 2Q10 3Q10 4Q10 1Q11 2Q11 3Q11 4Q11 1Q12 2Q12 3Q12 4Q12 1Q13 2Q13 3Q13 American Wind Energy Association | U.S. Wind Industry Third Quarter Market Report 2013 | AWEA Executive Summary| 7
- 8. Wind Power Capacity Installations by Region (MW) Online 2010 Online 2011 Online 2012 New England Alaska New York Northwest Midwest Mountain West Mid-Atlantic Plains California Scale (MW ) Southeas t 3,000 2,500 2,000 1,500 Texas 1,000 Hawaii 500 0 Puerto Rico American Wind Energy Association | U.S. Wind Industry Third Quarter Market Report 2013 | AWEA Executive Summary| 8
- 9. Utilities on Wind Recent statements on why utilities are interested in adding wind power to their portfolios... From the Southeast “Adding additional wind energy to our generation mix underscores our commitment to a diverse portfolio that offers clean, safe, reliable, sustainable and low-cost electricity for years to come.” - Paul Bowers, president & CEO of Georgia Power after signing 2 PPAs for Georgia Power’s first wind contracts. April 23, 2013 From the Midwest “We’ve found a way to meet the state of Minnesota’s renewable energy standard early and reduce costs at the same time ... Expanding Bison will add to our renewable energy supply, resulting in the lowest cost resource over time by capturing the benefits of the extended production tax credit and a competitive turbine market” - Al Hodnik, chairman and CEO of ALLETE after announcing the expansion of their Bison Wind Energy Center From the Interior West “It works out to a very good levelized cost for our customers,…These prices are so compelling, the energy [cost] associated with it is less than you can do locking in a 20-year gas strip.“ - Xcel Energy, Ben Fowke, Xcel President and CEO. The Colorado and Minnesota public utility commissions approved wind PPAs totaling 850 MW. Xcel Energy expects to pay about $25/MWh to $35/MWh over 20 years for the recently approved wind power purchase agreements From the Northeast “By pooling the resources of all the utilities, we were able to purchase a large amount of clean, renewable energy for the state at below-market prices. In addition to delivering benefits for years to come, these agreements have the potential to save customers money over the long term.” - Ronald Gerwatowski, National Grid Sr. VP for U.S. Regulation and Pricing. The state’s biggest utilities, National Grid, Northeast Utilities, and Unitil Corp, in a milestone for New England’s wind power industry, have signed long-term contracts for 565 MW of wind. If approved, the contracts would eventually save customers between 75 cents and $1 a month, utilities estimated. From the Plains “The decision to contract for an additional 400 MW was based on extraordinary pricing opportunities that will lower costs for PSO’s customers by an estimated $53 million in the first year of the contracts. Annual savings are expected to grow each year over the lives of the contracts.” - American Electric Power’s Public Service Company of Oklahoma, signed power purchase agreements for 400 MW of wind energy capacity, noting it decided to triple the amount of requested wind energy capacity. American Wind Energy Association | U.S. Wind Industry Third Quarter Market Report 2013 | AWEA Executive Summary| 9
- 10. For more information on AWEA market analysis, please visit www.awea.org where you can access older versions of the Quarterly Market Reports and see the latest Annual Market Report. This report can be accessed at www.awea.org/3Q2013 For a spreadsheet with underlying data or with any corrections, please contact Emily Williams at ewilliams@awea.org American Wind Energy Association | U.S. Wind Industry Third Quarter Market Report 2013 | AWEA Executive Summary| 10