1. General Principle GCW
At the pilot site, groundwater circulation occurs from
the top of the aquifer to the bottom (termed “stan-
dard flow”). Groundwater enters the lower screen
section, is pumped upward inside the remediation
well, and exits the upper screen section. Induced
differences in pressure head establish and maintain
a 3-dimensional circulation cell around the GCW.
The groundwater captured by the circulation cell cir-
culates several times through the well before it is
released down-gradient. The vertical and horizontal
circulation flow patterns force water to move through
the entire aquifer portion within the circulation cell.
Especially areas of low permeability are intensively
penetrated. This improves mobilization, homogeni-
zation, dilution of contaminants, and distribution of
C-Mix for biodegradation. Groundwater circulation
increases the retention time in the sphere of influ-
ence of the GCW and the substrate addition is more
readily controlled and distributed.
The shallow part of the aquifer indicates partially ox-
idizing biodegradation of cis-DCE and VC under an-
aerobic conditions, whereas the supply of DO (0.1-
2.0 mg/l) originates from the capillary fringe area and
vadose zone. The degradation was also stimulated
via recirculated groundwater including ethene.
IEG- C-Mix
IEG C-Mix, a nutritive preparation of alcohols, sac-
charides, proteins, vitamins and minerals create
an environment in the groundwater circulation that
supports biological degradation of contaminants. Al-
cohols and saccharides serve as an energy source
for microorganisms. Proteins have structural or me-
chanical functions in the microbial cell. Vitamins
are essential for dehalogenase enzyme production.
Minerals are necessary co-factors for microbial en-
zymes. IEG uses C-Mix in sites where low levels of
organic carbon, and the restricted availability of key
nutrients limit biodegradation.
GCW-C-Mix technology involves the stimulation of
native microbial populations in the subsurface, spe-
cifically for the purpose of permanently degrading
or transforming contaminants through reductive de-
chlorination.
To support anaerobic degradation, IEG C-Mix is dis-
solved and infused into an aquifer into the reinjection
line of the GCW or peripheral wells. C-Mix achieves
a fast and effective breakdown of contaminants in
the groundwater.
GCW-C-Mix technology offers many advantages
over other bioremediation techniques since it com-
bines effective flushing and an active distribution
system for bioremediation. The aquifer itself be-
comes a bioreactor that is hydraulically controlled.
In contrast to other hydraulic techniques, the circu-
lation zones permit more homogeneous dispersion
of substances in the treatment area of the GCW.
Aquifers frequently contain strong heterogeneities
and groundwater always takes the path of least re-
sistance. Since GCW injection and extraction rates
are equal, C-Mix can be conveyed into the higher
contaminated low permeable zones, so the total
quantity of C-Mix can be better predicted and sig-
nificantly reduced during operation.
The soluble reagents are perfused to multiple path-
ways in the GCW treatment zone by generating mi-
crobial degradation. Biodegradation is taking place
not only in conductive areas, but also in the former
none hydraulically accessible pore space. The ver-
tical hydraulic flow creates an additional mobiliza-
tion of contaminants from the non accessible pore
space into better permeable pores, where microbes
had adapted before.
IEG-Multilevel-Well-System (MLWS)
MLWS groundwater sam-
ples are extracted via a
mechanism consisting of a
piston drive, operating with-
in the cylinders and pumped
to the surface through flex-
ible hoses. Lip-packers are
attached to a central rod at
the top and bottom of the
well screens to separate the
screen areas and to create
small sampling chambers,
resulting in our having to
pump a small amount of wa-
ter.
Samples from the MLWS are
extracted from all chambers
simultaneously. The sam-
pling procedure always re-
mains the same and the lev-
el of the contaminants and
their locations are accurate.
Several MLWS can show the
contamination and degrada-
tion profile of the circulation
cell in three dimensions.
Site History
The site is situated in an industrial park of a large city
in Lower Saxony. From 1965 to 1985 this area was
used by several industrial manufacturers for chemi-
cal products using trichloroethene (TCE). GFS/IEG
setupaphysicalsiteremediation withaGroundwater
Circulation Well (IEG-GCW®) including in situ strip-
ping and off-gas treatment with activated carbon in
the source area in 1998. In the ensuing years, GFS/
IEG installed several GCW at the site for different
time periods and the entire GCW remediation was
concluded in 2010. Further assessment was carried
out up to 2011, where the highest concentrations
were found about 70 m down gradient of the source
area. Since May 2011 a pilot test employing only
in situ microbiological biodegradation via GCW and
IEG-C-Mix has been in progress in this area.
Site Characteristics
• Pilot test area 600 m²: 120 m * 50 m
• Groundwater level: 1.5 – 2.0 m bgs
• Aquifer thickness: 7 m
• Geology: fine to medium grained sands with thin
silty layers
• Aquitard 9 m below ground
• Total concentration of Cis-Dichlorethen (cis-DCE)
and Vinyl Chloride (VC) 10.000 μg/l
• Hydraulic conductivity: Kh = 1*10-5 m/s
• Hydraulic gradient: 0.005
• Groundwater velocity: 7 m/year
• Fe(III): 20 - 60 mg/l
• Conductivity: 650 – 1.170 μs/cm
• pH: 6.8 – 7.4
• Dissolved oxygen (DO): 0.15 – 2.0 mg/l
• Stagnation point GCW: 35 m
• Capture zone GCW aquifer bottom (Bb): 100 m
• Pore volume exchange at 20 m ROI: 25 times/year
Remediation Process
Before GFS/IEG started the remediation project, the
original parent compound TCE was no longer pres-
ent in the groundwater through natural degradation
under iron-reducing conditions. Initially, we ana-
lyzed high cis-DCE (95%), VC (5%) concentrations,
and very low concentrations of trans-Dichlorethen
(trans-DCE).
Due to the minimal space availability at the site, and
as microbiological remediation became more prov-
en and accepted as a superior, more cost effective,
and more ecologically friendly, the client and the au-
thorities agreed upon a combination of GCW with
an anaerobic microbiological in situ process.
IEG-C-Mix consists of easily degradable alcohols,
saccharides, proteins, vitamins and minerals. For
infiltrating C-Mix, a GCW (250 mm) was drilled and
equipped with 2 m screen sections separated by
solid casing and an inflatable packer. The self-prim-
ing GCW pump with an electronic flow meter was
installed in an 800 mm subsurface vault. The C-Mix
metering system stays in 20 m distance installed in
a small container. Consequently, the site was not
restricted because there was practically no above
ground installation. Additionally, the remediation
system emitted no sound.
Monitoring
Three MLWS were installed around the GCW for
monitoring and control. Each well has 4 sampling
ports at different depths (2.75 m, 4.75 m, 6.75 m,
8.75 m bgs). For the first two months of the pilot test,
MLWS sampling was carried out every week at all
sampling ports analyzing cis-DCE, trans-DCE, VC,
ethene, DOC, and groundwater parameters. After-
wards, the sampling was made every 2 to 4 weeks.
Additionally, the monitoring wells KB 16 -17 were
sampled regularly. Groundwater levels in all avail-
able monitoring wells were measured monthly. The
flow rate of the circulation pump and the injection
rate of the C-Mix metering system were controlled
daily.
Remediation Progress
The initial GCW influent concentration of 650 µg/l
cis-DCE and VC had been reduced to 30 µg/l af-
ter 6 weeks of operation. After stopping the C-Mix
infusion on a trial basis the influent concentrations
rebounded to original values. Since October 2011
the influent and effluent concentrations of the GCW
have decreased to smaller than 5 µg/l cis-DCE and
VC.
An accumulation of cis-DCE and VC couldn’t be de-
tected in the MLWS and monitoring wells. There has
been a correlation between the increasing values of
ethene and the decreasing values of cis-DCE. After
several weeks of operation, the groundwater tem-
perature in the influent rose to 24 °C.
In the sealed well head of the GCW the CO2 con-
centrations rise to 20% and the CH4 concentration
to 0.4%, because of degassing circulating ground-
water. The pH in the circulating groundwater de-
creased below 5.
At MLWS 2 (distance 10 m) nearest to the GCW the
concentrations decreased in all sampling ports after
6 months of operations. Some ports were reduced
below 1% of the original concentration.
MLWS 3 (distance 20 m) showed increasing con-
centrations in the uppermost sampling port and the
lower ports showed a significant reduction. The in-
creasing concentrations show the effective mobi-
lization of contaminants from the fluctuation zone
through the GCW. Especially in the deeper sam-
pling ports MLWS 3/3 and MLWS 3/4 an increasing
concentration of ethene from 3 µg/l to 470 µg/l was
observed.
The concentrations in the upper sampling ports at
MLWS 1 were reduced, while the deeper sampling
ports showed an increase in the mobilization of con-
taminants with the capture zone towards the GCW.
Monitoring wells KB 16 and KB 18 screened in the
upper part of the aquifer showed a reduction from
2-8% of the initial value after 6 months of operation.
The results indicate that after a short period of C-Mix
addition, a bioreactive zone is established where
degradation processes occur. The Radius of influ-
ence of degradation (ROD) can be fixed between
20-25 m.
More than 20 monitoring wells outside of the GCW
radius of influence (ROI) of about 35 m indicate no
mobilization of contaminants out of the circulation.
Lessons Learned
• Bioreactive zone around GCW showed decrease in
cis-DCE and VC concentrations from 650 to 30 µg/l
• No increase and accumulation of metabolites
• Decrease pH, groundwater temperature
• Formation of CO2 and CH4
• Ethene is an indicator for complete reductive de-
chlorination
• Sequential anaerobic/aerobic degradation exists
• 2000 kg C-Mix was added into the circulation
• Constant circulation rate 2 m³/h, resulting in <
16,000 m³ circulated groundwater
• Radius of Influence (ROI) of GCW 25 m
• Radius of degradation (ROD) of GCW 20 -25 m
• No groundwater drawdown
• Pore volume of the aquifer at a distance of 20 m
ROI was exchanged 25 time/ year
• During remediation spatiotemporal differences in
degradation occur
• No downstream mobilization
• No additional groundwater treatment was required
• 3 additional GCW for a full scale remediation
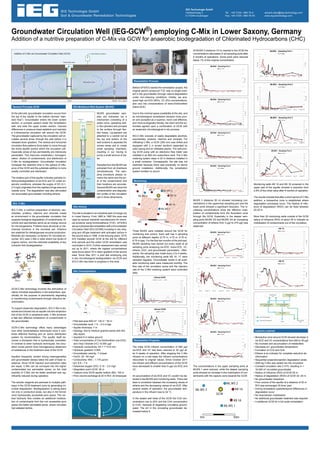
Groundwater Circulation Well (IEG-GCW®) employing C-Mix in Lower Saxony, Germany
Addition of a nutritive preparation of C-Mix via GCW for anaerobic biodegradation of Chlorinated Hydrocarbons (CHC)
Vitamins
Proteins
Minerals
SaccharidesAlcohols
IEG Technologie GmbH
Hohlbachweg 2
D-73344 Gruibingen
Tel: +49 7335 / 969 76-0
Fax: +49 7335 / 969 76-40
eduard.alesi@ieg-technology.com
www.ieg-technology.com