The impact of carbon tax on the Irish freight sector
•Transferir como PPTX, PDF•
1 gostou•95 visualizações

Shiyu Yan delivered this presentation at a joint ESRI-UCD conference tilted 'Energy research to enable climate change mitigation' on 17 September 2019. Photos from the conference are available to view on the ESRI website here: https://www.esri.ie/events/esri-ucd-conference-energy-research-to-enable-climate-change-mitigation

Recomendados
Recomendados
Mais conteúdo relacionado
Mais procurados
Mais procurados (20)
Semelhante a The impact of carbon tax on the Irish freight sector
Semelhante a The impact of carbon tax on the Irish freight sector (20)
Mais de Economic and Social Research Institute
Mais de Economic and Social Research Institute (20)
Último
Último (20)
The impact of carbon tax on the Irish freight sector
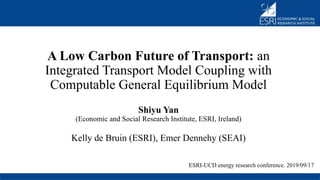
- 1. A Low Carbon Future of Transport: an Integrated Transport Model Coupling with Computable General Equilibrium Model Shiyu Yan (Economic and Social Research Institute, ESRI, Ireland) Kelly de Bruin (ESRI), Emer Dennehy (SEAI) ESRI-UCD energy research conference. 2019/09/17
- 2. Content 1. Introduction 2. Methods 3. Results 4. Conclusion
- 3. The importance of transport sector 3 IEA(2016) 1. Introduction
- 4. 4 Total final energy consumption in Ireland by sector 1. Introduction
- 5. 5 Energy-related CO2 emissions in Ireland by sector 1. Introduction
- 6. 6 The project objective is to establish a integrated model of transport demand, energy consumption and emission to improve decision making in the sustainable transition of transport sector. • quantify impacts of external socio-economic developments; • evaluate effects of policy packages on transport and other economic activities; • provide tools for decision makers to calculate transport energy and emission; • present detailed transport energy scenarios in modal and technologies. 1. Introduction
- 7. - Macro-economic and energy system wide top down models – bottom up approaches with sectoral details. Global Change Assessment Model (GCAM) (Mishra et al., 2013) UK transport carbon model (Brand et al., 2012) - Panel data for parameter estimation and simulation - Integration of behavioral realism (logit models) - Link the transport (energy) model with a general equilibrium model (I3E) 7 Research contributions: 1. Introduction
- 8. An integrated modelling framework • Transport activity, energy, and emission • passenger (Car, bus, rail, air) and freight (LGV, HGV, rail, navigation and air) • Freight transport demand (tkm) and freight vehicle stock 8 2. Methods
- 9. Vehicle Stock Module (new sales, scrapped vehicles) Transport Demand Module (forecast and disaggregation) Fuel Consumption Module (aging, on-road and driving condition) Emission Module (GHG and other pollutants) Scenario variables (e.g. GDP, income, demographics , prices) Policy variables (e.g. vehicle taxes, energy taxes, carbon taxes, energy targets) Number of vehicles by class and technology Transport demand by mode and vehicle class Energy use by fuel type In-use and life- cycle emissions by pollutants Transport Model I3E Model 9
- 10. 2.1 Freight Transport Demand Module 2.2 Freight Vehicle Stock Module 2.3 Freight Vehicle Fuel Consumption/Emission Module 2. Methods
- 11. Freight transport RoadRail Diesel Petrol Weight band LGV1 52 years of registration Weight band HGV5 Discrete choice model Vintage 1999 Others … … Weight band LGV1 Weight band HGV5 … … Vintage 2050 … … … … … … … 10 weight bands Total transport service demand (tkm) Generalized price (euro/tkm) Demand Share 2. Methods - Transport Demand Module (freight)
- 12. Total transport service demand (tkm) - Discrete choice model t is year 𝛽 is estimated from regression 𝛼 is calibrated for the baseline year 2015 𝑠𝑡,𝑖 = 𝛼𝑖 × 𝑃𝑡,𝑖 𝛽𝑖 𝑗 𝛼𝑖 × 𝑃𝑡,𝑖 𝛽𝑖 Share of total transport service demand (tkm) by mode/technology, i. Transport service price (euro/tkm) 2. Methods - Transport Demand Module (freight)
- 13. Generalized price A generalized price is a share-weighted average price that is aggregated from prices on the lower level, j, in the nested structure based on the transport service demand share of vehicle technologies. 𝑃𝑡,𝑖 = 𝑗 𝑠𝑡,𝑖,𝑗 𝑃𝑡,𝑖,𝑗 Road - Vehicle price, vehicle taxes, fuel costs and other costs. Rail – Revenue/distance 2. Methods - Transport Demand Module (freight)
- 14. Freight vehicle stock Old vehicles New vehicles Transport service demand by fuel, weight band and year of registration Survive rates by weight band and age 2. Methods - Vehicle Stock Module (freight)
- 15. Energy efficiency by mode, fuel type, vehicle weight and year of registration • Old vehicle energy efficiency (litre/km) increases along with the age. (LGV and HGV) • New vehicle energy efficiency decrease considering the euro standard for vehicles. (LGV and HGV) 2. Methods - Vehicle Stock Module (freight)
- 16. 2. Results (Preliminary) - Descriptive analysis
- 17. L1: <1017 kg L2: 1017-1270 L3: 1271-1524 L4: 1525-1778 L5: 1779-2032 H1: 2033-5080 H2: 5081-7112 H3: 7113-10160 H4: 10161-12192 H5: >12193 2. Results (Preliminary) - Descriptive analysis
- 18. 2. Results (Preliminary) - Descriptive analysis New vehicle survival rate
- 19. New vehicle energy efficiency 2. Results (Preliminary) - Descriptive analysis
- 20. Base year 2. Results (Preliminary) - Projection Total freight transport demand (tkm)
- 21. Total freight transport demand by transport mode (tkm) 2. Results (Preliminary) - Projection
- 22. Total freight transport demand by vehicle weight and fuel (tkm) Year of 2016 Diesel 2. Results (Preliminary) - Projection
- 23. The number of goods vehicles by vehicle weight band and fuel Year of 2016 Diesel 2. Results (Preliminary) - Projection
- 24. Business As Usual • Fuel related taxes (carbon tax, fuel taxes and diesel rebate scheme) • Vehicle taxes • Fuel economy/emission standard 2. Results (Preliminary) - Projection
- 25. Thanks!