Esri News for Federal Government Winter 2012/2013 issue
•
0 gostou•517 visualizações

Esri News for Federal Government Winter 2012/2013 issue

Recomendados
Mais conteúdo relacionado
Mais procurados
Mais procurados (20)
Semelhante a Esri News for Federal Government Winter 2012/2013 issue
Semelhante a Esri News for Federal Government Winter 2012/2013 issue (20)
Mais de Esri
Mais de Esri (20)
Último
Último (20)
Esri News for Federal Government Winter 2012/2013 issue
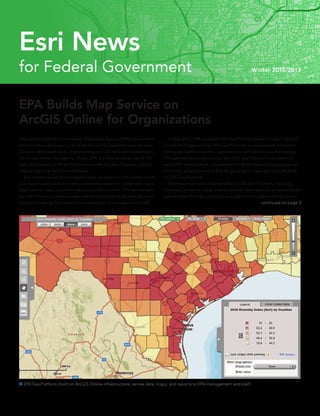
- 1. EPA Builds Map Service on ArcGIS Online for Organizations The United States Environmental Protection Agency (EPA) has worked with Esri through many cycles of technical development over the past 25 years. With each cycle, the prevalence of GIS tools and applications has grown within the agency. Today, EPA is a federal showcase of GIS web applications, such as its Environmental Dataset Gateway, Facility Registry Service, and EnviroMapper. Esri’s most recent technological cycle includes ArcGIS Online, which is a cloud-based, collaborative content management system for maps, applications, data, and other geospatial information. EPA saw the web service infrastructure as a viable means of publishing its own data and tools and making them even more accessible to managers and staff. EPA GeoPlatform, built on ArcGIS Online infrastructure, serves data, maps, and reports to EPA management and staff. In May 2012, EPA launched EPA GeoPlatform based on Esri’s ArcGIS Online for Organizations. EPA GeoPlatform is a framework for coordi- nating geospatial activities, applications, and data across the agency. EPA administrators announced that EPA GeoPlatform is available to every EPA employee as a foundation for all the agency’s geospatial ap- plications. Its policy now is that all geographic data and tools be built on EPA GeoPlatform. Administrators also cited benefits of EPA GeoPlatform, including increased access to place-based decision-making tools, a standardized look and feel for map products, and applications supported by a core continued on page 3 for Federal Government Winter 2012/2013 Esri News
- 2. Winter 2012/2013 Esri News for Federal Government is a publication of the Federal Government Solutions Group of Esri. To contact the Esri Desktop Order Center, call 1-800-447-9778 within the United States or 909-793-2853, ext. 1-1235, outside the United States. Visit the Esri website at esri.com. View Esri News for Federal Government online at esri.com/federal or scan the code below with your smartphone. Advertise with Us E-mail ads@esri.com. Submit Content To submit articles for publication in Esri News for Federal Government, contact Christopher Thomas at cthomas@esri.com or Emily Pierce at epierce@esri.com. Manage Your Subscription To update your mailing address or subscribe or unsubscribe to Esri publications, visit esri.com/manageyoursubscription. International customers should contact an Esri distributor to manage their subscriptions. For a directory of distributors, visit esri.com/distributors. Circulation Services For back issues, missed issues, and other circulation services, e-mail requests@esri.com; call 909-793-2853, extension 2778; or fax 909-798-0560. 2 Esri News for Federal Government Winter 2012/2013 Contents 1 EPA Builds Map Service on ArcGIS Online for Organizations 4 Moving Government Forward 5 Get Inspired 5 Mapping the Nation Giveaway 6 Federal Agencies Inducted into URISA GIS Hall of Fame 9 New and Noteworthy 9 Esri Online 10 USAID Maps Tell a Tale of Disaster Relief, Transition, and Development The information contained in this work is the exclusive property of Esri or its licensors. This work is protected under United States copyright law and other international copyright treaties and conventions. No part of this work may be reproduced or transmitted in any form or by any means, electronic or mechanical, including photocopying and recording, or by any information storage or retrieval system, except as expressly permitted in writing by Esri. All requests should be sent to Attention: Contracts and Legal Services Manager, Esri, 380 New York Street, Redlands, CA 92373-8100 USA. The information contained in this work is subject to change without notice. The Geographic Advantage, Esri, the Esri globe logo, 3D Analyst, ArcAtlas, ArcCatalog, ArcData, ArcDoc, ArcEditor, ArcExplorer, ArcGIS, the ArcGIS logo, ArcGlobe, ArcIMS, ARC/INFO, ArcInfo, ArcLogistics, ArcMap, ArcNetwork, ArcNews, ArcObjects, ArcPad, ArcPress, ArcReader, ArcSDE, ArcSurvey, ArcToolbox, ArcTools, ArcUser, ArcView, ArcVoyager, ArcWatch, ArcWeb, ArcWorld, ArcXML, Business Analyst Online, BusinessMAP, CommunityInfo, EDN, Geography Network, GIS Day, MapData, MapObjects, Maplex, MapStudio, ModelBuild- er, MOLE, NetEngine, RouteMAP, SDE, Sourcebook•America, StreetMap, Tapestry, @esri.com, esri.com, arcgis. com, geographynetwork.com, gis.com, and gisday.com are trademarks, service marks, or registered marks of Esri in the United States, the European Community, or certain other jurisdictions. Other companies and products or services mentioned herein may be trademarks, service marks, or registered marks of their respective mark owners. Copyright © 2013 Esri. All rights reserved. Printed in the United States of America.
- 3. set of national data services. It eliminates redundancy in deployment and use of GIS, which leads to cost savings. “Applications, data, and models served on EPA GeoPlatform help people do their jobs better and enhance environmental decision making,” says Harvey Simon, EPA’s acting geographic information officer. The agency-wide web mapping service allows EPA to use the Esri-hosted infrastructure in a managed, secure, and scalable cloud- based environment. EPA retains control of the service and security to administer role-based members and public and private groups. It can track usage and monitor storage and reports. EPA GeoPlatform includes three components: a public GIS cloud subscription service for accessing data and building web applications, a private cloud configuration for sharing data internally using role- based security, and data and application services built and distributed on its GIS server infrastructure in both public and private environments. It employs cloud service tools, viewers, and applications from ArcGIS Online, Community Analyst, and ArcGIS Explorer Online to make geospatial analysis more mainstream within the agency. EPA GeoPlatform supports EPA enforcement targeting, community- based grants analysis, and environmental justice screening. It also provides a wide range of data, applications, and maps to support its staff’s community-based work. Users work in a self-service environment to search for web maps and consume data from EPA’s dataset gateway, as well as from data.gov and ArcGIS Online. EPA GeoPlatform has a metered service so that the agency can watch traffic and load on its servers and respond by dynamically increasing or decreasing service support. The EPA map store helps staff members discover or publish web maps so that others can use them. Using a public-facing viewer, citizens can add their data to a map and use that map to support discussion. Looking Forward EPA is in the process of customizing Esri’s ArcGIS Explorer as a viewer that integrates EPA GeoPlatform data and services and environmental queries and models. Staff will use it to add data, such as demographic variables and particulate matter, ozone, and chemical data, to maps. Eventually, the viewer will be installed on all agency desktops. EPA also plans to customize the full ArcGIS desktop client to provide agency GIS capabilities. Working with Esri, EPA is customizing a version of Community Analyst called Environmental Analyst. It adds hundreds of EPA data layers to Esri’s thousands of demographic, health, economic, educa- tion, and business data layers. Staff will be able to ask questions, such as, Where should I target environmental enforcement actions? Does the area around a chemical facility have potential environmental justice concerns? What is the violation history of this dry cleaner? EPA GeoPlatform is at the center of EPA’s hosted map services. For more information, contact Latisha Petteway, press officer, United States Environmental Protection Agency, at petteway.latisha@epamail.epa.gov. “Applications, data, and models served on EPA GeoPlatform help people do their jobs better and enhance environmental decision making.” Harvey Simon, EPA’s Acting Geographic Information Officer 3Winter 2012/2013 esri.com/federal EPA Builds Map Service on ArcGIS Online for Organizations continued from cover
- 4. Moving Government Forward 2013 Esri Federal GIS Conference Preview More than 100 sessions and technical training opportunities will be offered this year. There will also be a Federal DevGeo session just for developers. Session tracks include the following: •• Implementing GIS in the Cloud •• Best Practices for Web Applications •• Mobile GIS •• Imagery and GIS •• GIS for Facilities Management •• Best Practices for Mission Applications •• GIS for Open Government •• Building National Spatial Data Infrastructures •• Leveraging Your GIS as a Collaborative Platform •• GIS in National Security •• Business Intelligence and Location Analytics The Federal GIS Conference brings together over 2,700 attendees for three days of intensive learning and collaboration. Whether you are new to the GIS community or want to advance your current geospatial projects, the Federal GIS Conference is a great place to get educated and stay updated. Visit esri.com/fedcon to register. At the Esri Federal GIS Conference this year, government executives, elected officials, managers, GIS professionals, and nongovernment organization staff will gather to discuss national issues. Big data, cloud technology, and open government will all be on this year’s agenda. Attend the conference to see how trends and technology are evolv- ing and hear about successful implementations in federal agencies. Dedicated session tracks will show you how you can use GIS to advance and modernize your organization. In addition to sessions and workshops, the EXPO area will have more training and networking opportunities than ever. Social events and special interest group meetings will provide opportunities to collabo- rate with federal leaders, GIS professionals, and Esri staff. Explore Esri and its partners will showcase the latest in geospatial solutions while providing learning opportunities around every corner of the EXPO floor. Demo theaters will feature briefings on new technology and applications, and hands-on learning experiences will help attend- ees explore new software. Enclosed areas for impromptu meetings will provide private places to talk with colleagues. 4 Esri News for Federal Government Winter 2012/2013
- 5. Each Federal GIS Conference attendee will receive a copy of the new Mapping the Nation: Pioneering a New Platform for Government. This book is a collection of maps developed by US federal agencies using both desktop and web-based GIS tools and applications. It shows how these tools are used daily by federal employees, officials, and in some cases the public to gather, analyze, and respond to questions and chal- lenges that range from the common to the catastrophic. More than 25 agencies across nine US departments have contrib- uted maps on subjects such as ecoregions, disaster planning, census distributions, hydrography, and pollution remediation. This book Get Inspired Professor Jacqueline McGlade Executive Director of the EEA Executive director of the European Environment Agency Jacqueline McGlade will give the Keynote Address this year. Previously, she served as a Natural Environment Research Council professorial fellow in environmental informatics in the mathematics department of University College London, where her main areas of research included spatial data analysis and informatics, expert systems, environmental technologies, and the international politics of the environment and natural resources. McGlade’s previous appointments have included director of the UK’s Centre for Coastal & Marine Sciences, director of Theoretical Ecology at the Forschungszentrum Jülich (Germany), associate professor at the Honda-funded International Ecotechnology Research Centre, and senior scientist in the federal government of Canada and in the United States. McGlade has worked extensively in North America, southeast Asia, and west Africa; published more than 100 research papers; written popular articles; and presented and appeared in many radio and television programs, including her own BBC series The Ocean Planet and Learning from Nature and, more recently, Our Arctic Challenge, a film about sport and tourism in Greenland. She has given public lectures worldwide on climate change, energy and sustainable development, environmental information, conflicts over environmental impacts of industrial and natural activities, environmental technologies, and the use of multimedia and modern forms of web communication. McGlade was chairman of the Earth Centre and a board member of the Environment Agency. She is currently a member of the Environment Advisory Committee of the European Bank for Reconstruction and Development, UK-China Forum, and UK-Japan 21st Century Group. She is also director of the software company View the World Ltd. Mapping the Nation Giveaway demonstrates how government’s use of GIS encourages citizen involve- ment, fosters understanding among divergent perspectives, and offers a new platform from which to compare and exchange information. To submit a map for consideration in the next edition, which will focus on return on investment, go to esri.com/presssubmit, project ID FederalROI. 5Winter 2012/2013 esri.com/federal 2013 Esri Federal GIS Conference Preview
- 6. Federal Agencies Inducted into URISA GIS Hall of Fame US National Aeronautics and Space Administration The National Aeronautics and Space Administration (NASA) is an initiator and sus- tainer of the remote-sensing revolution, which began 40 years ago, and has been essential to the development of GIS in the United States and around the world. NASA has been a leader in the development and use of remote-sensing data and tools and the evolution of GIS data and applications for a wide range of public- and private-sector organizations. This is supported by the vast number of professional papers and books or special publications that have been published, as well as a plethora of educational programs, workshops, and training courses that have been developed, which emphasize the utility of remote sensing in spatial analysis and mapping. Additionally, NASA has spurred the integration of remote-sensing technol- ogy with GIS over four decades of funding through its research, application, and educational programs to actively bring this technology to universities and federal, state, and municipal agencies via grants and cooperative agreements. Aerial imagery from aircraft and satellite platforms has played a critical role in GIS development. Since the 1960s, NASA has been at the forefront of acquiring such data, delivering tools and services for processing it, and providing GIS-based integration and applications for making use of remote-sensing data for imagery and GIS users throughout the world. Natural Resources Canada Throughout its history, Natural Resources Canada (formerly Energy, Mines, and Resources Canada) has played a leading, innovative role in the evolution of geo- matics internationally. It has done so through equal measures of research, educa- tion, training, and applications in all aspects of geographic information systems and science and has thereby served governments, private industry, independent researchers, the academic community, and ordinary citizens in Canada and the world at the highest level. The agency has made exemplary contributions to research, education, training, and applications in geographic information systems and science. Among its signif- icant contributions are the Atlas of Canada, automated cartography, the National Digital Topographic Database, RADARSAT, the Canadian Earth Observation Network, GeoBase, and the Pan-Canadian Action Plan. Denis Hains, director, Geodetic Survey Division for Natural Resources Canada, addresses conference attendees. Lawrence Friedl, Director, NASA Applied Sciences Program As a nonprofit association of professionals using GIS and other information technologies to solve challenges in government agencies, the Urban and Regional Information Systems Association (URISA) has a GIS Hall of Fame to honor leaders in the geospatial community. URISA promotes the effective and ethical use of spatial information and information technologies for the understanding and management of urban and regional systems. The people and organiza- tions it selects for the Hall of Fame propel the industry forward with creativity, innovation, leader- ship, perseverance, and a focus on community. The following is a look at the 2012 nominations for the esteemed Hall of Fame members. To see the entire descriptions of these organizations’ achievements, visit urisa.org/hall_of_fame. urisa.org 6 Esri News for Federal Government Winter 2012/2013
- 7. Statistics Canada In the 1960s, Statistics Canada used GIS technology to develop the Geographically Referenced Data Storage and Retrieval System (GRDSRS). GRDSRS produced custom-area statistics, which could not be derived using the programs of the day. Since the development of GRDSRS, Statistics Canada has vigorously and thoughtfully contributed to advancing the use of GIS through a commitment to research and innovation. One major consequence of this dedication is that the Area Master File (AMF) has evolved into a comprehensive spatial data infrastruc- ture supporting all phases of the agency’s activities including collection, process- ing, analysis, and dissemination of statistical data. The geographic data products developed, operationalized, and disseminated by Statistics Canada over the past 30 years have helped users adopt GIS for the mapping and analysis of data and were a key input in the development of many geographic datasets by governments at all levels, by firms in a wide range of sectors, as well as by faculty members and students in universities and colleges across Canada. Additionally, many members of URISA from Canada, the United States, and abroad have benefited and continue to benefit from the methodological exper- tise and practical experience that Statistics Canada professionals have brought and continue to bring to geographic information systems and science-related workshops, seminars, conferences, and published works, including those hosted by URISA. The organization has shown exceptional dedication to the education of users of GIS technology; the provision of increasingly diverse, user-oriented digital files for input to GIS technology; the advancement of research and innovation in numer- ous aspects of geographic information systems and science; the archiving of digital holdings; and improving the analytical potential of statistical data through the use of GIS technologies. The US Census Bureau The US Census Bureau is a worldwide leader in providing both the spatial and statistical data critical to GIS users, government partners, academia, the private sector, and the general public. Over the last 60 years, the Census Bureau has been a leader in statistical sampling and interviewing methodology, data processing, quality control, and cartographic techniques. The Census Bureau was the first user of the UNIVAC 1 computer after the 1950 Census and developed the Film Optical Sensing Device for Input to Computers for the 1960 Census. After the 1960 Census, the Census Bureau planned to move to a mail-out, mail-back system for the 1970 Census. This required geocoding of addresses and complex data processing to associate returned census forms to the cor- rect census block. The Census Bureau was a leader in the early development of computer mapping with the implementation of the Geographic Base File (GBF)/ Dual Independent Map Encoding (DIME) files for the 1970 and 1980 Censuses. In the 1970s, James Corbett of the bureau’s Statistical Research Division devised a system of map topology that ensures correct geographic relationships. Not only did his system provide a sound mathematical base for most future GIS work, it also led to the Topologically Integrated Geographic Encoding and Referencing (TIGER) system that is used by GIS offices around the nation. Rosemary Bender accepts the Hall of Fame honor from URISA president Greg Babinski on behalf of Statistics Canada. Thomas Mesenbourg, Acting Director, US Census Bureau (left), and Greg Babinski, URISA President continued on page 8 7Winter 2012/2013 esri.com/federal
- 8. These two major spatial data innovations allowed the expansion of low-level geographic areas and the associated census data. They also served as a catalyst for the rapid development of computer cartography that ultimately evolved into GIS technology. The legacy of early development continued with the 2010 Census, where TIGER data and census geographic areas were integral parts of the largest civilian deploy- ment of mobile GIS. The Census Bureau leadership role in geography and geospa- tial science continues with the planning of the 2020 Census. Utilizing continuing engagement with tribal, state, and local governments through geographic program enhancements, support of research to improve geospatial products, and contribu- tions to GIS conferences, the bureau continues to embrace changing technologies and techniques and strives to make greater amounts of data available to all. US Geological Survey The US Geological Survey (USGS) has made significant contributions to GIS and science in the early stages of development and continues to do so today. As a leader in remote sensing and mapping, dating from the 1930s with the introduc- tion of aerial photography, the USGS conducted pioneering research in the 1960s and 1970s in the use of high-altitude and multispectral photography for cartographic applications, regional environmental assessments, land-use and land-cover studies, and the design and development of digital geospatial data that became primary sources for GIS applications. Significant contributions during this time period include the formation of Earth Resources Observation Science (EROS), the launch of Landsat, the Land Use Data Analysis (LUDA) Program, the Geographic Information Retrieval and Analysis System (GIRAS), and the develop- ment and distribution of Digital Line Graph and digital elevation model (DEM) digital cartographic data. These products set a trend of publicly available USGS digital data that was continued in the 1980s with the development and release of TIGER data with the Census Bureau and digital orthophotos, a USGS innovation, collaboratively produced with the US Department of Agriculture (USDA), providing multiple coverages of the United States with high-resolution digital image data to support GIS applications. USGS continued to lead data efforts in GIS in the 1990s with the development of seamless national digital datasets and, through the Federal Geographic Data Committee (FGDC), coordinated development, use, sharing, and dissemina- tion of geospatial data on a national basis to promote the National Spatial Data Infrastructure (NSDI). The national datasets became the foundation databases for the National Map, the USGS topographic map of the twenty-first century that became the first available geospatial portal in 2001, and all data was made avail- able for free download over the Internet, providing another major advance for GIS applications and users. Partnerships with federal, state, and local government agencies and the private sector were essential to make GIS data, tools, and applications available to all. USGS continues its innovative solutions for GIS, developing new data and capabili- ties through the National Map and partnering with government and private entities to advance data and application capabilities of the GIS industry. USGS has made exceptional contributions to the geospatial sciences and the NSDI. It has developed a wide array of important and highly useful digital geospa- tial datasets as well as partnerships with government agencies at all levels and with the academic and private sectors for maintaining those datasets. USGS promotes the advancement of research and innovation in numerous aspects of geographic information systems and science. Mark DeMulder accepts the Hall of Fame honor from Greg Babinski on behalf of the US Geological Survey. 8 Esri News for Federal Government Winter 2012/2013 Federal Agencies Inducted into URISA GIS Hall of Fame continued from page 7
- 9. New and Noteworthy Powered by Esri’s market data, Zympi, Inc., a technology startup in Redlands, California, demonstrates the Shop Local concept to cities. This approach allows local businesses to identify, differentiate, and in- teract with their customers through a location-based app that delivers current promotions like coupons to people’s mobile phones. This real- time promotion reflects better targeting, resulting in better economic activities in cities and increases in tax revenue. For more information, visit zympi.com. The points on this map indicate where customers downloaded mobile coupons from the featured merchant. The customer overview describes the target audience. 9Winter 2012/2013 esri.com/federal Find an E-book Curl up with a good read at esri.com/ebooks. Recent additions to the library include the following: Geomedicine: Geography and Personal Health Bill Davenhall sets forth the notion that the emerging field of geomed- icine will produce a new type of medical intelligence that will leverage national spatial data infrastructures to benefit personal health. The Ocean GIS Initiative Marine professionals describe how they have used GIS for scientific exploration, ecosystem management, energy resource planning, and climate change analysis. Expand Your Use of GIS If you missed the ArcGIS 10.1: Transform Your Organization seminar, watch videos from the event online. See Esri staff demonstrate how ArcGIS 10.1 improves collaboration and sharing of geographic knowledge within and across government, businesses, and citizen groups. The video topics include the following: •• What’s New in ArcGIS 10.1 •• Esri Maps for Office •• Government-to-Citizen Collaboration •• Government-to-Government Collaboration esri.com/arcgis101videos Join the Online Community Follow us on Twitter: •• Esri Federal Government: @EsriFederalGovt •• Christopher Thomas, Director, Government Markets: @GIS_advocate •• John Steffenson, Federal Civilian and Global Affairs: @jsteffenson Visit the Map Gallery Esri’s online map gallery showcases current event maps, such as 2013 flu outbreak and storytelling maps that take you through places from Syria to the 50 largest malls in the United States. esri.com/mapgallery Esri Online This Vulnerable Flu Populations impact map shows crowdsourced flu reports by ZIP code with Esri demographic data for seniors and children younger than five years old.
- 10. Whether it is an earthquake in Haiti, massive flooding in Pakistan, or famine in Somalia, the United States provides humanitarian assistance, along with international donor and nongovernmental organization partners. The US Agency for International Development’s (USAID) Office of US Foreign Disaster Assistance (OFDA) leads and coordinates the US humanitarian response to disasters overseas, working with a clear mandate: save lives, alleviate suffering, and reduce the social and economic impact of disasters. If the scope of a disaster merits, OFDA can deploy a Disaster Assistance Response Team (DART) structured on the incident command system and tailored to international emergency response. The disaster response experts on the DART assess humanitarian conditions, co- ordinate the delivery of relief supplies, provide technical assistance, and relay information on priority needs to Washington, DC, where a Response Management Team (RMT) will have been activated. Specific to GIS purposes, the DART can capture field coordinates and infor- mation for use by GIS specialists in Washington. On the RMT, data maps are created that show what is happening where, which organizations are responding, how they are responding, and address development challenges related to economic growth, health, agriculture, environ- ment, education, and other sectors of concern to USAID. For example, the GeoCenter is using GIS to analyze agricultural terraces in Yemen, gender-based violence in Africa, malaria in Southeast Asia, and urbanization around the globe, among other issues. The GeoCenter works closely with OFDA and the Office of Transition Initiatives (OTI) within the USAID Bureau for Democracy, Conflict, and Humanitarian Assistance. These two offices use GIS and mapping to visually present and process information on needs and delivery of humanitarian assistance after a disaster or complex emergency. GIS is used to create in-depth data layers useful for assessing a situation, prioritizing resources, and providing a visual narrative of the disaster’s impact and aftermath and the status of response efforts. These efforts assist in providing the relief to countries that need it most. Examples include the following tales: The Stories of Relief Horn of Africa: The Horn of Africa has long suffered from cyclic weather patterns and drought, affecting millions of people’s lives and livelihoods across the region. In 2011, following the worst drought in decades, there was a deadly combination of drought-affected communities in Kenya and Ethiopia, refugees fleeing from Somalia into those countries, and population displacement inside Somalia. Communities inside Somalia were deeply affected by drought; conflict; and, in some regions, famine. Some of the maps created by the USAID Design Center to respond to the situation were those below: •• The Horn of Africa 2010 Rainfall map dramat- ically illustrated the severity of the drought, which dried crops and increased food prices. •• The Populations in Crisis by Famine Zone map showed where and to what degree people were devastated by famine. •• A Famine Relief map showed where relief camps were set up as well as the distances drought-affected populations had to walk to reach them—sometimes up to 100 miles. USAID Maps Tell a Tale of Disaster Relief, Transition, and Development To illustrate USAID’s response to the drought in the Horn of Africa, the Office of US Foreign Disaster Assistance (OFDA) produced this map, which illustrates the geographic scope of the crisis along with the varying levels of food insecurity in the region. where relief is needed (or not needed). GIS for humanitarian and development assis- tance is expanding daily, and the mapping at USAID is used to convey what is present where the agency is working: terrain, demograph- ics, transportation networks, election data, natural features, rainfall, and agriculture types. Analysis of GIS datasets helps in the design and implementation of aid and relief activities. The USAID GeoCenter Recently, under the overarching goals of USAID Forward, the USAID GeoCenter was opened to improve USAID impact by incor- porating geographic analysis into develop- ment programming. The GeoCenter serves as a geospatial knowledge hub for the entire agency, serving USAID missions overseas and at the agency’s Washington, DC, headquar- ters. It promotes use of geospatial information and analytical tools to augment the overall planning, monitoring, evaluation, and com- munication of its development work. To build the capacity of agency staff to use geographic information and tools, the GeoCenter holds regular trainings for agency staff in Washington, DC, and abroad. It also conducts analyses with technical teams that 10 Esri News for Federal Government Winter 2012/2013
- 11. Haiti: In January 2010, a devastating earth- quake struck the capital city of Port-au-Prince, with several hundred thousand people killed or injured and widespread damage to build- ings and infrastructure. The shaking turned a tremendous number of buildings to rubble, blocking access to homes, streets, schools, services, and workplaces and hampering recovery and reconstruction efforts. It was vital to know where rubble was most densely located so rubble removal, and in some cases building repair, could proceed. The United Nations, the Government of Haiti Public Works Ministry, and an international earthquake engineering firm collaborated on a USAID- funded effort to assess every building in Port- au-Prince and decide which were undamaged, which were damaged but repairable, and which needed to be torn down. OTI created a map—the Damaged and Destroyed Building Density and OTI Rubble Activities map—using the assessment data to show the density of rubble in earthquake-affected areas and indi- cate where rubble-clearing projects should be prioritized. USAID used this map to determine coverage of building debris areas, ensuring that assistance was not duplicative of other donor efforts and directing assistance where most needed. This was particularly important, as the United Nations (UN) was starting a large, USAID-funded rubble removal project, and this map was used in its project planning. Geospatial coordination, generally referred to as “who’s doing what, where” is a very When organized relief camps were set up in Haiti, OFDA created this map to depict the growth of spontaneous settlements that began to spring up outside their boundaries. Analyses of population patterns help determine where humanitarian aid is most needed. !( !( !( !( !( !(!( !( !( !( !( !(!( !( !( !( !( !( !( !( !(!( !( !( !( !( !( !(!( !( !(!(!( !( !(!( !( !( !( !(!( !( !( !( !(!( !( !( !( !( !( !( !(!( !( !( !(!( !( !( !( !( !( !( !( !( !(!( !( !(!(!( !( !( !( !( !( !( !(!( !(!( !( !( !( !(!( !( !(!( !( !( !( !( !( !( !( !( !( !( !(!( !(!( !( !( !( !( !( !( !( !( !( !(!( !( !( !( !( !( !( !( !( !(!(!( !( !( !( !(!( !( !( !(!( !(!( !( !( !( !( !( !( !( !( !( !( !(!( !( !(!(!( !( !( !( !(!(!(!( !( !(!(!( !( !( !( !(!( !( ") ") ") ") ") ") ") ") ") ")") ") ") ") ") ") ") ") ") ")") ") ") ") ") ")") ") ") ") ") ") ") ") ") ") ") ") ") ") ") ")") ") ") ") ") ")") ") ") ") ") ") ") ") ") ") ") ") ") ") ") ") ")") ")") ") ") ") ") ") ") ") ") ") ") ") ") ") ") ") ") ") ") ")") ") ") ") ") ") ") ") ") ")") ") ") ") ")") ") ") ") ") ") ") ") ") ") ") ") ") ") ") ")") ") ") ") ") ")") ") ") ") ") ") ") ") ") ") ") ") ") ") ") ")") ") ") ") ") ") ") ") ") ")") ") ") ") ") ") ") ")") ") ") ") ") ") ") ")") ") ") ")") ") ") ") ") ") ") ") ") ") ") ") ") ")") ") ") ") ") ") ") ") ") ") ") ") ") ") ") ") ") ") ") ") ") ") ") ")") ") ") ") ")") ") ") ") ") ") ") ") ") ") ") ") ") ") ") ") ") ") ") ") ") ") ")") ") ") ") ") ") ") ") ") ") ") ") ") ") ") ") ") ") ") ")") ")") ")") ") ") ") ") ") ") ") ") ") ") ") ") ") ") ") ") ") ") ")")") ")") ") ") ") ") ") ") ") ") ") ") ") ") ")") ") ") ") ") ") ") ") ") ") ") ") ") ") ") ") ") ") ") ") ") ") ") ") ") ") ") ") ") ") ") ") ") ") ") ") ") ") ") ") ") ") ") ") ") ") ") ") ") ") ") ")")") ") ") ")") ") ") ") ")") ") ") ") ") ") ") ") ") ") ") ") ") ") ") ") ") ") ") ")") ")") ") ") ") ") ") ") ") ") ") ") ") ") ") ") ") ") ")") ") ") ") ") ") ") ") ") ") ") ") ") ") ") ") ") ") ") ") ") ") ") ") ") ") ")")") ") ")") ") ") ") ") ") ") ") ") ") ") ") ") ") ") ") ")")") ") ") ") ")") ") ") ") ") ") ") ") ") ") ") ") ") ") ") ") ") ")") !( !( !( !( !( !( !(!( !( !( !( !( !( !( !( !( !( !( !( !( !( !(!( !( !( !( !( !( !( 1ère Varreux 1ère Turgeau 2ème Morne l'Hopital 3ème Martissant 2ème Varreux 4ème Bellevue la Montagne 1ème des Varreux 3ème Etang du Jong 1ère Montagne Noire 5ème Bellevue Chardonnière 4ème Bellevue 3ème Bellevue 3ème Petit Bois 11ème Rivière Froide 2ème Platon Dufréné 1ère Morne Chandelle 2ème des Varreux 10ème Thor 9ème Bizoton 3ème Taïfer 4ème Procy 1ère Saint martin 1ère Varreux 1ère Turgeau 2ème Morne l'Hopital 3ème Martissant 2ème Varreux 4ème Bellevue la Montagne 1ème des Varreux 3ème Etang du Jong 1ère Montagne Noire 5ème Bellevue Chardonnière 4ème Bellevue 3ème Bellevue 3ème Petit Bois 11ème Rivière Froide 2ème Platon Dufréné 1ère Morne Chandelle 2ème des Varreux 10ème Thor 9ème Bizoton 3ème Taïfer 4ème Procy 1ère Saint martin Delmas Carrefour Petion-Ville Cite Soleil Tabarre Croix-des-Bouquets Port-au-Prince Lamentin 52-54 Carrefour / Arcachon Martissant Bolosse Carrefour Feuilles Lower Delmas Bel Air Fort National Poste Marchand / Poupelard Solino / Nazon Mais Gate Nerette & Delmas 62 1. 2. 3. 4. 5. 6. 7. 8. 9. 10. 11. 12. F O C U S A R E A S 1 2 4 5 6 7 9 8 10 3 11 12 1 2 4 5 6 7 9 8 10 3 11 12 Aeropor International Toussaint Louverture Rue Merc adieu Ru e Boisr and Canal Rt de Peguyvill Rue M L Tortur Rue Lysiu s Sal om on NoNam e Rue J. Poupelard R u e S ylvio Cator NoName R. Péralte Ru Mercadieu NoN ame NoName Rue Sans Fil Impass Alexis Ru Des Dalles De lma 5 R. Fragneauville Delmas23 R Brouard RAQua lo RueGeffrard Rue Plask a zo NoName Del ma25 Rte T. Cavaller R. Faustin Rue Syl vi Cator Ru Bois ran d Canal RueThe o dule Ru Mercadieu D elm a 31 Ave nu M.Am broise Delm a 4 R Bro u ar d R.Annoual Delma 37 RueR.Jules R.P. Lumu m ba Rue Riviere De lm a 4 8 R.Bolosse1ére Delmas 95 Delma77 Tabarre 21 Ruelle Mayar Mar ti s sa n t23 Ru San Fil R. Estimo Fort Nationa Rte T. Cavalle Ru B org e ll R.Dalencourt Rue Mackanda R.S Me nos Rte. des Dalles Ruelle Archille Ru Sans Fi l Rue P. Lum umba Rue Kawa Rue Sylvi Cato Rue T. Louverture Delma 6 Sant 19 Ru ChristRo RueOvide9 Delma 33 New Boulevard B du 15 Oct obre Ave.Marie-Jeanne Bouliva rdRTRUMA Clercine1 Route D Delma Avenue Mais Gat B J L Desaline Route de Carrefour Delma 3 Blv T ou ss a i n t L ouve rt ure Rout Du Rai Bd JJ La Desalin Bd du 15 Octob r RueCapois R. des Miracles A ve nue S o leil RueGregoire Ru eMetellus Rue Lila vois (Ce ssles se) RueGregoire Avenue L a Martiniere (Bois-Ver n a) RueGeffrard Rue Durand BdTou ssaint Louverture RueCapois No N ame R.Lamarre Rue Lambert Avenue Soleil NoName Rue Du Cana pe ver t RouteNationa lNr1 Avenue Je an Pau l II Ave . M a rtin L. Kin g Rue Lambert New Boulevar d R. Dr Audin Av. J. Brown Blvd Des Ind ust ries Ave Pan Americaine Rou te9 BdJJDessal ines(Gran d Ru e) Rte De Cazeau Route De Santo Route De Kenscoff Delmas 10 5 ( Rte de Freres) Bd Toussa int Louverture RueMagny Rue Bois Patate Rou te Nat ional Nr 1 Rue Pavee 0 0.8 1.6 Miles 0 0.7 1.4 2.1 Kilometers DAMAGED AND DESTROYED BUILDING DENSITY AND OTI RUBBLE ACTIVITIES The boundaries and names used on this map do not imply official endorsement or acceptance by the U.S. Government. GEOGRA PHIC INFORMATI O N UNIT U S A ID/DCHA/O T I L E G E N D Chemonics Current OTI Partner Focus Areas OTI Activities Since January 2010 Density of Damaged and Destroyed (Yellow and Red) Buildings from MTPTC Building Assessment Data Chemonics Focus Areas DAI Focus Areas Other USAID Partner Areas !( DAI Map as of 2/22/2011 Data as of 2/11/2011 Base Data from CNIGS/MINUSTAH Low High ") Note: All colored areas have at least some yellow and red buildings. For this calcuation, yellow buildings counted once, red buildings counted twice. No data available for Petion-Ville. No data available for Petion-Ville Commune. After the Haiti earthquake, the Office of Transition Initiatives created this density map to focus rubble removal activities and get aid to disaster victims. GIS tools to site treatment centers accessible to people within a five-block radius of their homes. They also calculated the distances to these centers from rural areas, with maps using slope analysis because the surrounding regions were mountainous and difficult to travel. Pakistan: In 2011, monsoon rains again led to severe flooding in Sindh Province in south- ern Pakistan. Media coverage appeared to indicate it was as widespread as the massive floods the previous year, which had impacted the entire country, not just southern regions of Pakistan, but that was not an accurate por- trayal. USAID used GIS to compare 2011 flood data with that of the previous 2010 disaster, which helped inform decision making, ensur- ing an appropriate response to the actual, and still significant, humanitarian needs. Looking ahead, the USAID GeoCenter, OFDA, and OTI have begun to create interac- tive, web-based maps to enable development professionals and the public to dive deeper into data, increase their knowledge of the en- vironment and situation, and achieve greater results in relief and development. For more information, visit usaid.gov. The data behind the maps mentioned in this article is available on data.gov. important part of international aid and development work, and mapping is a great tool for this. In every country with an OTI presence, maps showing where OTI is working and what the office is doing in those locations have been used with other donors and groups active in the area to assist with coordination and planning. Maps can clearly display on one page what a long document or spreadsheet may need many pages to explain. Haiti—Corail Camp Settlement: When organized relief camps were set up, spontane- ous settlements began to spring up outside their boundaries. A map called Subsequent Unplanned Growth in Surrounding Areas was created and includes aerial imagery that reveals the sprawl. Analysts outlined the Corail camp’s boundary and gridded the camp area. Next, they determined the square meters of development outside the boundary and estimated the population based on tent sizes, which they could discern from the im- agery. Image analysis included polygons and square meters. A time analysis map showed a five-month population change that clearly depicted the growth of these settlements. Haiti—Cholera Outbreak: An outbreak of cholera in fall 2010 quickly spread across Haiti. The US government’s disaster response drew on GIS analysis indicating the best locations to set up cholera treatment centers and clean water distribution points. USAID, working with the Centers for Disease Control and Prevention, located outbreaks, studied density, and used 11Winter 2012/2013 esri.com/federal
- 12. Presorted Standard US Postage Paid Esri 380 New York Street Redlands, California 92373-8100 usa Solve National Challenges with Geospatial Technology. We’ll help you get there. Esri Federal GIS Conference February 25–27, 2013 | Washington, D.C. Federal employees attend at no charge. esri.com/fedconesrinews Copyright © 2013 Esri. All rights reserved. 133840 DUAL55M2/13tk