
Recomendados
Mais conteúdo relacionado
Mais procurados
Mais procurados (20)
Semelhante a Eops 2016 02_08
Mais de EOPS EOPS
Mais de EOPS EOPS (20)
Último
Último (20)
Eops 2016 02_08
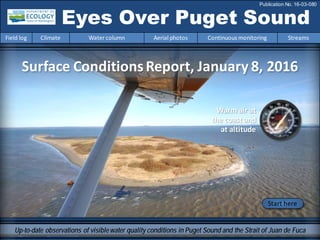
- 1. Surface ConditionsReport, January 8, 2016 Eyes Over Puget Sound Field log Climate Water column Aerial photos Continuous monitoring Streams Publication No. 16-03-080 Up-to-date observations of visiblewater quality conditions in Puget Sound and the Strait of Juan de Fuca Start here Warm air at the coast and at altitude
- 2. Personalfield log p.3 Ecology’s R/V Skookum,a 26-ft Almar gets the jobdone when conditions are foggy or windy. Climateconditions p. 4 Air temperatures were above normal for January and accompaniedwithstrongtemperature inversions andcold, sunny days. El Niño conditions prevail. Watercolumn p. 5 Winter showers bring change! Withrecent precipitation,salinity is remarkably lower but temperatures are still at record-breaking highs in Puget Sound. At the Coast,water is fresher. Aerialphotography p. 9 Jellyfishstill aggregate inpatches in finger inlets of SouthSound. First signs of increasingphytoplanktonincoastal bays that mix with boggy waters. Continuous monitoring p. 31 Near-surface water onthe ferry route remains cool andwell mixed. Turbidity was higher in the Strait of Juande Fuca than Puget Sound. Streams p. 34 While we’re losing a bit of snowpack to this warmweather,our snowpack is still in muchbetter shape than it was at this time last year. But rivers have responded to warmer conditions. LONG-TERMMARINEMONITORINGUNIT Skip Albertson Dr. Christopher Krembs Julia Bos Suzan Pool Editorial assistanceprovided by: Suzan Pool, CarolMaloy Marine conditionsfrom 2-8-2016 at a glance Field log Climate Water column Aerial photos Continuous monitoring Streams Mya Keyzers Laura Hermanson Jim Shedd Don Watt
- 3. It’s a boat, it’s a plane, it’s… whatever it takes to get data! Personal Field Impression Field log Weather Water column Aerial photos Continuous monitoring Streams Personal Field Impression Field log Climate Water column Aerial photos Continuous monitoring Streams What are we doing on a boat? Using a floatplane makes sensewhen your job is to collect water quality samples fromthe Canadian border to the most southern inlets in Puget Sound and to cover a lot of ground in a shortperiod of time. But sometimes Pacific Northwestweather precludes the use of a plane. That’s when Ecology’s R/V Skookum, a 26-ftAlmar, comes into play. Itgets the job done when conditions are too foggy or windy for the floatplane. Laura collectingwater samplesfrom the CTD.c Using the boat works well to sample Hood Canal, Central Sound,and Coastal Bay stations. Mya taking fieldnotes.
- 4. Field log Climate Water column Aerial photos Continuous monitoring Streams Natural Influencesleadingto 2-8-2016 Climate and naturalinfluences,includingweather,rivers,and the adjacent ocean,canaffect our marine waters. Graphics are basedonprovisional data andare subject to change. http://www.ecy.wa.gov/programs/eap/mar_wat/weather.html,page 26. Putting the puzzle piecesof influencing factorstogether… lowerhigher expected No data *UpwellingAnomalies(PFEL) ENSO = El Niño SouthernOscillation * Summary for January 2016: Air temperatures wereabove normal in the Puget Sound lowlands. The month began, however, with strong temperature inversions and cold, sunny days. Precipitationlevels wereabove normal, except to the north. Sunshine levels weregenerally abovenormal. River flows wereslightly above normal. Downwelling was strong and ENSO remained in the warm phase (El Niño).
- 5. We usea chartered floatplane and boat to access our monthly monitoring stations. We communicate data and environmentalmarine conditions using: 1. Marine Water Condition Index (MWCI) 2. Eyes OverPuget Sound (EOPS) 3. Anomaliesand sourcedata Field log Climate Water column Aerial photos Continuous monitoring Streams Ourlong-termmarinemonitoringstationsinWashington Starthere Isl. .
- 6. Field log Climate Water column Aerial photos Continuous monitoring Streams ArePugetSoundconditionsnormalizing? Year 2015 was a recordbreaker for water temperature inPuget Sound andfor global temperatures. Prematuremelting of the snowpack inearly summer causedinitially freshconditions. InJuly,unusually high salinities startedappearingin response to drought and generally very low river flows. Fortunately,the winter brought a lot of rainand, as a result, estuarine circulationhas increasedto renew the water withinPuget Sound. Yet, watertemperatures are still high! The Fraser River is the largestfreshwater sourcefor the Salish Sea, significantly affecting estuarine circulation. As of January 2016 (left),the Blobbelow the surface is still alive! Rivers are flowinghigher andincreasingwater exchange. This is an opportunity to bring cooler oceanwater into Puget Sound. Inwinter andspring 2015, the Fraser River and other rivers dischargedprematurely. Very low summer flows followedandinhibited the renewal of water inPuget Sound. Rivers are now normalizingor running higher. Estuarine circulation is expectedto rebound. Source: http://wateroffice.ec.gc.ca/index_e.html 0 2000 4000 6000 8000 10000 12000 Dec-13 Jan-14 Feb-14 Mar-14 Apr-14 May-14 Jun-14 Jul-14 Aug-14 Sep-14 Oct-14 Nov-14 Dec-14 Jan-15 Feb-15 Mar-15 Apr-15 May-15 Jun-15 Jul-15 Aug-15 Sep-15 Oct-15 Nov-15 Discharge(m3s-1) Higher than normal Lower thannormal Expected Credit: Christopher Krembs Readhere Alaska“Blob” Tracker
- 7. Physical conditionstracked in historicalcontext Field log Climate Water column Aerial photos Continuous monitoring Streams Explore profiles at all stations Still higher temperature in P. Sound ExpectedOxygenSalinity now below normal Winter showers bring change! Withrecent precipitation,salinity is remarkably lower thannormal. In Puget Sound, temperatures are still at record-breakinghighs but not at the coast. Oxygenis mostly expectedeverywhere. (Color observations fall outside 50% of our historical observations) Region 1 2 3 4 5 6 7 8 9 10 11 12 1 2 3 4 5 6 7 8 9 10 11 12 1 2 3 4 5 6 7 8 9 10 11 12 1 2 3 4 5 6 7 8 9 10 11 12 1 2 3 4 5 6 7 8 9 10 11 12 1 2 3 4 5 6 7 8 9 10 11 12 2015 Whidbey Basin Hood Canal Central Sound South Sound 20142014 Grays Harbor Willapa Bay North Sound San Juan 20142015 2015
- 8. a) PacificDecadalOscillationIndex(PDO,temperature) (explanation) b) UpwellingIndex(anomalies)(Upwelling,low oxygen) (explanation) c) NorthPacificGyreOscillationIndex(NPGO, productivity) (explanation) Field log Climate Water column Aerial photos Continuous monitoring Streams Theoceanaffectswaterquality: OceanClimateIndices NPGO(x10) PDO/UpwellingIndex Three-year running average of PDO, Upwelling, and NPGO indices scores . Ocean boundaryconditions are in transition: (a)water is warm (PDO), (b) upwellingoflow oxygen and high nutrient ocean water are higher (UpwellingIndex anomaly),and (c) lower surface productivityalong the coast (NPGO). -25 -20 -15 -10 -5 0 5 10 15 20 25 -1.5 -1 -0.5 0 0.5 1 1.5 1945 1950 1955 1960 1965 1970 1975 1980 1985 1990 1995 2000 2005 2010 2015
- 9. Summary: Aerial photography2-8-2016 Jellyfish still aggregatein patches in finger inlets of South Sound. Firstsigns of increasing phytoplankton in coastalbays thatmix with boggy waters. Field log Climate Water column Aerial photos Continuous monitoring Streams Start here Mixing and Fronts: Tidal fronts nicely visible in Grays Harbor. Debris: Occasionalfloating organic debris near coastal beaches. Visible blooms: Murky water with tint of red in Grays Harbor and near Naselle River estuary. Jellyfish: Patches persistin Budd, Eld, and Totten Inlets. BloomDebrisFront Suspendedsediment: High sediment loads fromrivers, winds, high tide, and large waves createa lot of suspended sediment near the coast. Plume Very warmair (72 °F ) flowedinlandat an altitude of 2000 feet while near the water surface,coldair flowedtoward the coast at 20 kts. This warmair reachedthe higher snow-covered elevations inthe Puget Soundregion. Reading72 °F onour outside cabin thermometer at analtitude of 2500 feet during our flight returning fromthe coast.
- 10. Grays Harbor Willapa Bay Field log Climate Water column Aerial photos Continuous monitoring Streams Good visibility,sunnywarm air, layered system with opposite wind directions (ground -cold air flowing west; 2500 ft – warm air flowing east) Flight Information: Aerial photography and navigation guide 7 Flight route 9 3 2 8 Tide data (Nahcotta, Willapa Bay): Pred High/Low 01:30 AM 9.78 H 07:06 AM 2.6 L 01:00 PM 11.74 H 07:44 PM -1.08 L 6 10 11 12 14 15 13 4 5 16 17 18 19 20 1
- 11. Low hanging clouds flow into Eld Inlet,cold air near the ground flow to the west (see smoke). Location: Eld Inlet (South Sound),9:43 AM. 1 Aerial photography 2-8-2016 Navigate Field log Climate Water column Aerial photos Continuous monitoring Streams smoke boat
- 12. 2 NavigateAerial photography 2-8-2016 Field log Climate Water column Aerial photos Continuous monitoring Streams Jellyfishpatches are still present in Budd, Eld, and Totten Inlets. Location: Eld Inlet (South Sound),9:51 AM. jellyfish jellyfish jellyfish boat
- 13. 3 NavigateAerial photography 2-8-2016 Jellyfishpatches are still present in Budd, Eld, and Totten Inlets. Location: Eld Inlet (South Sound),9:52 AM. Field log Climate Water column Aerial photos Continuous monitoring Streams jellyfish fishpens jellyfish
- 14. 4 Navigate Field log Climate Water column Aerial photos Continuous monitoring Streams Aerial photography 2-8-2016 Brown-colored Chehalis River plume with bright brown pockets; a bloom of phytoplankton? Location: Rennie Island (Grays Harbor),10:14 AM. Plume Plume
- 15. 5 NavigateAerial photography 2-8-2016 Field log Climate Water column Aerial photos Continuous monitoring Streams Large number of seals hauled out on a sand bank in the middle of the bay. Location: Grays Harbor,10:40 AM. seals
- 16. Brown-colored water of Duck Lake stained by humus flow into coastal bays. Location: Ocean Shores (Grays Harbor), 10:46 AM. 6 NavigateAerial photography 2-8-2016 Field log Climate Water column Aerial photos Continuous monitoring Streams
- 17. Brown-colored water of Duck Lake stained by humus flow into coastal bays. Location: Ocean Shores (Grays Harbor), 10:46 AM. 7 NavigateAerial photography 2-8-2016 Field log Climate Water column Aerial photos Continuous monitoring Streams Plume seals suspendedsediments
- 18. Large waves suspend sediment at entrance to Grays Harbor. Location: Oyhut Recreation Wildlife Area (Ocean Shores), 10:47 AM. 8 NavigateAerial photography 2-8-2016 Field log Climate Water column Aerial photos Continuous monitoring Streams suspendedsediments
- 19. Incoming tide at the entrance to Grays Harbor. Colors indicate three different water masses. Location: Westhaven State Park(Westport),10:48 AM. 9 NavigateAerial photography 2-8-2016 Field log Climate Water column Aerial photos Continuous monitoring Streams 2 1 3
- 20. 10 NavigateAerial photography 2-8-2016 Incoming tide at the entrance to Grays Harbor. Colors indicate three different water masss. Location: Westhaven State Park(Westport),10:48 AM. Field log Climate Water column Aerial photos Continuous monitoring Streams 2 1 3
- 21. NavigateAerial photography 2-8-2016 Large waves break on the high-energy beaches with a backwash all the way to the dunes. Location: Westhaven State Park(Westport),10:48 AM. Field log Climate Water column Aerial photos Continuous monitoring Streams 11 2 1 3
- 22. NavigateAerial photography 2-8-2016 Large waves break on the high-energy beaches. Brown-colored diatom blooms near beach. Location: Near Grayland(Washington Coast),10:52 AM. Field log Climate Water column Aerial photos Continuous monitoring Streams 12 suspendedsediments Bloom Debris
- 23. A. NavigateAerial photography 2-8-2016 Challenging to tell apart! Plume of boggy water or diatom bloom? Location: A.North Cove, B. Stackpole Slough,Leadbetter Point State Park(WashingtonCoast),10:54 AM. Field log Climate Water column Aerial photos Continuous monitoring Streams 13 Bloom boggy water boggy waterB.
- 24. NavigateAerial photography 2-8-2016 Reddish sediment or beginning red-brown algal bloom. Location: Long Island Slough,WillapaNational Wildlife Refuge (WillapaBay),11:59 AM. Field log Climate Water column Aerial photos Continuous monitoring Streams 14 Bloom
- 25. NavigateAerial photography 2-8-2016 Sediment-richNaselle River water (1) meetingLong Island Slough (2). Location: StanleyPoint,Naselle River (Willapa Bay),11:59 AM. Field log Climate Water column Aerial photos Continuous monitoring Streams 15 2 1
- 26. NavigateAerial photography 2-8-2016 Sediment-richNaselle River water (1) meetingLong Island Slough water with red-brown bloom (2). Location: Paradise Point,LongIsland (Willapa Bay),11:59 AM. Field log Climate Water column Aerial photos Continuous monitoring Streams 16 2 1
- 27. NavigateAerial photography 2-8-2016 High tide is flooding mudflats. Location: Near Bay Center (Willapa Bay),12:05 PM. Field log Climate Water column Aerial photos Continuous monitoring Streams 17
- 28. NavigateAerial photography 2-8-2016 Niawiakum River banks flooded by high tide. Location: NiawiakumRiver Natural Area Preserve (Willapa Bay),12:06 PM. Field log Climate Water column Aerial photos Continuous monitoring Streams 18
- 29. NavigateAerial photography 2-8-2016 Dikes keeping high tide off the fields. WillapaRiver in the background. Location: Range Point (WillapaBay), 12:09 PM. Field log Climate Water column Aerial photos Continuous monitoring Streams 19
- 30. NavigateAerial photography 2-8-2016 Dikes keeping high tide off the fields. In the background, WillapaRiver and flooded mudflats. Location: South Bend (WillapaBay),12:09 PM. Field log Climate Water column Aerial photos Continuous monitoring Streams 20
- 31. Field log Climate Water column Aerial photos Continuous monitoring Streams Continuousmonitoring 2-8-2016 Summary of Victoria Clipper IVferry data: Near-surface water onthe ferry route remains cool andwell mixed. Turbidity was higher in the Strait of Juande Fuca thanPuget Sound. Early February had an increase of colored dissolvedorganic matter (CDOM)inWhidbey Basin. The Victoria Clipper IV carries sensorsin its sea chest. The sensorsallow us to plot overtime transects of: A. Temperature B. Chlorophyll C. Turbidity D. CDOM Over time,we see the dynamic of these variablesin surface water betweenSeattle and Victoria,BC. A. B. C. D.
- 32. Field log Climate Water column Aerial photos Continuous monitoring Streams Continuousmonitoring 2-8-2016 Victoria Olympic Peninsula Seattle Victoria Olympic Peninsula Seattle Victoria Olympic Peninsula Seattle Victoria Olympic Peninsula Seattle A. B. C. D. Figures show daily sensor data installedonthe ferry which measure near-surface water at 5-sec intervals while the Victoria Clipper IV transits between Seattle andVictoria,BC. A. Sea Surface Temperature: Water was isothermal inPuget Sound and the Strait of Juande Fuca. B. Chlorophyll: Concentrations were low,particularly in the Strait. C. Turbidity: Turbidity was low onentire route. D. Colored Dissolved Organic Matter(CDOM): Particulates in the water were abundant in Central Basinandnearly absent in the Strait.
- 33. Check out our posters that we presentedat the Coastal and Estuarine Research Federation conference in Portland, Oregon during November 2015. Field log Climate Water column Aerial photos Continuous monitoring Streams Continuousmonitoring 2-8-2016 Bos,J.,S. Albertson, C. Krembs,S. Pool,C. Falkenhayn Maloy,andB. Sackmann. 2015. EcosystemThresholds in Surface Waters of the SalishSea using Continuous Measurements fromFerry Sensors. Poster presented at Coastal Estuarine andResearchFederation2015 Conference,Portland,Oregon. WashingtonState Department of Ecology PublicationNo. 15-03-041. https://fortress.wa.gov/ecy/publications/documents/1 503041.pdf Pool,S.S.,C. Krembs,J. Bos,andB. Sackmann. 2015. Physical,Chemical,andBiological Conditions during Noctiluca Blooms inanUrbanFjord, Puget Sound. Poster presentedat Coastal Estuarine andResearch Federation2015 Conference,Portland,Oregon. WashingtonState Department of Ecology Publication No. 15-03-040. https://fortress.wa.gov/ecy/publications/documents/1 503040.pdf
- 34. Rivers respond to warm air temperatures Field log Climate Water column Aerial photos Continuous monitoring Streams Warmtemperatures,clear skies,and abundant sunshine brought snowmelt runoff andincreased flows to streams flowingoffof the foothills ofthe Cascade andOlympic Mountains onFebruary 8th and 9th. Temperatures between2000 and4000 feet inelevationwarmedinto the 60s onMonday and Tuesday,andremainedin the low to mid 50s Monday night. A sharp increasein streamflow started Monday afternoon on the NorthFork StillaguamishRiver atOso, consistentwith warmair temperatures. Don Watt, Ecology Rainfall in the area ended around mid-day on Saturday, meaning that Monday’s spike instream flow is a result of melting of recently fallensnow. click for data click for data Time (Day in Feb) Time (Day in Feb) Riverflow(cfs) Cumulativerainfall(in)
- 35. Rivers respond to warm air temperatures Field log Climate Water column Aerial photos Continuous monitoring Streams A similar rise in stream flow on Monday afternoon can be seen on the hydrograph fromtheUSGS streamgageon the NorthFork Skokomish River near Hoodsport. While we are losinga bit of snowpackto this warm weather, things are still in decent shape for February. But will El Niño conditions continue? Read NOAA’s El Niño update: January El Niño Update: It’s got a lot going on Author: Emily Becker. Thursday, January 14, 2016 Read here click for data
- 36. Jim Shedd, Ecology Snow and rivers state-wide conditions Field log Climate Water column Aerial photos Continuous monitoring Streams http://www.wrcc.dri.edu/wwdt/archive.php?folder=pon1 January 2016 monthly mean for rivers and streams across Washington compared to historic January flows. In January, the south and western zones of the Puget Sound basin experienced higher streamflows than normalin responseto above normal precipitation. See link to January precipitation map: http://www.wrcc.dri.edu/wwdt/archive.php?folder=mdn1 Snow water equivalencies including the Olympic Peninsula are normal or slightly above normal on February 10. In January, temperatures werenear normal throughoutthe Puget Sound basin. We arein much better condition than last year but temperatures are warmer than normal. Link to January temperaturemap:
- 37. Accessmooring data: ftp://www.ecy.wa.gov/ea p/Mooring_Raw/Puget_S ound/ Continuous monitoring : Suzan.Pool@ecy.wa.gov Get data from Ecology’sMarine MonitoringPrograms Long–Term MonitoringNetwork Real–Time Sensor Network Accesscore monitoringdata: https://fortress.wa.gov/ec y/eap/marinewq/mwdata set.asp christopher.krembs@ecy.w a.gov Ecology’s long-termmarine monitoring stations Continuous track Field log Climate Water column Aerial photos Continuous monitoring Streams Riverand Stream WaterQuality Monitoring http://www.ecy.wa.gov/programs/eap/fw_riv /rv_main.html Discontinued (fundingcuts)
- 38. You may subscribe or unsubscribe to the Eyes Over Puget Sound email listservby going to: http://listserv.wa.gov/cgi-bin/wa?A0=ECOLOGY-EYES-OVER-PUGET-SOUND Many thanks to our business partners: Clipper Navigation,SwantownMarina,andKenmore Air. We are looking forfeedbackto improve ourproducts. Dr. ChristopherKrembs christopher.krembs@ecy.wa.gov Marine Monitoring Unit EnvironmentalAssessment Program WA Department of Ecology Field log Climate Water column Aerial photos Continuous monitoring Streams