3. PURPOSE
Develop 2 models to predict Californian ecoregions
Optimise each model’s parameters
Develop an unbiased sampling technique
Assess & compare each model’s performance using cross-
validation
4. APPROACHES & JUSTIFICATION
Decision Tree
Numeric or nominal predictions
One or more categories
Intuitive rules
Unlimited models possible
Support Vector Machine
Numeric or nominal predictions
One or more categories
Abstract hyperplane class seperation
One optimal model per training set
http://www.cse.unsw.edu.au/~billw/cs9414/notes/ml/06prop/id3/id3.html http://docs.opencv.org/doc/tutorials/ml/introduction_to_svm/introduction_
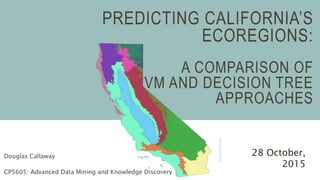
5. CASE STUDY:
PREDICTING CALIFORNIA’S
ECOREGIONS
12 distinct regions
Determined by EPA in 2013
“Denote areas of general similarity in ecosystems
and in the type, quality, and quantity of
environmental resources.” (U.S. Environmental
Protection Agency, 2013)
11. 50
55
60
65
70
75
80
85
5 25 45 65 85
Accuracy(%)
Test Set Size (%)
SVM Accuracy vs. Cross Validation Test Set
Size
1
8
20
30
40
50
60
70
80
3 23 43 63 83Accuracy(%)
Test Set Size (%)
Decision Tree Accuracy vs. Cross Validation
Test Set Size
Underfit
Overfit
1
8
CHOOSING APPROPRIATE TEST
SET SIZES
Overfit
Underfit
12. UNBIASED SAMPLING:
CHOOSING DISPERSED TEST
LOCATIONS
Weather stations spatially clustered around
populated areas
n random locations generated within study area
Weather stations nearest random points chosen
for test set
18. CONCLUSIONS & DISCUSSION
Locations near borders difficult to classify
Decision tree model more intuitive, less accurate
SVM good at separating classes (high dimensionality)
Applications
Assess climate change risk
E.g. what areas are likely to change if temperatures increase?
Find similar climates elsewhere
E.g. what other areas will support a crop normally grown in California?