National monitoring system of the situation with internally displaced persons. Report 2, April 2016
•
0 gostou•36 visualizações

National monitoring system of the situation with internally displaced persons. Report 2, April 2016

Recomendados
Recomendados
Mais conteúdo relacionado
Mais procurados
Mais procurados (16)
Semelhante a National monitoring system of the situation with internally displaced persons. Report 2, April 2016
Semelhante a National monitoring system of the situation with internally displaced persons. Report 2, April 2016 (20)
Mais de DonbassFullAccess
Mais de DonbassFullAccess (20)
Último
Último (20)
National monitoring system of the situation with internally displaced persons. Report 2, April 2016
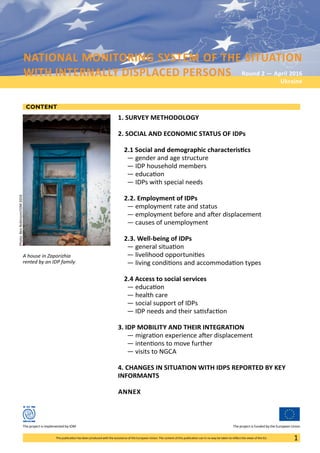
- 1. The project is funded by the European UnionThe project is implemented by IOM This publication has been produced with the assistance of the European Union. The content of this publication can in no way be taken to reflect the views of the EU. 1The views expressed in this publication do not necessarily reflect the views of the European Commission. This project is funded by the European Union This project is implemented by IOM NATIONAL MONITORING SYSTEM OF THE SITUATION WITH INTERNALLY DISPLACED PERSONS Round 2 — April 2016 Ukraine CONTENT 1. SURVEY METHODOLOGY 2. SOCIAL AND ECONOMIC STATUS OF IDPs 2.1 Social and demographic characteristics — gender and age structure — IDP household members — education — IDPs with special needs 2.2. Employment of IDPs — employment rate and status — employment before and after displacement — causes of unemployment 2.3. Well-being of IDPs — general situation — livelihood opportunities — living conditions and accommodation types 2.4 Access to social services — education — health care — social support of IDPs — IDP needs and their satisfaction 3. IDP MOBILITY AND THEIR INTEGRATION — migration experience after displacement — intentions to move further — visits to NGCA 4. CHANGES IN SITUATION WITH IDPS REPORTED BY KEY INFORMANTS ANNEX A house in Zaporizhia rented by an IDP family Photo:BenRobinson/IOM2016
- 2. The views expressed in this publication do not necessarily reflect the views of the European Commission. This project is funded by the European Union This project is implemented by IOMThe project is funded by the European Union The project is implemented by IOM This publication has been produced with the assistance of the European Union. The content of this publication can in no way be taken to reflect the views of the EU.2 SURVEY METHODOLOGY The International Organization for Mi- gration (IOM), in cooperation with the Ukrainian Center for Social Reforms and with the financial support of the European Union, conducted a survey on internally displaced persons in Ukraine to contribute to the establish- ment of a National Monitoring System (NMS) in the country based on the approaches used for the Displacement Tracking Matrix (DTM). The information support of NMS is performed by combining data ob- tained from multiple sources, namely: — administrative data; — data from key informant interviews and focus group discussions; — data of sample surveys of IDP households and the local population; — telephone interviews with IDPs who were beneficiaries of IOM projects of assistance; — available relevant data from other sources. The object of the NMS is the IDP popu- lation at their place of settlement in 24 oblasts of Ukraine and the city of Kyiv. The subject of this survey is the situa- tion and problems related to IDPs’ lo- cation, their movements or intentions to move further, return intentions, and local communities’ perception of the IDPs’ situation in 24 oblasts of Ukraine and the city of Kyiv. Target groups: • Key informants — representatives of local communities, local authorities, IDP communities, non-governmental organizations (NGOs), educational and healthcare establishments; • IDP individuals and households; • Local population. The survey collects information on: socioeconomic characteristics of IDPs and IDP households, IDP trends and movement intentions, employment and livelihood of IDPs, IDP access to social services, preferred durable solutions and assistance needs as well as analysis and recommendations on the ways to solve the problems and information required to compile index of social cohesion. The work to assess the locales of resettlement by administrative-terri- torial units and collect information on IDPs by assessed resettlement locales (numbers; main desegregations; vulnerable groups; GPS coordinates) is also being conducted and adjusted with the support of regional monitors. The information will be presented in the final report. Children raised in family-type orphanage founded by IDPs from Luhansk Region Photo:BenRobinson/IOM2016
- 3. The views expressed in this publication do not necessarily reflect the views of the European Commission. This project is funded by the European Union This project is implemented by IOMThe project is funded by the European UnionThe project is implemented by IOM This publication has been produced with the assistance of the European Union. The content of this publication can in no way be taken to reflect the views of the EU. 3 With the purpose to conduct face-to- face interviews with key informants and IDP households, a territorial sample comprising 300 units was devised (sample distribution by oblasts is provided in Table 1 below). The general population of regis- tered IDPs as of December 2015 was stratified by oblast. The selection of territorial units was carried out with the probability proportional to the number of registered IDPs in each of them. In each territorial unit, two key informants and two IDP households were selected for the first round of the NMS. Oblast Number of territorial units selected Total 300 Vinnytsia 5 Volyn 5 Dnipropetrovsk 13 Donetsk 88 Zhytomyr 5 Zakarpattya 5 Zaporizhia 18 Ivano-Frankivsk 5 Kyiv city 18 Kyiv oblast (excluding Kyiv) 7 Kirovohrad 5 Luhansk 35 Lviv 5 Mykolaiv 5 Odesa 6 Poltava 5 Rivne 5 Sumy 5 Ternopil 5 Kharkiv 30 Kherson 5 Khmelnytsky 5 Cherkasy 5 Chernivtsi 5 Chernihiv 5 A list of key informants with their contact information has been formed across the country to monitor the developments of the situation with internally displaced persons in the regions. The information on distribu- tion of key informants by oblast may be found in table 2 below. Table 1. Distribution of the sample for territorial units within oblasts of Ukraine Table 2. Distribution of key informants Oblast Number of key informants Total 608 Vinnitsa 10 Volyn 10 Dnipropetrovsk 26 Donetsk 176 Zhytomyr 10 Zakarpattya 10 Zaporizhia 36 Ivano-Frankivsk 10 Kyiv city 36 Kyiv (excluding Kyiv) 14 Kirovohrad 10 Luhansk 73 Lviv 10 Mykolaiv 10 Odesa 13 Poltava 10 Rivne 10 Sumy 10 Ternopil 10 Kharkiv 61 Kherson 10 Khmelnytsky 10 Cherkasy 10 Chernivtsi 10 Chernihiv 13
- 4. The views expressed in this publication do not necessarily reflect the views of the European Commission. This project is funded by the European Union This project is implemented by IOMThe project is funded by the European Union The project is implemented by IOM This publication has been produced with the assistance of the European Union. The content of this publication can in no way be taken to reflect the views of the EU.4 The sample survey of IDP households for face-to-face interviews envisages the formation of a stratified multistage probability sample of households. The monthly sample size makes up no less than 600 households. The cumulative sample size for four months will be no less than 2,400 households. This will provide a reliable assessment of key indicators at the national level (on a monthly basis) as well as a regional one based on data consolidated during February-May 2016. The distribution of IDP households for face-to-face interviews within the second round of the NMS is provided in Table 3 below. Oblast Number Total 600 Vinnitsa 10 Volyn 10 Dnipropetrovsk 26 Donetsk 176 Zhytomyr 10 Zakarpattya 10 Zaporizhia 36 Ivano-Frankivsk 10 Kyiv city 36 Kyiv (excluding Kyiv) 14 Kirovohrad 10 Luhansk 70 Lviv 10 Mykolaiv 10 Odesa 12 Poltava 10 Rivne 10 Sumy 10 Ternopil 10 Kharkiv 60 Kherson 10 Khmelnytsky 10 Cherkasy 10 Chernivtsi 10 Chernihiv 10 Table 3. Distribution of IDP households for face-to-face interviews The sample survey of IDPs conducted via telephone interviews was formed on the database of IDPs who were beneficiaries of IOM projects of assis- tance, namely projects on uncondi- tional cash assistance and livelihood opportunities. The cash assistance projects covered the most vulnerable households with IDPs corresponding to one of the following vulnerability criteria: elderly (70+); people living with disabilities (1, 2 type) including disabled children; families with 3+ children; single-headed households with a child (ren). The database of IDP groups covered by IOM projects provides limitations related to the representativeness of the survey but allows for the triangu- lation of information obtained from other sources and to better under- stand the trends observed. Table 4. Distribution of IDP households for telephone interviews Oblast Number Total 1,114 Kyiv city 40 Kyiv (oblast) 78 Mykolaiv 202 Odesa 201 Poltava 203 Sumy 200 Zaporizhzhia 120 Zhytomir 70 Cherkasy 205 Chernihiv 200
- 5. The views expressed in this publication do not necessarily reflect the views of the European Commission. This project is funded by the European Union This project is implemented by IOMThe project is funded by the European UnionThe project is implemented by IOM This publication has been produced with the assistance of the European Union. The content of this publication can in no way be taken to reflect the views of the EU. 5 SOCIAL AND ECONOMIC STATUS OF IDPS 2.1 Social and demographic characteristics 0 10 20 30 40 Figure 2. Age disaggregation of surveyed IDP household members, % 60+ 35 — 59 18 — 34 5 — 17 0 — 4 Figure 3. IDP household size, % ≥4 people 3 people 2 people 1 person 26 27 28 20 0 10 20 30 40 Adults Round 1 Round 2 18 — 29 18 21 30 — 54 51 51 55 + 31 28 Table 5. Age disaggregation of IDPs As in the first round of the survey, the number of women among IDP respondents exceeds three times the number of men (73 per cent to 27 per cent). The sex disaggregation of IDP household members over two rounds is presented in fihure 1 below. As per fugure 2 and table 5 below, the largest number of people who moved are the age group from 35 to 39 years old (at 29 per cent in the first round and 34 per cent in the second one), followed by the 18 to 34 age group at about 23 per cent in both rounds, 5 to 17 age group with about 20 per cent, 60 + age group with 13 per cent, and 0 to 4 age group with 9.5 per cent (Figure 2). The average size of the IDP house- holds surveyed in the second round is 2.82 people (2.85 people in the first round). Almost twenty per cent (19.5%) are single, 28 per cent of the households consist of two people, 27 per cent have three household mem- bers, and 25.5 have four and more (Figure 3).Figure 1. Sex disaggregation of IDP household members, % 4258 Female Male 4357 Female Male Round 1 Round 2 15 13 29 34 24 23 21 20 11 10 Round 1 Round 2
- 6. The views expressed in this publication do not necessarily reflect the views of the European Commission. This project is funded by the European Union This project is implemented by IOMThe project is funded by the European Union The project is implemented by IOM This publication has been produced with the assistance of the European Union. The content of this publication can in no way be taken to reflect the views of the EU.6 The level of education among the surveyed IDPs is quite high — 53 per cent of them have higher or incom- plete higher education, 28 per cent have specialized secondary educa- tion and other 17 per cent — second- ary education. The social status of the respondents is quite diverse: 27 per cent are in full-time employment, 20 per cent do not work and receive benefits, 16 per cent are non-working pensioners by age, 11 per cent are unemployed without unemployment benefits, 6 per cent are unemployed receiving unemployment benefits, and 5 per cent are unemployed (householders, students). According to the survey findings, 53 per cent of IDP households have children. Most of them have one child in the household, one third has two children, every eighth household has three and more children (Figures 4 and 5). Social Status Round 1 Round 2 In full-time employment 24 28 In part-time employment 6 8 Working retirement pensioners 1 2 Self-employed 1 1 Non-working retirement pensioners 20 22 Unemployed without unemployment benefits 15 12 Unemployed, receives unemployment benefits 5 5 Do not work, receive pension or benefits (disabled persons; persons on maternity leave) 16 13 Unemployed (householder; students) 11 7 Other 1 2 Table 6. Distribution of households of surveyed IDPs by social status of 18+ respondents Figure 4. Children in the family, % 4555 With children Without children 4852 With children Without children Round 1 Round 2 Figure 5. Households with children, % of surveyed households ≥3 children 2 children 1 child 0 20 40 60 13 11 32 30 55 59 Round 1 Round 2 Round 1 Round 2 With students 3 7 Without students 97 93 Table 7. Households with students, % of surveyed households Round 1 Round 2 With disabled persons 14 10 Without dis- abled persons 86 90 Table 8. Households with disabled per- sons, % of surveyed households
- 7. The views expressed in this publication do not necessarily reflect the views of the European Commission. This project is funded by the European Union This project is implemented by IOMThe project is funded by the European UnionThe project is implemented by IOM This publication has been produced with the assistance of the European Union. The content of this publication can in no way be taken to reflect the views of the EU. 7 Almost all IDPs surveyed (92.8%) were registered with the social pro- tection authorities, and only 16.1% are registered with the State Emer- gency Service. (Table 11) Round 1 Round 2 Households with working/nonworking retirement pensioners (according to respondents) 28 29 Table 9. Households with members of vulnerable categories (children, students, pensioners, disabled people), % of surveyed households Round 1 Round 2 Households with members of vulnerable categories 81 73 Households with members of no vulnerable categories 19 27 Table 10. Households with members of vulnerable categories (children, students, pensioners, disabled people), % of surveyed households Registration with social state authorities State Emergency Service Round 1 Round 2 Round 1 Round 2 Yes 94.0 92.8 23 16 No 5.6 7.0 68 77 Do not know 0.4 0.2 9 7 Table 11. Registration in state authorities, % of the surveyed Displaced family currently living in Nikopol, Southern Ukraine Photo:BenRobinson/IOM2016
- 8. The views expressed in this publication do not necessarily reflect the views of the European Commission. This project is funded by the European Union This project is implemented by IOMThe project is funded by the European Union The project is implemented by IOM This publication has been produced with the assistance of the European Union. The content of this publication can in no way be taken to reflect the views of the EU.8 Less than half of the IDP households surveyed have regular income from employment. Among households whose members receive salaries, every fifth also has income from ir- regular jobs (Table 12). The involvement of IDPs in employ- ment is quite low at the new places of residence. Twenty-eight per cent of people who worked before displacement have managed to find a job at the new locations. On the other hand, about five per cent (4.5%) of those who did have job before moving to a new place have gotten involved into employment (Table 13). 2.2. Employment of IDPs Household Income Source Share of IDPs with Relevant Income Source Round 1 Round 2 Salary 40 41 Irregular side jobs 14 22 Table 12. IDPs citing income from employment as main income source of their households, % Curently employed Employed before displacement Round 1 Round 2 Yes No Yes No Yes 27 4 28 5 No 39 30 34 34 Table 13. Change in employment status after displacement, % Note. Respondents could select several options. Sector of Activity before Displacement Share of people employed before displacement Share of people employed before displacement out of those en- gaged in the relevant sector Round 1 Round 2 Round 1 Round 2 Industry 22 15 37 58 Transportation 4 5 34 36 Trade 17 19 41 37 Services 24 20 36 45 Construction 4 4 55 60 Other 28 10 51 55 Education — 9 — 46 Public administration — 12 — 40 Health care — 6 — 38 Total 100 100 41 45 Table 14. IDPs employed before displacement by sector of activity change in employment status of IDPs by sector, % IDP providing refurbishment services in Zaporizhia Photo:BenRobinson/IOM2016
- 9. The views expressed in this publication do not necessarily reflect the views of the European Commission. This project is funded by the European Union This project is implemented by IOMThe project is funded by the European UnionThe project is implemented by IOM This publication has been produced with the assistance of the European Union. The content of this publication can in no way be taken to reflect the views of the EU. 9 6 months to a year More than a year Less than 6 months Less than a month Did not respond Figure 6. IDPs employed after displacement by duration of employment, % IDPs who were engaged in construc- tion, industry and education have better chances of finding work after displacement. IDPs engaged in trans- portation before displacement have more concerns related to employ- ment. If we compare the structure of employment after displacement with the structure of employment before displacement, we can note a consid- erable increase in the share of ser- vices sectors (from 20% to 28%) and decrease in case of the other sectors (Tables 14 and 15). Most IDPs employed after displace- ment are engaged in the same sec- tors of the economy they worked in previously. Almost two-thirds (2/3) of the employed IDPs reported that their current job corresponds to their qualifications; the greatest share of such a response can be found among health care employees, teachers/ lecturers, civil servants and industrial professionals. IDPs who managed to find a job after displacement, mostly have stable jobs. One out of three employed IDPs have been in their current jobs for less than six months (Figure 6). Most IDPs who do not have a job reported the need for support in finding employment. The main type of possible solution that IDPs prefer is the direct provision of a job. Ten per cent of unemployed IDPs (9.9%) or sixteen per cent (16.2%) of those who indicated a need for assistance in getting a job reveal an interest in starting their own business. Sector of Activity before Displacement Share of IDPs employed after displacement Share of IDPs, whose job corresponds to qualification Round 1 Round 2 Round 1 Round 2 Industry 10 12 68 90 Transportation 2 2 64 57 Trade 17 19 46 39 Services 30 28 55 44 Construction 7 4 79 65 Other 34 14 76 52 Education — 7 — 92 Public administration — 9 — 87 Health care — 4 — 99 Total 100 100 64 60 Table 15. IDPs employed after displacement by sector of activity change in employment status of IDPs by sector, % 0 10 20 30 40 32.3 39.3 31.6 26 26.6 29.1 8 5 1.6 0.6 Type of Support Round 1 Round 2 Retraining 4 9 Employment 39 31 Support in establishment of own business 7 10 Consultation in employment center 4 4 Other 7 3 Do not need a job 36 39 Did not respond 3 4 Table 16. IDPs who do not have jobs by type of preferred support, % Round 1 Round 2
- 10. The views expressed in this publication do not necessarily reflect the views of the European Commission. This project is funded by the European Union This project is implemented by IOMThe project is funded by the European Union The project is implemented by IOM This publication has been produced with the assistance of the European Union. The content of this publication can in no way be taken to reflect the views of the EU.10 The general level of well-being of most IDPs is low. Forty-two per cent of IDPs have to cut down expenses even for food, thirty-seven per cent of IDPs are able to buy only food, nineteen per cent satisfy only es- sential needs, and less than one per cent (0.7%) of the surveyed IDPs have savings (Table 17). The average monthly income per IDP household member for 59 percent of surveyed IDPs is up to 1,330 UAH1 , twenty-eight per cent have 1,331- 2,500 UAH at average per household member, and 13 per cent have more than 2,501 UAH (Figure 7). The main sources of income for peo- ple in displacement are given in Table 23. The most important source of income is provided by social benefits. Salaries and pensions also comprise a significant share in the total income of IDP households. For a third of respon- dents, humanitarian aid is an impor- tant source of subsistence. Irregular earnings and family support are the main sources of income for 22% and 11.6%, respectively (Table 18). 2.3. Well-being of IDPs Response options Round 1 Round 2 We have had to cut down expenses for food 46.6 42.3 We have enough funds only for food and put off other needs 33.5 37.0 We have enough for food, necessary clothes, footwear, basic needs, but did not manage to make savings. 19.0 19.5 We have enough for food, clothes, footwear, and other purchases. We have savings, but make them for necessary expensive purchases. 0.4 0.7 Refuse to answer 0.5 0.5 Table 17. IDP self-assessment of the financial standing of their households, % UAH: Up to 1330 1331 — 2500 2501 — 3000 3001 — 4000 4001 — 5000 5001 and more 70 50 30 10 Figure 7. Distribution of IDP households by income level, % 65 27 4 3 0.4 1 59 28 6 4 2 1 Round 1 Round 2 1 According to official estimates based on the household living conditions survey, the average monthly total income per household member for the general population amounted to 2,026.25 UAH in the third quarter of 2015. The minimum monthly subsistence level per capita established by the state for 1 January-30 April 2016 is 1330 UAH (http://rada.gov.ua/news/Novyny/122459.html). 2 Multiple options were possible when answering to the question. The table provides information on the percentage of respondents who confirmed the availability of the income source. Round 1 Round 2 Salary 40 41 Part time or irregular job 14 22 Pension 38 36 Support of relatives 13 12 IDP allowance 44 54 Social benefits 45 44 Humanitarian assistance 30 37 Table 18. Main sources of income in IDP household, %2
- 11. The views expressed in this publication do not necessarily reflect the views of the European Commission. This project is funded by the European Union This project is implemented by IOMThe project is funded by the European UnionThe project is implemented by IOM This publication has been produced with the assistance of the European Union. The content of this publication can in no way be taken to reflect the views of the EU. 11 Respondents who do not have job or livelihood opportunities intend to satisfy their basic household needs by reducing costs (61%), address- ing state authorities (29%), NGOs or international organizations (31%), by working on weekends or more hours per day (22%) or with the support of relatives and friends (21%) (Table 19). According to the survey results, most IDPs live in and pay for their own accommodation — sixty seven per cent (67%) rent different types of accommodation — rented apartment (42%), rented house (19.5%), rented room in apartment (6.3%). A signifi- cant share of IDPs (22.5%) live with relatives or hosting families. Twenty per cent of IDPs live in dormitories and collective centers (Figure 8). Round 1 Round 2 Reduce household expenditures 45 61 Will agree to unsafe or illegal job 5 6 Will agree to work on weekend or more hours per day 22 22 Will sell things 8 3 Receive support from relatives and friends 19 21 Try to address state authorities 32 29 Try to access NGO or international organization 26 31 Return to place of living before displacement 8 6 Table 18. Coping strategies in case of no job and livelihood opportunities, % of respondents Rented apartment Rented room Rented house Hosting family or relatives Dormitory Collective centre Other 0 15 25 35 45 Figure 8. IDP accommodation type, % 35 42 8 6 13 20 19 22 13 6 9 1 3 3 Round 1 Round 2 Knitting is both a hobby and the business for this IDP Photo:BenRobinson/IOM2016
- 12. The views expressed in this publication do not necessarily reflect the views of the European Commission. This project is funded by the European Union This project is implemented by IOMThe project is funded by the European Union The project is implemented by IOM This publication has been produced with the assistance of the European Union. The content of this publication can in no way be taken to reflect the views of the EU.12 Most IDPs are satisfied with living conditions. Major complaints refer to insulation and living space as well as to sewerage and heating (Table 19). Fewer concerns relate to safety and availability of electricity. Round 1 Round 2 Satisfied Neither satisfied, nor dissatisfied Dissatisfied Satisfied Neither satisfied, nor dissatisfied Dissatisfied Availability of electricity 84.7 8.8 6.5 91 3 6 Living space 66.6 14.2 18.5 76 7 17 Supply of water 73.6 13.4 12.3 83 8 9 Safety 78.4 11.5 9.6 88 6 6 Heating 70.8 12.8 16.1 77 8 15 Thermal insulation 65.4 14.4 19.0 72 10 18 Sewage 67.8 14.6 16.6 79 6 15 Table 19. IDP self-assessment of living conditions, % of respondents IDP from the Donbas in a greenhouse she received from IOM to grow grocery for her family and for sale Photo:BenRobinson/IOM2016
- 13. The views expressed in this publication do not necessarily reflect the views of the European Commission. This project is funded by the European Union This project is implemented by IOMThe project is funded by the European UnionThe project is implemented by IOM This publication has been produced with the assistance of the European Union. The content of this publication can in no way be taken to reflect the views of the EU. 13 The accessibility of social services for IDPs reveals the ability to meet the needs of IDPs in vital services and is an important aspect of their integra- tion into the host community. The main point of respondents’ concern is the lack of employment opportunities (Table 20). The vast majority of respondents (80%) are satisfied with the social environment of their current place of residence, and that is an important illustration of the positive attitude of host communities to IDPs and IDPs’ inclination for integration. Only 6% of respondents are not satisfied with the social environment. The levels of IDPs’ satisfaction with the possibility of receiving social as- sistance (71%) and pensions (53%) are quite high. Seventeen per cent (17%) and five per cent (5%) of respondents respectively are dissatisfied with the mentioned services (Table 20). The accessibility of such important public services as education and medical care raises some concerns of IDPs. Fifteen per cent (15%) of respondents are dissatisfied with the possibilities for accessing them, 9% neutrally evaluate the issue, 73% are satisfied. Given that medical services are to be equally accessible to the whole population of the country and their accessibility is closely related to sustaining life, such a rate of dissatis- faction is moderate. Six per cent (6%) of respondents are dissatisfied with the possibilities of obtaining education or enrolling children in schools and/or kindergar- tens, almost eight per cent (8%) of respondents are neutral about access to education, twenty two per cent (22%) are undecided, sixty-four per cent (64%) are satisfied with existing capabilities to obtain education. Job opportunities raise most con- cerns. Thirty-three per cent (33%) per cent of respondents noted that they are dissatisfied with opportunities to get a job, twelve per cent (12%) are neutral, thirty eight per cent (38%) are satisfied. In comments to the question “Please explain your dissat- isfaction with public services”, about half of the respondents state lack of job vacancies in general and employ- ment possibilities in the specialty. Regarding access to essential spheres of public life, the interviews with key informants prove that IDPs’ access to employment and accommodation is particularly complicated. All other areas — health, education, social protection, public services — are con- sidered by most of key informants to be rather accessible for IDPs. 2.4 Access to social services Round 1 Round 2 Satisfied Neither satisfied, nor dissatisfied Dissatisfied Do not know Satisfied Neither satisfied, nor dissatisfied Dissatisfied Do not know Accessibility of health care services 59 14 22 5 73 9 15 3 Employment opportunities 31 16 34 9 38 17 33 12 Possibilities to obtain edu- cation and enroll children in schools/kindergartens 57 12 12 19 64 8 6 22 Social environment 74 16 8 2 80 12 6 2 Possibility of receiving pen- sion payments 68 15 13 4 53 5 5 27 Possibility of receiving social support 68 15 13 4 71 9 17 3 Table 20. IDPs satisfaction with public services and environment, % of respondents
- 14. The views expressed in this publication do not necessarily reflect the views of the European Commission. This project is funded by the European Union This project is implemented by IOMThe project is funded by the European Union The project is implemented by IOM This publication has been produced with the assistance of the European Union. The content of this publication can in no way be taken to reflect the views of the EU.14 Interviews with IDPs correlate with key informant interviews that reveal the lack of jobs, low wages, high prices and lack of accommodation for rent as the most relevant IDP problems. A significant share of key informants (2/5) underscored the relevance of such issues as the poor state of infrastructure, difficulties in accessing health care and problems in doing business. The fewest num- ber of complaints refer to safety and access to educational institutions. The main reasons for IDPs’ dissatis- faction with public services are the lack of jobs (38%), lack of resources (24%), lack of information support (34%), brusque treatment of IDPs (22%) and corruption (21%) (Table 21). Almost all key informants note that IDPs need special attention and support. The main areas of support, according to the interviewed key informants, should be financial assis- tance, support with accommodation and in employment, and psychologi- cal support. Ten per cent of the experts noted the need for support of the interaction between IDPs and local residents, while the rest consider that the local population and IDPs will find mutual understanding without additional tools. Most key informants believe that IDPs are enough or partially inte- grated into the local community. The most important factors that contribute to the integration of IDPs into the local community, according to key informants of both rounds, are employment opportunities, afford- able housing and social protection. Round 1 Round 2 Lack of necessary documents 13 8 Lack of funds 44 24 Lack of information 30 34 Corruption 20 21 Brusque treatment 28 22 Transport accessibility 5 9 Other 27 13 Lack of job vacancies — 38 Table 21. Reasons for IDPs’ dissatisfaction with public services, % of respondents who responded positively Accountant displaced from Donetsk became a public activists in Zaporizhia, consulting other IDPs Photo:BenRobinson/IOM2016
- 15. The views expressed in this publication do not necessarily reflect the views of the European Commission. This project is funded by the European Union This project is implemented by IOMThe project is funded by the European UnionThe project is implemented by IOM This publication has been produced with the assistance of the European Union. The content of this publication can in no way be taken to reflect the views of the EU. 15 IDP MOBILITY AND THEIR INTEGRATION Almost 99% of the surveyed IDPs come from the Donbas, and the number of people who left Donetsk Oblast is nearly twice the number of those who were displaced from Luhansk Oblast (Figure 9). For the vast majority of IDPs, the current place of residence is the first location after displacement, where they have lived for at least a month. IDPs who initially moved from Crimea most rarely moved, as compared to people displaced from the NGCA of Luhansk Oblast. The main reasons that prod IDPs to move again after displacement are issues with housing. On the other hand, the unavailability of health care facilities and lack of educational possibilities have rarely been deter- mined as reasons to move farther. Region of origin Round 1 Total Round 2 Total AR Crimea Donetsk Oblast Luhansk Oblast AR Crimea Donetsk Oblast Luhansk Oblast Did not move after dis- placement from place of origin 80 72 71 71 96 75 74 75 Moved farther, including: 20 28 29 29 4 25 26 25 Once 1 15 7 12 0 10 6 9 Twice 0 8 13 10 4 8 13 10 Three and more 19 5 9 7 0 6 7 6 Table 24. Distribution of IDPs by number of movements in displacement, % by place of origin AR Crimea 64%35% 1% Luhansk oblast Donetsk oblast Figure 9. Distribution of IDPs by place of origin, % AR Crimea 67%32% 1% Luhansk oblast Donetsk oblast Round 1 Round 2 Round 1 Round 2 Lack of employment opportunities 17 14 Problems with housing 40 41 High rental payment for housing 29 36 Safety issues 12 9 Lack of education possibilities 2 1 Inaccessibility of healthcare facilities 2 2 Social environment 3 6 Other 20 12 Table 23. IDPs’ reasons to move again after displacement, % of people who responded to the relevant question Round 1 Round 2 Yes 33.7 30.4 No 65.8 69.4 No response 0.5 0.2 Table 22. Visits to NGCA after first displacement, %
- 16. The views expressed in this publication do not necessarily reflect the views of the European Commission. This project is funded by the European Union This project is implemented by IOMThe project is funded by the European Union The project is implemented by IOM This publication has been produced with the assistance of the European Union. The content of this publication can in no way be taken to reflect the views of the EU.16 Do you plan to stay in the current place of living? Region of origin Round 1 Total Round 2 Total AR Crimea Donetsk Oblast Luhansk Oblast AR Crimea Donetsk Oblast Luhansk Oblast Yes, forever 20 10 17 13 23 11 15 12 Yes, at least for a year — 12 1 11 16 9 14 11 Yes, till the conflict ends 52 54 41 49 18 54 40 49 Yes, other 14 1 3 2 4 2 9 4 No 8 5 10 7 1 5 5 5 Difficult to respond 6 18 18 18 38 19 17 19 Table 25. Distribution of IDPs by number of movements in displacement, % by place of origin Every eighth IDP intends to remain permanently in the current place of residence. The highest rate is for IDPs from Crimea, the least – for IDPs coming from Donetsk Oblast. At least 3/5 of IDPs plan to stay remain in the current settlement till the end of the conflict or for a year. The vast major- ity of those who intend to relocate plan to settle in Ukraine. Almost one-third of IDPs are going to return some time to the NGCA. The majority of IDPs with such an intention came from Donetsk Oblast. About half of the IDPs from Donetsk and Luhansk oblasts and more than one-third of the IDPs from Crimea are undecided about their intentions to return to their place of residence before displacement (Table 26). The majority of respondents claim that there are no people in their households who have returned for permanent residence to the non-gov- ernment-controlled areas. Thirteen per cent (13%) of IDPs reported hav- ing such persons. Do you plan to return to your place of living before displacement Region of origin Round 1 Total Round 2 Total AR Crimea Donetsk Oblast Luhansk Oblast AR Crimea Donetsk Oblast Luhansk Oblast Yes 8 47 39 44 8 43 24 37 No 22 19 27 22 58 17 28 21 Difficult to respond 70 34 34 34 34 40 48 42 Table 26. Distribution of IDPs by intention to return to their places of living before displacement, % Do you have household members who returned to NGCA? Region of origin Round 1 Total Round 2 Total AR Crimea Donetsk Oblast Luhansk Oblast AR Crimea Donetsk Oblast Luhansk Oblast Yes 36 12 14 13 19 11 17 13 No 64 86 83 85 77 86 81 84 Difficult to respond 0.0 2 3 2 4 3 2 3 Table 27. Distribution of IDPs by presence of household members who returned to their places of living before displacement, %
- 17. The views expressed in this publication do not necessarily reflect the views of the European Commission. This project is funded by the European Union This project is implemented by IOMThe project is funded by the European UnionThe project is implemented by IOM This publication has been produced with the assistance of the European Union. The content of this publication can in no way be taken to reflect the views of the EU. 17 CHANGES IN SITUATION WITH IDPS REPORTED BY KEY INFORMANTS Approximately one-fifth of the 608 key informants stated that during the last month there have been some changes in the requests and prob- lems with which IDPs address them more frequently. Major changes refer to significant increase in IDPs’ requests related to the suspension of social benefits and relevant legal advice in this regard. IDPs also more often inquire about humanitarian aid, in particular food and medicine. About sixteen per cent (16%) of informants observed the change in relevance of the problems faced by people in their communities: signifi- cantly increased relevance of high prices, unemployment and problems with accessing health care services; lack of housing for rent, accessibility of educational services, difficulties in doing business and safety issues were considered as somewhat aggravated. The issue of low wages is also topical. One-tenth of key informants report- ed the introduction of new regional or national assistance programs for IDPs implemented in their localities. In spite of the fact that the ques- tion concerned regional or state programmes, most informants also stated the programmes implemented by non-governmental or internation- al organizations: among state and regional pro- grammes, key informants cited a regional programme on integration, social adaptation and protection of IDPs, activities related to professional retraining of employable IDPs, com- pensation of expenses for rent; financial, humanitarian, legal aid of such organizations as Ukrainian Rubezhi (including the one aimed at the development of self-employ- ment), Ukrainian Women’s Fund (programmes for IDP), New Donbass (restoration of schools), New Vidlik (program to support small businesses of IDPs); among international organizations, key informants referred to programs and grants from the United Na- tions, IOM, Caritas-Ukraine, Legal Assistance Center of the Norwegian Refugee Council (NRC) under the “Information, Counseling and Legal Assistance” (ICLA), and ASF (Action Against Hunger). Almost all informants noted no change in interaction of local authori- ties and IDPs in the settlement Every third informant observed new IDP households coming to the settle- ment within the last month. Most of them came to the first area (closest in distance) from the NGCA of Donetsk and Luhansk oblasts (Please see the annex for distribution of areas by dis- tance from the NGCA). On average, each of these settlements received about 33 new IDP households. Almost half of the informants re- ported IDP households leaving the settlements. Most of them also left the settlements of the first area. On average, 13 IDP households left each of these settlements. IDP households who were leaving the settlements with key informants mainly moved to another oblast of the country (stated by 2/5 infor- mants) and the NGCA of Donetsk and Luhansk oblasts (stated by quarter of informants). More than one-third of the informants are not aware about the direction of movements of IDP households. IDP households who were leaving the second and fourth areas mainly moved to other oblasts of the country. IDP households, who returned to NGCA of Donetsk and Luhansk oblasts as stated by key informants, mainly moved there from the first and third areas. The majority of key informants believe that IDPs’ access to differ- ent spheres of life has not changed. One-fifth of the key informants state that access to social services became more complicated for IDPs. Every eighth key informant stated that the situation with employment and hous- ing is worsening for IDPs. Improved IDP access to any particular sphere was almost never reported. The key informants mostly note no change in the degree of IDP integra- tion in the local communities. Im- proved IDP integration was indicated by one-eighth of the experts, while the deterioration of IDP integration process was noted by one-tenth of them. Most informants did not observe a change in factors that contribute to IDP integration in the local com- munity. Only one-tenth (1/10) of the informants confirmed the relevant changes and explained that they are rooted in the increased promotion of employment opportunities, medical and psychological care, social protec- tion and support of the local com- munity.
- 18. The views expressed in this publication do not necessarily reflect the views of the European Commission. This project is funded by the European Union This project is implemented by IOMThe project is funded by the European Union The project is implemented by IOM This publication has been produced with the assistance of the European Union. The content of this publication can in no way be taken to reflect the views of the EU.18 ANNEX 1 Donetsk oblast (GCA) Luhansk oblast (GCA) Dnipropetrovsk oblast Kharkiv oblast Zaporizhia oblast 2 Cherkasy oblast Kherson oblast Kirovohrad oblast Mykolaiv oblast Poltava oblast Sumy oblast 3 Chernihiv oblast Kyiv city Kyiv oblast Odesa oblast Vinnitsa oblast Zhytomyr oblast 4 Chernivtsi oblast Ivano-Frankivsk oblast Khmelnytsky oblast Lviv oblast Rivne oblast Ternopil oblast Volyn oblast Zakarpattya oblast Grouping of oblasts into areas for pro- cessing of key informants findings by distance from the NGCA of Donetsk and Luhansk oblasts Table 1. The most relevant problems for residents of the localities by areas, % Total Area 1 2 3 4 High prices Highly relevant 58.9 61.6 35.0 62.5 60.0 Relevant 35.5 34.1 56.7 29.2 33.8 Hardly relevant 2.0 1.6 1.7 0.0 6.3 Not relevant 0.7 0.5 3.3 0.0 0.0 No response 3.0 2.2 3.3 8.3 0.0 Low wages Highly relevant 67.1 67.2 56.7 63.5 78.8 Relevant 28.6 29.8 38.3 25.0 20.0 Hardly relevant 1.2 0.8 3.3 2.1 0.0 Not relevant 0.5 0.3 1.7 1.0 0.0 No response 2.6 1.9 0.0 8.3 1.3 Poor state of infrastruc- ture Highly relevant 19.4 23.4 11.7 16.7 10.0 Relevant 30.3 33.9 30.0 18.8 27.5 Hardly relevant 28.3 25.0 33.3 33.3 33.8 Not relevant 15.8 13.4 21.7 14.6 23.8 No response 6.3 4.3 3.3 16.7 5.0 Unemployment Highly relevant 54.8 61.6 46.7 45.8 40.0 Relevant 33.6 31.7 41.7 29.2 41.3 Hardly relevant 6.9 2.4 8.3 18.8 12.5 Not relevant 2.5 2.2 3.3 2.1 3.8 No response 2.3 2.2 0.0 4.2 2.5 Lack of housing for rent Highly relevant 24.5 24.2 21.7 29.2 22.5 Relevant 35.9 41.1 31.7 22.9 30.0 Hardly relevant 23.2 22.0 23.3 18.8 33.8 Not relevant 8.4 5.6 20.0 9.4 11.3 No response 8.1 7.0 3.3 19.8 2.5 Difficulties in accessing health services Highly relevant 14.6 13.2 10.0 20.8 17.5 Relevant 26.0 27.7 26.7 20.8 23.8 Hardly relevant 32.6 36.6 21.7 25.0 31.3 Not relevant 20.7 18.8 38.3 12.5 26.3 No response 6.1 3.8 3.3 20.8 1.3
- 19. The views expressed in this publication do not necessarily reflect the views of the European Commission. This project is funded by the European Union This project is implemented by IOMThe project is funded by the European UnionThe project is implemented by IOM This publication has been produced with the assistance of the European Union. The content of this publication can in no way be taken to reflect the views of the EU. 19 Difficulties in access to educational institutions Highly relevant 7.9 8.3 1.7 12.5 5.0 Relevant 14.1 14.2 15.0 15.6 11.3 Hardly relevant 32.4 32.8 31.7 34.4 28.8 Not relevant 39.0 40.1 48.3 16.7 53.8 No response 6.6 4.6 3.3 20.8 1.3 Difficulties in doing business Highly relevant 12.8 11.8 10.0 19.8 11.3 Relevant 28.1 30.4 26.7 20.8 27.5 Hardly relevant 25.8 26.6 33.3 18.8 25.0 Not relevant 16.0 12.4 21.7 16.7 27.5 No response 17.3 18.8 8.3 24.0 8.8 Safety issues Highly relevant 9.9 11.6 1.7 12.5 5.0 Relevant 20.4 20.7 21.7 26.0 11.3 Hardly relevant 30.8 36.3 28.3 19.8 20.0 Not relevant 29.6 23.4 46.7 16.7 61.3 No response 9.4 8.1 1.7 25.0 2.5 Total Area 1 2 3 4 Table 1. The most relevant problems for residents of the localities by areas, % Table continued, page 2 of 2 Table 2. Support needed by IDPs, by area and ranking Total for Ukraine Area 1 2 3 4 Monetary assistance 3 1 3 2 3 Housing 1 3 2 1 1 Getting a new profession 7 7 7 9 9 Promoting employment 2 2 1 3 2 Help in starting your own business 10 10 10 10 5 Placement of children in kindergartens and schools 9 9 8 8 6 Document restoration 8 8 6 7 11 Support in interaction with local residents 11 11 11 11 8 Psychological support 4 4 4 4 4 Health care 5 6 9 6 10 Legal support 6 5 5 5 7 Other (specify please) 12 12 12 12 12 This table provides a ranking of the support needed by IDPs according to key informants in their locality where 1 denotes the support which IDPs need most, and 12 denotes the support. which IDPs require the least.
- 20. The views expressed in this publication do not necessarily reflect the views of the European Commission. This project is funded by the European Union This project is implemented by IOMThe project is funded by the European Union The project is implemented by IOM This publication has been produced with the assistance of the European Union. The content of this publication can in no way be taken to reflect the views of the EU.20 Table 3. Support needed by IDPs by area and in percentage of respondents, % Total for Ukraine Area 1 2 3 4 Monetary assistance 65.1 77.4 46.7 62.5 60.0 Housing 76.5 71.2 68.3 84.4 78.8 Getting a new profession 24.9 33.9 31.7 18.8 17.5 Promoting employment 70.0 73.9 73.3 59.4 73.8 Help in starting your own business 21.4 21.0 26.7 15.6 25.0 Placement of children in kinder- gartens and schools 23.1 22.6 28.3 25.0 20.0 Documents restoration 23.7 28.5 33.3 30.2 8.8 Support in interaction with local residents 13.5 13.7 13.3 7.3 18.8 Psychological support 43.3 51.1 43.3 43.8 33.8 Health care 34.6 35.7 27.8 32.9 16.6 Legal support 31.6 37.6 35.0 35.4 20.0 Other (specify please) 2.1 1.3 5.0 4.2 — Yes No Do not know Area Total for Ukraine 32 50 18 1 41.4 34.1 24.5 2 28.3 60.0 11.7 3 34.4 53.1 12.5 4 21.3 62.5 16.3 Table 4. Impact of IDPs on the life of the settlement, % Sufficiently integrated Partly integrated Poorly integrated Not integrated Difficult to answer No response Total 34.2 42.9 15.3 3.3 4.2 0.2 1 40.6 32.5 14.8 5.4 6.2 0.5 2 38.3 35.0 18.3 3.3 5.0 — 3 38.5 36.5 17.7 4.2 3.1 — 4 21.3 63.8 12.5 0.0 2.5 — Table 5. Degree of integration of the majority of IDPs into local communities, %
- 21. The views expressed in this publication do not necessarily reflect the views of the European Commission. This project is funded by the European Union This project is implemented by IOMThe project is funded by the European UnionThe project is implemented by IOM This publication has been produced with the assistance of the European Union. The content of this publication can in no way be taken to reflect the views of the EU. 21 Table 6. Evaluation of IDPs Access to Some Spheres, % of respondents Total Area 1 2 3 4 Employment Fully available 33.3 14.8 38.3 36.5 50.0 Available with complications 58.2 72.8 56.7 53.1 46.3 Fully unavailable 6.9 9.9 5.0 7.3 3.8 No response 1.6 2.4 0.0 3.1 0.0 Housing Fully available 25.7 16.9 33.3 29.2 30.0 Available with complications 63.2 76.1 60.0 54.2 57.5 Fully unavailable 9.9 5.4 6.7 15.6 11.3 No response 1.2 1.6 0.0 1.0 1.3 Health care Fully available 64.5 57.0 75.0 62.5 71.3 Available with complications 30.9 36.3 18.3 34.4 26.3 Fully unavailable 3.0 4.0 3.3 2.1 2.5 No response 1.5 2.7 3.3 1.0 0.0 Education Fully available 81.6 78.0 80.0 79.2 88.8 Available with complications 13.5 15.3 10.0 16.7 10.0 Fully unavailable 3.1 3.5 6.7 3.1 1.3 No response 1.7 3.2 3.3 1.0 0.0 Social Protec- tion Fully available 72.4 59.1 78.3 77.1 81.3 Available with complications 23.1 36.0 13.3 20.8 13.8 Fully unavailable 3.8 3.2 6.7 2.1 5.0 No response 0.7 1.6 1.7 0.0 — Public services Fully available 64.7 49.5 73.3 66.7 77.5 Available with complications 26.5 34.9 16.7 28.1 18.8 Fully unavailable 3.8 5.4 3.3 2.1 3.8 No response 5.0 10.2 6.7 3.1 —
- 22. The views expressed in this publication do not necessarily reflect the views of the European Commission. This project is funded by the European Union This project is implemented by IOMThe project is funded by the European Union The project is implemented by IOM This publication has been produced with the assistance of the European Union. The content of this publication can in no way be taken to reflect the views of the EU.22 Monthly assessments of situation with internally displaced persons (IDPs) in all oblasts of Ukraine are implemented within the framework of the EU-funded project ‘Comprehensive Stabilization Support to IDPs and the Affected Population in Ukraine’, implemented by the International Organization for Migration (IOM), Mission in Ukraine in partnership with the Ukrainian Center of Social Reforms. For more information please contact International Organization for Migration (IOM) Mission in Ukraine: 8 Mykhailivska Street, Kyiv, Ukraine, 01001 Tel: (044) 568-50-15 Fax: (044) 568-50-16 E-mail: iomkievcomm@iom.int Table 7. Three most important factors that contribute to the integration of IDPs, by area and ranking Total Area 1 2 3 4 Employment opportunities 1 1 1 2 1 Affordable housing 2 2 2 1 2 Education 6 6 6 7 6 Medical and psychological support 5 5 4 4 5 Community support 4 4 6 4 3 Social Protection 3 3 3 3 4 Other (specify please) 7 7 5 6 7 Table 8. Three most important factors that contribute to the integration of IDPs, % Total Area 1 2 3 4 Employment opportunities 85.3 86.0 86.5 76.3 90.6 Affordable housing 83.1 77.8 73.0 89.8 85.9 Education 8.2 10.0 10.8 3.4 9.4 Medical and psychological support 21.4 17.2 27.0 23.7 21.9 Community support 32.0 30.3 10.8 23.7 45.3 Social protection 44.2 52.5 37.8 50.8 34.4 Other (specify please) 7.3 3.6 16.2 11.9 4.7 No response 85.3 86.0 86.5 76.3 90.6 This table provides a ranking of the support needed by IDPs according to key informants in their locality where 1 denotes the most important factors that would contribute to the integra- tion of IDPs, and 12 denotes the least important factors that would contrib- ute to the integration of IDPs.