2015 Global Threat Intelligence Report
•
1 gostou•781 visualizações

An analysis of security trends in the Financial Services industry. 56% of attacks originate from IP addresses within the US but attackers could be anywhere in the world.

Recomendados
Recomendados
Mais conteúdo relacionado
Mais procurados
Mais procurados (20)
Semelhante a 2015 Global Threat Intelligence Report
Semelhante a 2015 Global Threat Intelligence Report (20)
Mais de DImension Data
Mais de DImension Data (20)
Último
Último (20)
2015 Global Threat Intelligence Report
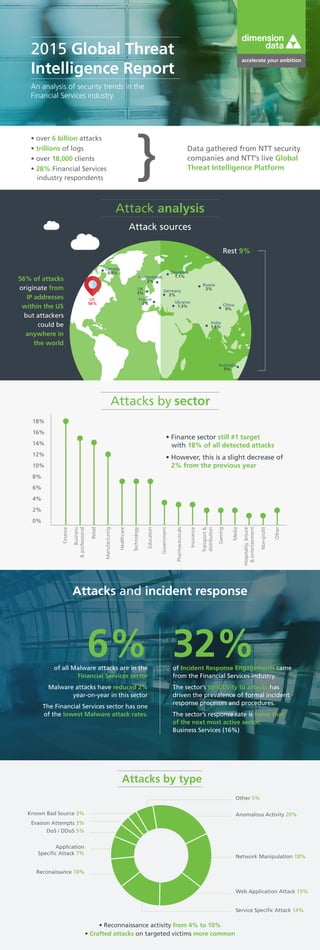
- 1. 2015 Global Threat Intelligence Report An analysis of security trends in the Financial Services industry • over 6 billion attacks • trillions of logs • over 18,000 clients • 28% Financial Services industry respondents Data gathered from NTT security companies and NTT’s live Global Threat Intelligence Platform 56% of attacks originate from IP addresses within the US but attackers could be anywhere in the world Attack analysis Attack sources US 56% China 9% France 2% India 1.5% Germany 2% Netherlands 2% Denmark 1.1% Russia 2% Ukraine 1.3% Canada 0.9% Australia 9% Rest 9% UK 3% Attacks by sector • Finance sector still #1 target with 18% of all detected attacks Finance 0% 2% 4% 8% 10% 12% 14% 16% 18% 6% Business &professional Manufacturing Retail Healthcare Technology Education Government Pharmaceuticals Insurance Transport& distribution Gaming Media Hospitality,leisure &entertainment Non-profit Other • However, this is a slight decrease of 2% from the previous year Attacks and incident response • Reconnaissance activity from 4% to 10% • Crafted attacks on targeted victims more common Other 5% Known Bad Source 3% Evasion Attempts 3% DoS / DDoS 5% Application Specific Attack 7% Reconaissance 10% Anomalous Activity 20% Network Manipulation 18% Web Application Attack 15% Service Specific Attack 14% Attacks by type 6% 32%of all Malware attacks are in the Financial Services sector Malware attacks have reduced 2% year-on-year in this sector The Financial Services sector has one of the lowest Malware attack rates. of Incident Response Engagements came from the Financial Services industry. The sector’s sensitivity to attacks has driven the prevalence of formal incident response processes and procedures. The sector’s response rate is twice that of the next most active sector, Business Services (16%)
- 2. dimensiondata.com/globalthreatreport #GlobalThreatReport Threat intelligence defined 2. Raw information collected based on requirements 3. Information processed exploited 4. Intelligence analysis production 1.Consumer needs, planning, requirements direction 5. Dissemination of product to consumer Attacks have shifted from application to user 7 / 10 vulnerabilities relate to end-user systems Users connected to public network using personal, and often more vulnerable devices End-user exploits spike after weekends / holidays when users reconnect End-user systems often have unpatched vulnerabilities • 76% of vulnerabilities + 2 years old • 9% of those +10 years old The user is the perimeter 7/10 Vulnerabilities targeted in exploit kits Cybercrime is $$ $ $$ $Software exploit kits sold in hacking forums hackers take advantage of unpatched flaws install malicious software on vulnerable devices Increased focus on Adobe Flash since security on Java and Internet Explorer improved in 2014. Java Adobe Acrobat Internet Explorer Adobe Flash Firefox Windows Silverlight Others 2013 2014 110 100 90 80 70 60 50 40 30 20 10 0 Changing profile of cybercriminals Organised crime groups with considerable resources and expertise Attacks motivated by: • profit • botnet infrastructure • extortion • fame/notoriety • hacktivism Incident response threat intelligence • Incident response capabilities maturing at a slow pace. • 74% of organisations have no formal incident response plan. Average incident response time Organisations with no vulnerability management programme take nearly 200 days to patch vulnerabilities with CVSS score of 4.0 or more The threat intelligence cycle Our approach to successful threat intelligence helps numerous enterprises stay protected