DSD-INT 2022 Salt intrusion modelling in Aveiro Lagoon under morphological and climatic changes - Pinheiro
•
2 gostaram•78 visualizações

Presentation by João Pinheiro (University of Aveiro, Portugal), at the Delft3D User Days, during Delft Software Days - Edition 2022. Monday, 14 November 2022.

Recomendados
Recomendados
Mais conteúdo relacionado
Semelhante a DSD-INT 2022 Salt intrusion modelling in Aveiro Lagoon under morphological and climatic changes - Pinheiro
Semelhante a DSD-INT 2022 Salt intrusion modelling in Aveiro Lagoon under morphological and climatic changes - Pinheiro (20)
Mais de Deltares
Mais de Deltares (20)
Último
Último (20)
DSD-INT 2022 Salt intrusion modelling in Aveiro Lagoon under morphological and climatic changes - Pinheiro
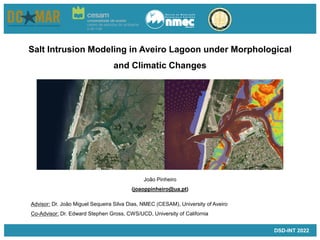
- 1. Salt Intrusion Modeling in Aveiro Lagoon under Morphological and Climatic Changes João Pinheiro (joaoppinheiro@ua.pt) Advisor: Dr. João Miguel Sequeira Silva Dias, NMEC (CESAM), University of Aveiro Co-Advisor: Dr. Edward Stephen Gross, CWS/UCD, University of California DSD-INT 2022
- 2. 1. Overview 2. Ria de Aveiro: basic classifications 3. Aveiro Lagoon 3-D Model set-up 4. Model calibration 5. Ongoing work 6. References Outline DSD-INT 2022
- 3. • It is widely known that both climate change and morphological modifications induced by direct human actions are currently affecting tidally dominated coastal environments by changing estuarine circulation patterns and enlarging tidal amplitude and salt intrusion • Particularly, saltwater intrusion increase is a critical concern because it may impacts estuarine ecology, compromising biological populations abundance, composition and distribution (Spalding et.al., 2007) • Furthermore, an upstream migration of saline fronts could also affect the estuary water quality limiting its use for human purposes, such as agriculture, industry and human supply (Rice et.al., 2012) Overview: Worldwide salinity patterns changes DSD-INT 2022
- 4. • Aveiro Lagoon has been subject to several studies concerning the impact of climate change (projected mean sea level rise and river inflow) as well as of local morphologic modifications (dredging operations) on main physical patterns and dynamics. However, none of these studies researched the local 3-D salinity structure and concern on how the salinity distribution patterns: Overview: Case study (Aveiro Lagoon) 1. depend on the physical processes 2. are being affected by morphological modifications comparing to climate change 3. will be in future as a result of dredging operations and climate scenarios SALINITY CHANGES River Inflows Human Actions Mean Sea Level Rise DSD-INT 2022
- 5. Overview: Questions • How are salinity patterns changing? • Why are they changing? • How will they change in future? • How are morphological modifications changing salinity patterns? • How are salinity patterns expected to adjust in a climate change context? • Are the saline disturbances induced by morphological modifications significant comparing with those induced by climate change? • What are the main physical mechanisms involved in salt transport? • How are these mechanisms controlling salt intrusion under a climate change context and human influence? • Are these mechanisms changing and how they will be in future? DSD-INT 2022
- 6. Overview: Methodology • To answer the questions outlined on the previous slide, a summary of the methodology used is described bellow: 1. Analyze atmospheric and oceanic data from the 6th Assessment Report of IPCC for present conditions and for future climate scenarios, assessing changes between future and present climates 2. Develop and explore empirical models to assess salt intrusion lengths 3. Develop and implement a 3D novel hydrodynamic model for Aveiro Lagoon, based on a world leading 3D modelling suite (Delft3D) 4. Generate schematic and real numerical bathymetric configurations from bathymetric and topographic data collected during different surveys 5. Calibrate and validate the 3D hydrodynamic model for tidal elevations, tidal currents and salinity DSD-INT 2022
- 7. 6. Define and simulate a set of scenarios based on: 1) projected mean sea level rise and river flow discharges in a climate change context; 2) changes in Aveiro Lagoon morphology. Further, schematic morphological configurations will be also established as a test sensitivity cases, to assess which dredging operations have higher impact on salinity patterns changes 7. Characterize the main physical mechanisms involved on salt transport under past, present and future conditions, evaluating the changes that have occurred and that are likely to occur Overview: Methodology DSD-INT 2022
- 8. Aveiro Lagoon: basic classifications ▪ Coastal lagoon with a very complex geometry • It connects with the Atlantic Ocean through a single fixed inlet • It is 45 km length and 10 km wide • Ecological relevant and local socio-economical important ▪ Shallow lagoon • Average depth of about 1 m • Average depth in the inlet channel higher than 20 m ▪ Lagoon hydrodynamic is dominated by tides • Predominantly semi-diurnal (M2) • Maximum tidal range at the inlet is 3.2 m (spring tides) and the minimum is 0.6 m (neap tides) • Mesotidal lagoon DSD-INT 2022
- 9. ▪ Freshwater sources • The average discharge of the river during a tidal cycle is 1.8 x 10⁶ m3 ➢ 76% Vouga river ➢ 13% Mira river ➢ 6 % Antuã River ➢ 3% Boco River ➢ 2% Cáster river Aveiro Lagoon: basic classifications DSD-INT 2022
- 10. ▪ Salt wedge (more pronounced at Espinheiro channel) • Vaz et. al (2008) found that during the January and December survey periods at Espinheiro channel, the regions revealed salt wedge characteristics, with the establishment of vertical stratification during the flood period. • When the river flow is low – less than 10 m3 s−1, the water column near to the red star is filled with salt water incoming from the coastal waters. • When the river flow is higher than 100m3 s−1 vertical stratification is established along all the channel. The incoming freshwater from the river extends its influence, and near the surface, the water is brackish, close to the lagoon's mouth, with salinity values of about 20 psu. Aveiro Lagoon: basic classifications DSD-INT 2022
- 11. Outubro de 2019 Model set-up: Unstructured mesh DSD-INT 2022
- 12. Outubro de 2019 Model set-up: Bed level DSD-INT 2022
- 13. Outubro de 2019 Model set-up: Settings Parameter Value Code version 1.6.3.50451 (research programme Deltares) Time step CFL (1) Vertical layers 20 equidistant/non-equidistant Z-layers (still in progress) Manning coefficient Spatial varying roughness (Lopes, 2016) Uniform hor. eddy viscosity 1 (m2 /s) Uniform hor. eddy diffusivity 1 (m2 /s) Conveyance2D -1 (bed level at velocity point is mean value of corners) Bed level type 3 (at nodes, face levels mean of node values) Advection scheme for momentum 3 Perot q(uio-u) Limiter type for momentum 4 (Monotone central) Solver type 4 (SodekGS-Saadilud) / 7 (Parallel/GS) DSD-INT 2022
- 14. Outubro de 2019 Model set-up: Model boundary conditions • Tidal boundary conditions : TPXO 9.0 Global Inverse Tide Model (last available tidal solution) The amplitude and phase of each tidal constituent are interpolated onto the boundary cells of the model. We are following a methodology described by Rayson et. al (2015) to compare observations against model results • Transport boundary conditions : IBI_ANALYSISFORECAST_PHY_005_001 (ATLANTIC-IBERIAN BISCAY IRISH-OCEAN PHYSICS ANALYSIS AND FORECAST) The salinity and temperature are interpolated onto the boundary cells of the model, as a time series and at different layers DSD-INT 2022
- 15. Outubro de 2019 • Surface conditions : ERA5 We are using ERA to get cloudiness, evapotranspiration/rainfall, 2m dewpoint temperature, 2m temperature, 10m u and v component of wind. Those variables from ERA are used to prescribe evapotranspiration/rainfall, air temperature, relative humidity, cloudiness and wind direction and magnitude. The computed quantities are prescribed at the open boundary as time series. Model set-up: Model boundary conditions DSD-INT 2022 • Freshwater inflow : Watershed model SWIM Possible source of error. There is no “real” measured flow or temperature at any station except Vouga river.
- 16. Outubro de 2019 Model calibration: Close up at lagoon mouth DSD-INT 2022
- 17. Outubro de 2019 Model calibration: Close up at lagoon mouth DSD-INT 2022
- 18. Outubro de 2019 Model calibration: Close up at Espinheiro branch DSD-INT 2022
- 19. Outubro de 2019 Model calibration: Close up at Espinheiro branch DSD-INT 2022
- 20. Outubro de 2019 Model calibration: Close up at São Jacinto branch DSD-INT 2022
- 21. Outubro de 2019 Model calibration: Close up at São Jacinto branch DSD-INT 2022
- 22. Outubro de 2019 Model calibration: Close up at Ílhavo branch DSD-INT 2022
- 23. Outubro de 2019 Model calibration: Close up at Ílhavo branch DSD-INT 2022
- 24. Outubro de 2019 Model calibration: Close up at Mira branch DSD-INT 2022
- 25. Outubro de 2019 Model calibration: Close up at Mira branch DSD-INT 2022
- 26. Outubro de 2019 Model calibration: July 2019 Station 𝑢𝑏𝑅𝑀𝑆𝐸 𝑆𝑘𝑖𝑙𝑙 𝑅2 Barra 0.09 0.9962 0.9875 Vagueira 0.10 0.9936 0.9766 Areão 0.14 0.9750 0.9406 Vista Alegre 0.11 0.9903 0.9721 Cais da Pedra 0.15 0.9772 0.9199 Rio Novo 0.12 0.9934 0.9745 Cais do Bico 0.12 0.9930 0.9750 Torreira 0.06 0.9978 0.9923 Puxadouro 0.17 0.9641 0.8854 Carregal 0.15 0.9860 0.9545 DSD-INT 2022
- 27. Outubro de 2019 Model calibration: close up at Torreira (T) station DSD-INT 2022
- 28. Outubro de 2019 Model calibration: close up at Cais do Bico (CB) station DSD-INT 2022
- 29. Outubro de 2019 Model calibration: close up at Vista Alegre (VA) station DSD-INT 2022
- 30. Outubro de 2019 Model calibration: Computational performance DSD-INT 2022 Singularity container (HPC High Performance Cluster) 20 equidistant Z-layers ARGUS (some specifications) • 20 Processing Servers with 2 CPUs of 12 cores @ 2.60GHz, 128 GB RAM and 128 GB local temporary storage • low latency network between all servers • 10 Gbit interconnection to the outside
- 31. Outubro de 2019 Ongoing work: • Complete the calibration of the 3-D hydrodynamic model for salinity • Develop simple models to assess salt intrusion lengths, from historical salinity data available at NMEC • Define and simulate scenarios to evaluate the impact of climate change and human induced modifications on salinity distribution throughout Aveiro Lagoon DSD-INT 2022
- 32. Outubro de 2019 References • Lopes, C. L., 2016. Flood Risk Assessment in Ria de Aveiro Under Present and Future Scenarios. University of Aveiro • Rayson, M. D., Gross, E. D., Fringer, O. B., 2015. Modeling the tidal and sub-tidal hydrodynamics in a shallow, micro-tidal estuary. Ocean Modelling 89, pp. 29-44 http://dx.doi.org/10.1016/j.ocemod.2015.02.002 • Rice, K. C., Hong, B., Shen, J., 2012. “Assessment of salinity intrusio n in the James and Chickahominy Rivers as a result of simulated sea-level rise in Chesapeake Bay, East Coast, USA,” J. Environ. Manage., vol. 111, pp. 61–69 • Spalding, E. A., Hester, M. W., 2007. “Interactive effects of hydrology and salinity on oligohaline plant species productivity: Implications of relative sea-level rise,” Estuaries and Coasts, vol. 30, no. 2, pp. 214–225 • Hong, B., Shen, J., 2012. “Responses of estuarine salinity and transport processes to potential future sealevel rise in the Chesapeake Bay,” Estuar. Coast. Shelf Sci., vol. 104–105, pp. 33–45 • Vargas, C. I. C., Vaz, N., Dias, J. M., 2017. “An evaluation of climate change effects in estuarine salinity patterns: Application to Ria de Aveiro shallow water system,” Estuar. Coast. Shelf Sci., vol. 189, pp. 33– 45 DSD-INT 2022
- 33. Outubro de 2019 • Vaz, N., Dias, J. M., 2008. “Hydrographic characterization of an estuarine tidal channel”, Journal of Marine Systems, vol. 70, pp. 168–181 References DSD-INT 2022