SlideShare uma empresa Scribd logo
1 de 6
STATISTICS

IMPORTANT FORMULAE AND POINTS TO REMEMBER

STATISTICS is the Art and Science of gathering, analyzing and making inferences (predictions)
from numerical information obtained in an experiment. This numerical information is referred
to as Data.

An AVERAGE is a number that is a representative of a group of data. There are atleast four
Different averages the mean, the median, the mode and the midrange.

AVERAGES are commonly referred to as Measures of Central Tendency.

    1. The Average or the arithmetic mean:
       If x1, x2, x3, ….xn are n given observations, then Arithmetic mean
                                    _
                                   (X ) = x1+x2+x3….xn (for ungrouped data)
n
    2. For grouped data: (DIRECT METHOD)

            _
       Mean X = ∑fx(where f is the frequency)
       ∑f

    3. For grouped data: (SHORT-CUT METHOD)

     _
Mean X= A+ ∑fd      where A is the Assumed mean & d= X-A
∑f

    4. Step-deviation Method:
             _
       Mean X = A + h X ∑fu
∑f
Where A = Assumed mean,
              D=X–A
h = Choose a number ‘h’ which is common factor of all ‘d’ s.
              U= X–A
                   H
5. MEDIAN:

         It is the value which divides the data into two equal parts- the middle most observation.

         The data is arranged in ascending or descending order and the middle item is the median.

         The median of raw data (ungrouped) when the number of observations n is odd, is the

(n + 1)th observation.
         2

      When the number of observations is even, then it is the average of the nth and (n+1)th
                                                                            2          2
Observation.

     6. Median for continuous frequency distribution: (grouped data)

         Median = L + (N- M) C
     2
f

where L is the lower limit of the median class
C be the width of the class interval
M be the cumulative frequency of the class just before the median class.
       F be the frequency of the median class.

    7.   MODE:

       Mode is the value of the variable in the data which occurs most frequently i.e, the mode is
That observation which has maximum frequency.

        MODE =        L + (fm – fl) x h
2 fm- f1-f2

Where L = lower limit of modal class ( class with maximum frequency)
             Fm= Frequency of the class preceding the modal class.
           f1 = Frequency of the class preceding the modal class.
f2 = Frequancy of the class succeeding the modal class.
h = width of the modal class.

    8. RANGE:

       Range is the difference between the greatest and the least of the observations.

       But there are other and better measures of dispersion called as STANDARD DEVIATION.

       Standard deviation value is based upon each and every item of the data. It is denoted by
       The greek letter  (sigma)

    9. STANDARD DEVIATION FOR AN UNGROUPED DATA:
1. Standard deviation


              _ _
Where d = X - X &X is the mean


      2. Standard deviation        


Where d = X – A where A is the assumed mean.

    10. STANDARD DEVIATION FOR DISCRETE SERIES:

      1. When deviations are taken from Arithmetic mean.


Where d = X –X and X is the mean

      2.     When deviations are taken from assumed mean


Where d= X-A, A being assumed mean.

    11. VARIANCE:

           The mean of the squares of the deviations of the values of the variable is called
           Variance
Variance       and it is denoted by ∑2


        Variance is the square of the standard deviation, The positive square root of the
        Variance is defined as standard deviation.


         S.D. of the first ‘n’ natural number is


NOTE:

           The standard deviation of a series remains unchanged when each value is
            Added or subtracted by the same quantity.

           The standard deviation of a series gets multiplied or divided by the
            Quantity K if each value is multipled (or) divided by K.


            PROBABILITY

            The word probability and chance are quite familiar to every one.

            In order to think about and measure uncertainity, we turn to a branch of
            Mathematics called “ PROBABILITY”.

         RANDOM EXPERIMENT:
          Any experiment whose outcomes cannot be predicted in advance or
          Determine in advance is a rancom experiment.

         TRIAL:
          Each performance of the random experiment is called a trial.

         SAMPLE SPACE:
          The set of all possible outcomes of a random experiment is called a sample
          Space denoted by S.

         SAMPLE POINT:
          Each element of the sample space is called a sample point.

         EVENT:
          An event is a subset of a sample space.
 EQUALLY LIKELY EVENTS:
         Two or more events are said to be equally likely if each one of them has an
         Equal chance of occurring.
         (In tossing a coin, getting a head and getting a tail are equally likely events)
        MUTUALLY EXCLUSIVE EVENTS:
         Two events A & B are said to be mutually exclusive events if the occurrence of any one
         Of them excludes the occurrence of the other even. i.e, they cannot occur
         Simultaneously.

        FAVOURABLE EVENTS OR CASES:
         The number of outcomes or cases which entail the occurrence of the event
         In an experiment are called favourable events or favourable cases.

        PROBABILITY:
         If A is the favourable event, which is a subset of the sample space S of the
         Experiment, then the probability of A denoted by P(A) is defined by,


                              P(A) = n(A)
                              n(S)

          Where n (A), n (S) are the cardinal number of Sets A and S provided the
          Members of the Set S are equally likely.

          NOTE:
          1.   O ≤ P (A) ≤ 1
          2. P (A') = 1- P (A)
             Therefore P(A) + P(A') = 1
          3. If P(A) = 0, then A is an impossible event. i.e, Probability of an impossible
             Event is 0i.e, p (Ø) = 0
          4. Probability of the sure event is 1.
             i.e, P (S) = 1 , S is called Sure event.

ADDITION THEOREM ON PROBABILITY:

          1.   If A and B are any two events, then
                              P (AUB) = P (A) + P (B) - P (AΩB)

          2. If A and B are mutually exclusive events, then
                              P (AÙB) = P (A) + P (B)

================================================================
S t a t i s t i c s

Mais conteúdo relacionado

Mais procurados

Probability distribution
Probability distributionProbability distribution
Probability distributionRohit kumar
 
Chapter 4 part2- Random Variables
Chapter 4 part2- Random VariablesChapter 4 part2- Random Variables
Chapter 4 part2- Random Variablesnszakir
 
Probability 4.1
Probability 4.1Probability 4.1
Probability 4.1herbison
 
RSS Hypothessis testing
RSS Hypothessis testingRSS Hypothessis testing
RSS Hypothessis testingKaimrc_Rss_Jd
 
kinds of distribution
 kinds of distribution kinds of distribution
kinds of distributionUnsa Shakir
 
Statistics and probability pp
Statistics and  probability ppStatistics and  probability pp
Statistics and probability ppRuby Vidal
 
Discrete probability distribution (complete)
Discrete probability distribution (complete)Discrete probability distribution (complete)
Discrete probability distribution (complete)ISYousafzai
 
RSS probability theory
RSS probability theoryRSS probability theory
RSS probability theoryKaimrc_Rss_Jd
 
CABT SHS Statistics & Probability - Expected Value and Variance of Discrete P...
CABT SHS Statistics & Probability - Expected Value and Variance of Discrete P...CABT SHS Statistics & Probability - Expected Value and Variance of Discrete P...
CABT SHS Statistics & Probability - Expected Value and Variance of Discrete P...Gilbert Joseph Abueg
 
Mean, variance, and standard deviation of a Discrete Random Variable
Mean, variance, and standard deviation of a Discrete Random VariableMean, variance, and standard deviation of a Discrete Random Variable
Mean, variance, and standard deviation of a Discrete Random VariableMichael Ogoy
 
Discrete Probability Distributions
Discrete Probability DistributionsDiscrete Probability Distributions
Discrete Probability Distributionsmandalina landy
 
Probability Distributions for Discrete Variables
Probability Distributions for Discrete VariablesProbability Distributions for Discrete Variables
Probability Distributions for Discrete Variablesgetyourcheaton
 
Chapter 2 discrete_random_variable_2009
Chapter 2 discrete_random_variable_2009Chapter 2 discrete_random_variable_2009
Chapter 2 discrete_random_variable_2009ayimsevenfold
 
Chapter 4 part3- Means and Variances of Random Variables
Chapter 4 part3- Means and Variances of Random VariablesChapter 4 part3- Means and Variances of Random Variables
Chapter 4 part3- Means and Variances of Random Variablesnszakir
 

Mais procurados (20)

Probability distribution
Probability distributionProbability distribution
Probability distribution
 
Chapter 4 part2- Random Variables
Chapter 4 part2- Random VariablesChapter 4 part2- Random Variables
Chapter 4 part2- Random Variables
 
Statistical Methods
Statistical MethodsStatistical Methods
Statistical Methods
 
Probability 4.1
Probability 4.1Probability 4.1
Probability 4.1
 
Sampling Distributions
Sampling DistributionsSampling Distributions
Sampling Distributions
 
RSS Hypothessis testing
RSS Hypothessis testingRSS Hypothessis testing
RSS Hypothessis testing
 
Probability distributions
Probability distributions  Probability distributions
Probability distributions
 
kinds of distribution
 kinds of distribution kinds of distribution
kinds of distribution
 
Statistics and probability pp
Statistics and  probability ppStatistics and  probability pp
Statistics and probability pp
 
Discrete probability distribution (complete)
Discrete probability distribution (complete)Discrete probability distribution (complete)
Discrete probability distribution (complete)
 
RSS probability theory
RSS probability theoryRSS probability theory
RSS probability theory
 
CABT SHS Statistics & Probability - Expected Value and Variance of Discrete P...
CABT SHS Statistics & Probability - Expected Value and Variance of Discrete P...CABT SHS Statistics & Probability - Expected Value and Variance of Discrete P...
CABT SHS Statistics & Probability - Expected Value and Variance of Discrete P...
 
Inorganic CHEMISTRY
Inorganic CHEMISTRYInorganic CHEMISTRY
Inorganic CHEMISTRY
 
Mean, variance, and standard deviation of a Discrete Random Variable
Mean, variance, and standard deviation of a Discrete Random VariableMean, variance, and standard deviation of a Discrete Random Variable
Mean, variance, and standard deviation of a Discrete Random Variable
 
Chapter 12
Chapter 12Chapter 12
Chapter 12
 
Discrete Probability Distributions
Discrete Probability DistributionsDiscrete Probability Distributions
Discrete Probability Distributions
 
Probability Distributions for Discrete Variables
Probability Distributions for Discrete VariablesProbability Distributions for Discrete Variables
Probability Distributions for Discrete Variables
 
Chapter 5 and Chapter 6
Chapter 5 and Chapter 6 Chapter 5 and Chapter 6
Chapter 5 and Chapter 6
 
Chapter 2 discrete_random_variable_2009
Chapter 2 discrete_random_variable_2009Chapter 2 discrete_random_variable_2009
Chapter 2 discrete_random_variable_2009
 
Chapter 4 part3- Means and Variances of Random Variables
Chapter 4 part3- Means and Variances of Random VariablesChapter 4 part3- Means and Variances of Random Variables
Chapter 4 part3- Means and Variances of Random Variables
 

Semelhante a S t a t i s t i c s

Econometrics 2.pptx
Econometrics 2.pptxEconometrics 2.pptx
Econometrics 2.pptxfuad80
 
Biostatistics
BiostatisticsBiostatistics
Biostatisticspriyarokz
 
Point Estimate, Confidence Interval, Hypotesis tests
Point Estimate, Confidence Interval, Hypotesis testsPoint Estimate, Confidence Interval, Hypotesis tests
Point Estimate, Confidence Interval, Hypotesis testsUniversity of Salerno
 
Introduction to Statistics and Probability
Introduction to Statistics and ProbabilityIntroduction to Statistics and Probability
Introduction to Statistics and ProbabilityBhavana Singh
 
C2 st lecture 10 basic statistics and the z test handout
C2 st lecture 10   basic statistics and the z test handoutC2 st lecture 10   basic statistics and the z test handout
C2 st lecture 10 basic statistics and the z test handoutfatima d
 
Descriptive Statistics Formula Sheet Sample Populatio.docx
Descriptive Statistics Formula Sheet    Sample Populatio.docxDescriptive Statistics Formula Sheet    Sample Populatio.docx
Descriptive Statistics Formula Sheet Sample Populatio.docxsimonithomas47935
 
Lect w2 measures_of_location_and_spread
Lect w2 measures_of_location_and_spreadLect w2 measures_of_location_and_spread
Lect w2 measures_of_location_and_spreadRione Drevale
 
random variation 9473 by jaideep.ppt
random variation 9473 by jaideep.pptrandom variation 9473 by jaideep.ppt
random variation 9473 by jaideep.pptBhartiYadav316049
 
2 Review of Statistics. 2 Review of Statistics.
2 Review of Statistics. 2 Review of Statistics.2 Review of Statistics. 2 Review of Statistics.
2 Review of Statistics. 2 Review of Statistics.WeihanKhor2
 
Appendix 2 Probability And Statistics
Appendix 2  Probability And StatisticsAppendix 2  Probability And Statistics
Appendix 2 Probability And StatisticsSarah Morrow
 
AP Statistic and Probability 6.1 (1).ppt
AP Statistic and Probability 6.1 (1).pptAP Statistic and Probability 6.1 (1).ppt
AP Statistic and Probability 6.1 (1).pptAlfredNavea1
 
CHAPTER I- Part 1.pptx
CHAPTER I- Part 1.pptxCHAPTER I- Part 1.pptx
CHAPTER I- Part 1.pptxJaysonMagalong
 
Small Sampling Theory Presentation1
Small Sampling Theory Presentation1Small Sampling Theory Presentation1
Small Sampling Theory Presentation1jravish
 
Artificial intelligence
Artificial intelligenceArtificial intelligence
Artificial intelligencekeerthikaA8
 
Artificial intelligence.pptx
Artificial intelligence.pptxArtificial intelligence.pptx
Artificial intelligence.pptxkeerthikaA8
 

Semelhante a S t a t i s t i c s (20)

Talk 3
Talk 3Talk 3
Talk 3
 
Econometrics 2.pptx
Econometrics 2.pptxEconometrics 2.pptx
Econometrics 2.pptx
 
Basics of Statistics
Basics of StatisticsBasics of Statistics
Basics of Statistics
 
Biostatistics
BiostatisticsBiostatistics
Biostatistics
 
Point Estimate, Confidence Interval, Hypotesis tests
Point Estimate, Confidence Interval, Hypotesis testsPoint Estimate, Confidence Interval, Hypotesis tests
Point Estimate, Confidence Interval, Hypotesis tests
 
Introduction to Statistics and Probability
Introduction to Statistics and ProbabilityIntroduction to Statistics and Probability
Introduction to Statistics and Probability
 
C2 st lecture 10 basic statistics and the z test handout
C2 st lecture 10   basic statistics and the z test handoutC2 st lecture 10   basic statistics and the z test handout
C2 st lecture 10 basic statistics and the z test handout
 
Descriptive Statistics Formula Sheet Sample Populatio.docx
Descriptive Statistics Formula Sheet    Sample Populatio.docxDescriptive Statistics Formula Sheet    Sample Populatio.docx
Descriptive Statistics Formula Sheet Sample Populatio.docx
 
U unit8 ksb
U unit8 ksbU unit8 ksb
U unit8 ksb
 
Lect w2 measures_of_location_and_spread
Lect w2 measures_of_location_and_spreadLect w2 measures_of_location_and_spread
Lect w2 measures_of_location_and_spread
 
Probability
ProbabilityProbability
Probability
 
random variation 9473 by jaideep.ppt
random variation 9473 by jaideep.pptrandom variation 9473 by jaideep.ppt
random variation 9473 by jaideep.ppt
 
2 Review of Statistics. 2 Review of Statistics.
2 Review of Statistics. 2 Review of Statistics.2 Review of Statistics. 2 Review of Statistics.
2 Review of Statistics. 2 Review of Statistics.
 
Appendix 2 Probability And Statistics
Appendix 2  Probability And StatisticsAppendix 2  Probability And Statistics
Appendix 2 Probability And Statistics
 
AP Statistic and Probability 6.1 (1).ppt
AP Statistic and Probability 6.1 (1).pptAP Statistic and Probability 6.1 (1).ppt
AP Statistic and Probability 6.1 (1).ppt
 
Probability
ProbabilityProbability
Probability
 
CHAPTER I- Part 1.pptx
CHAPTER I- Part 1.pptxCHAPTER I- Part 1.pptx
CHAPTER I- Part 1.pptx
 
Small Sampling Theory Presentation1
Small Sampling Theory Presentation1Small Sampling Theory Presentation1
Small Sampling Theory Presentation1
 
Artificial intelligence
Artificial intelligenceArtificial intelligence
Artificial intelligence
 
Artificial intelligence.pptx
Artificial intelligence.pptxArtificial intelligence.pptx
Artificial intelligence.pptx
 

Último

2024-NATIONAL-LEARNING-CAMP-AND-OTHER.pptx
2024-NATIONAL-LEARNING-CAMP-AND-OTHER.pptx2024-NATIONAL-LEARNING-CAMP-AND-OTHER.pptx
2024-NATIONAL-LEARNING-CAMP-AND-OTHER.pptxMaritesTamaniVerdade
 
Unit-IV- Pharma. Marketing Channels.pptx
Unit-IV- Pharma. Marketing Channels.pptxUnit-IV- Pharma. Marketing Channels.pptx
Unit-IV- Pharma. Marketing Channels.pptxVishalSingh1417
 
Food Chain and Food Web (Ecosystem) EVS, B. Pharmacy 1st Year, Sem-II
Food Chain and Food Web (Ecosystem) EVS, B. Pharmacy 1st Year, Sem-IIFood Chain and Food Web (Ecosystem) EVS, B. Pharmacy 1st Year, Sem-II
Food Chain and Food Web (Ecosystem) EVS, B. Pharmacy 1st Year, Sem-IIShubhangi Sonawane
 
Energy Resources. ( B. Pharmacy, 1st Year, Sem-II) Natural Resources
Energy Resources. ( B. Pharmacy, 1st Year, Sem-II) Natural ResourcesEnergy Resources. ( B. Pharmacy, 1st Year, Sem-II) Natural Resources
Energy Resources. ( B. Pharmacy, 1st Year, Sem-II) Natural ResourcesShubhangi Sonawane
 
ICT role in 21st century education and it's challenges.
ICT role in 21st century education and it's challenges.ICT role in 21st century education and it's challenges.
ICT role in 21st century education and it's challenges.MaryamAhmad92
 
Activity 01 - Artificial Culture (1).pdf
Activity 01 - Artificial Culture (1).pdfActivity 01 - Artificial Culture (1).pdf
Activity 01 - Artificial Culture (1).pdfciinovamais
 
Unit-IV; Professional Sales Representative (PSR).pptx
Unit-IV; Professional Sales Representative (PSR).pptxUnit-IV; Professional Sales Representative (PSR).pptx
Unit-IV; Professional Sales Representative (PSR).pptxVishalSingh1417
 
Introduction to Nonprofit Accounting: The Basics
Introduction to Nonprofit Accounting: The BasicsIntroduction to Nonprofit Accounting: The Basics
Introduction to Nonprofit Accounting: The BasicsTechSoup
 
Unit-V; Pricing (Pharma Marketing Management).pptx
Unit-V; Pricing (Pharma Marketing Management).pptxUnit-V; Pricing (Pharma Marketing Management).pptx
Unit-V; Pricing (Pharma Marketing Management).pptxVishalSingh1417
 
Z Score,T Score, Percential Rank and Box Plot Graph
Z Score,T Score, Percential Rank and Box Plot GraphZ Score,T Score, Percential Rank and Box Plot Graph
Z Score,T Score, Percential Rank and Box Plot GraphThiyagu K
 
Application orientated numerical on hev.ppt
Application orientated numerical on hev.pptApplication orientated numerical on hev.ppt
Application orientated numerical on hev.pptRamjanShidvankar
 
ComPTIA Overview | Comptia Security+ Book SY0-701
ComPTIA Overview | Comptia Security+ Book SY0-701ComPTIA Overview | Comptia Security+ Book SY0-701
ComPTIA Overview | Comptia Security+ Book SY0-701bronxfugly43
 
Web & Social Media Analytics Previous Year Question Paper.pdf
Web & Social Media Analytics Previous Year Question Paper.pdfWeb & Social Media Analytics Previous Year Question Paper.pdf
Web & Social Media Analytics Previous Year Question Paper.pdfJayanti Pande
 
1029-Danh muc Sach Giao Khoa khoi 6.pdf
1029-Danh muc Sach Giao Khoa khoi  6.pdf1029-Danh muc Sach Giao Khoa khoi  6.pdf
1029-Danh muc Sach Giao Khoa khoi 6.pdfQucHHunhnh
 
Beyond the EU: DORA and NIS 2 Directive's Global Impact
Beyond the EU: DORA and NIS 2 Directive's Global ImpactBeyond the EU: DORA and NIS 2 Directive's Global Impact
Beyond the EU: DORA and NIS 2 Directive's Global ImpactPECB
 
Sociology 101 Demonstration of Learning Exhibit
Sociology 101 Demonstration of Learning ExhibitSociology 101 Demonstration of Learning Exhibit
Sociology 101 Demonstration of Learning Exhibitjbellavia9
 
Ecological Succession. ( ECOSYSTEM, B. Pharmacy, 1st Year, Sem-II, Environmen...
Ecological Succession. ( ECOSYSTEM, B. Pharmacy, 1st Year, Sem-II, Environmen...Ecological Succession. ( ECOSYSTEM, B. Pharmacy, 1st Year, Sem-II, Environmen...
Ecological Succession. ( ECOSYSTEM, B. Pharmacy, 1st Year, Sem-II, Environmen...Shubhangi Sonawane
 
Basic Civil Engineering first year Notes- Chapter 4 Building.pptx
Basic Civil Engineering first year Notes- Chapter 4 Building.pptxBasic Civil Engineering first year Notes- Chapter 4 Building.pptx
Basic Civil Engineering first year Notes- Chapter 4 Building.pptxDenish Jangid
 
The basics of sentences session 2pptx copy.pptx
The basics of sentences session 2pptx copy.pptxThe basics of sentences session 2pptx copy.pptx
The basics of sentences session 2pptx copy.pptxheathfieldcps1
 

Último (20)

2024-NATIONAL-LEARNING-CAMP-AND-OTHER.pptx
2024-NATIONAL-LEARNING-CAMP-AND-OTHER.pptx2024-NATIONAL-LEARNING-CAMP-AND-OTHER.pptx
2024-NATIONAL-LEARNING-CAMP-AND-OTHER.pptx
 
Unit-IV- Pharma. Marketing Channels.pptx
Unit-IV- Pharma. Marketing Channels.pptxUnit-IV- Pharma. Marketing Channels.pptx
Unit-IV- Pharma. Marketing Channels.pptx
 
Food Chain and Food Web (Ecosystem) EVS, B. Pharmacy 1st Year, Sem-II
Food Chain and Food Web (Ecosystem) EVS, B. Pharmacy 1st Year, Sem-IIFood Chain and Food Web (Ecosystem) EVS, B. Pharmacy 1st Year, Sem-II
Food Chain and Food Web (Ecosystem) EVS, B. Pharmacy 1st Year, Sem-II
 
Energy Resources. ( B. Pharmacy, 1st Year, Sem-II) Natural Resources
Energy Resources. ( B. Pharmacy, 1st Year, Sem-II) Natural ResourcesEnergy Resources. ( B. Pharmacy, 1st Year, Sem-II) Natural Resources
Energy Resources. ( B. Pharmacy, 1st Year, Sem-II) Natural Resources
 
ICT role in 21st century education and it's challenges.
ICT role in 21st century education and it's challenges.ICT role in 21st century education and it's challenges.
ICT role in 21st century education and it's challenges.
 
Asian American Pacific Islander Month DDSD 2024.pptx
Asian American Pacific Islander Month DDSD 2024.pptxAsian American Pacific Islander Month DDSD 2024.pptx
Asian American Pacific Islander Month DDSD 2024.pptx
 
Activity 01 - Artificial Culture (1).pdf
Activity 01 - Artificial Culture (1).pdfActivity 01 - Artificial Culture (1).pdf
Activity 01 - Artificial Culture (1).pdf
 
Unit-IV; Professional Sales Representative (PSR).pptx
Unit-IV; Professional Sales Representative (PSR).pptxUnit-IV; Professional Sales Representative (PSR).pptx
Unit-IV; Professional Sales Representative (PSR).pptx
 
Introduction to Nonprofit Accounting: The Basics
Introduction to Nonprofit Accounting: The BasicsIntroduction to Nonprofit Accounting: The Basics
Introduction to Nonprofit Accounting: The Basics
 
Unit-V; Pricing (Pharma Marketing Management).pptx
Unit-V; Pricing (Pharma Marketing Management).pptxUnit-V; Pricing (Pharma Marketing Management).pptx
Unit-V; Pricing (Pharma Marketing Management).pptx
 
Z Score,T Score, Percential Rank and Box Plot Graph
Z Score,T Score, Percential Rank and Box Plot GraphZ Score,T Score, Percential Rank and Box Plot Graph
Z Score,T Score, Percential Rank and Box Plot Graph
 
Application orientated numerical on hev.ppt
Application orientated numerical on hev.pptApplication orientated numerical on hev.ppt
Application orientated numerical on hev.ppt
 
ComPTIA Overview | Comptia Security+ Book SY0-701
ComPTIA Overview | Comptia Security+ Book SY0-701ComPTIA Overview | Comptia Security+ Book SY0-701
ComPTIA Overview | Comptia Security+ Book SY0-701
 
Web & Social Media Analytics Previous Year Question Paper.pdf
Web & Social Media Analytics Previous Year Question Paper.pdfWeb & Social Media Analytics Previous Year Question Paper.pdf
Web & Social Media Analytics Previous Year Question Paper.pdf
 
1029-Danh muc Sach Giao Khoa khoi 6.pdf
1029-Danh muc Sach Giao Khoa khoi  6.pdf1029-Danh muc Sach Giao Khoa khoi  6.pdf
1029-Danh muc Sach Giao Khoa khoi 6.pdf
 
Beyond the EU: DORA and NIS 2 Directive's Global Impact
Beyond the EU: DORA and NIS 2 Directive's Global ImpactBeyond the EU: DORA and NIS 2 Directive's Global Impact
Beyond the EU: DORA and NIS 2 Directive's Global Impact
 
Sociology 101 Demonstration of Learning Exhibit
Sociology 101 Demonstration of Learning ExhibitSociology 101 Demonstration of Learning Exhibit
Sociology 101 Demonstration of Learning Exhibit
 
Ecological Succession. ( ECOSYSTEM, B. Pharmacy, 1st Year, Sem-II, Environmen...
Ecological Succession. ( ECOSYSTEM, B. Pharmacy, 1st Year, Sem-II, Environmen...Ecological Succession. ( ECOSYSTEM, B. Pharmacy, 1st Year, Sem-II, Environmen...
Ecological Succession. ( ECOSYSTEM, B. Pharmacy, 1st Year, Sem-II, Environmen...
 
Basic Civil Engineering first year Notes- Chapter 4 Building.pptx
Basic Civil Engineering first year Notes- Chapter 4 Building.pptxBasic Civil Engineering first year Notes- Chapter 4 Building.pptx
Basic Civil Engineering first year Notes- Chapter 4 Building.pptx
 
The basics of sentences session 2pptx copy.pptx
The basics of sentences session 2pptx copy.pptxThe basics of sentences session 2pptx copy.pptx
The basics of sentences session 2pptx copy.pptx
 

S t a t i s t i c s

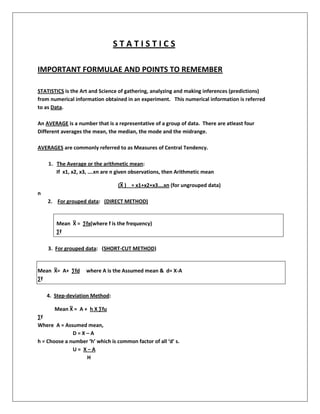
  • 1. STATISTICS IMPORTANT FORMULAE AND POINTS TO REMEMBER STATISTICS is the Art and Science of gathering, analyzing and making inferences (predictions) from numerical information obtained in an experiment. This numerical information is referred to as Data. An AVERAGE is a number that is a representative of a group of data. There are atleast four Different averages the mean, the median, the mode and the midrange. AVERAGES are commonly referred to as Measures of Central Tendency. 1. The Average or the arithmetic mean: If x1, x2, x3, ….xn are n given observations, then Arithmetic mean _ (X ) = x1+x2+x3….xn (for ungrouped data) n 2. For grouped data: (DIRECT METHOD) _ Mean X = ∑fx(where f is the frequency) ∑f 3. For grouped data: (SHORT-CUT METHOD) _ Mean X= A+ ∑fd where A is the Assumed mean & d= X-A ∑f 4. Step-deviation Method: _ Mean X = A + h X ∑fu ∑f Where A = Assumed mean, D=X–A h = Choose a number ‘h’ which is common factor of all ‘d’ s. U= X–A H
  • 2. 5. MEDIAN: It is the value which divides the data into two equal parts- the middle most observation. The data is arranged in ascending or descending order and the middle item is the median. The median of raw data (ungrouped) when the number of observations n is odd, is the (n + 1)th observation. 2 When the number of observations is even, then it is the average of the nth and (n+1)th 2 2 Observation. 6. Median for continuous frequency distribution: (grouped data) Median = L + (N- M) C 2 f where L is the lower limit of the median class C be the width of the class interval M be the cumulative frequency of the class just before the median class. F be the frequency of the median class. 7. MODE: Mode is the value of the variable in the data which occurs most frequently i.e, the mode is That observation which has maximum frequency. MODE = L + (fm – fl) x h 2 fm- f1-f2 Where L = lower limit of modal class ( class with maximum frequency) Fm= Frequency of the class preceding the modal class. f1 = Frequency of the class preceding the modal class.
  • 3. f2 = Frequancy of the class succeeding the modal class. h = width of the modal class. 8. RANGE: Range is the difference between the greatest and the least of the observations. But there are other and better measures of dispersion called as STANDARD DEVIATION. Standard deviation value is based upon each and every item of the data. It is denoted by The greek letter  (sigma) 9. STANDARD DEVIATION FOR AN UNGROUPED DATA: 1. Standard deviation _ _ Where d = X - X &X is the mean 2. Standard deviation  Where d = X – A where A is the assumed mean. 10. STANDARD DEVIATION FOR DISCRETE SERIES: 1. When deviations are taken from Arithmetic mean. Where d = X –X and X is the mean 2. When deviations are taken from assumed mean Where d= X-A, A being assumed mean. 11. VARIANCE: The mean of the squares of the deviations of the values of the variable is called Variance
  • 4. Variance and it is denoted by ∑2 Variance is the square of the standard deviation, The positive square root of the Variance is defined as standard deviation.  S.D. of the first ‘n’ natural number is NOTE:  The standard deviation of a series remains unchanged when each value is Added or subtracted by the same quantity.  The standard deviation of a series gets multiplied or divided by the Quantity K if each value is multipled (or) divided by K. PROBABILITY The word probability and chance are quite familiar to every one. In order to think about and measure uncertainity, we turn to a branch of Mathematics called “ PROBABILITY”.  RANDOM EXPERIMENT: Any experiment whose outcomes cannot be predicted in advance or Determine in advance is a rancom experiment.  TRIAL: Each performance of the random experiment is called a trial.  SAMPLE SPACE: The set of all possible outcomes of a random experiment is called a sample Space denoted by S.  SAMPLE POINT: Each element of the sample space is called a sample point.  EVENT: An event is a subset of a sample space.
  • 5.  EQUALLY LIKELY EVENTS: Two or more events are said to be equally likely if each one of them has an Equal chance of occurring. (In tossing a coin, getting a head and getting a tail are equally likely events)  MUTUALLY EXCLUSIVE EVENTS: Two events A & B are said to be mutually exclusive events if the occurrence of any one Of them excludes the occurrence of the other even. i.e, they cannot occur Simultaneously.  FAVOURABLE EVENTS OR CASES: The number of outcomes or cases which entail the occurrence of the event In an experiment are called favourable events or favourable cases.  PROBABILITY: If A is the favourable event, which is a subset of the sample space S of the Experiment, then the probability of A denoted by P(A) is defined by, P(A) = n(A) n(S) Where n (A), n (S) are the cardinal number of Sets A and S provided the Members of the Set S are equally likely. NOTE: 1. O ≤ P (A) ≤ 1 2. P (A') = 1- P (A) Therefore P(A) + P(A') = 1 3. If P(A) = 0, then A is an impossible event. i.e, Probability of an impossible Event is 0i.e, p (Ø) = 0 4. Probability of the sure event is 1. i.e, P (S) = 1 , S is called Sure event. ADDITION THEOREM ON PROBABILITY: 1. If A and B are any two events, then P (AUB) = P (A) + P (B) - P (AΩB) 2. If A and B are mutually exclusive events, then P (AÙB) = P (A) + P (B) ================================================================