Yield vs. Liquidity in Income Producing Investments
1. Yield vs. Liquidity in Income-Producing Investments
David Wrubel
D2 Advisors Inc.
February 27. 2013
For most of the last ten years there has been a tricky balancing act that financial
advisors and investment managers have tried to constantly and successfully perform:
Invest for low yield with market liquidity, or higher yield in more illiquid investments.
Others have designated this as "The Liquidity Premium Dilemma." It is a tightrope off
of which many have fallen.
High net worth investors, pension funds, charitable trusts, endowments, and family
offices live off of the income generated by their principal, income and principal which
ebbs and flows based on overall portfolio performance and market factors. Since the
majority of a typical debt portfolio’s income derives from the average yield on income
securities it holds, maintaining “performance” in the current anemic interest rate
environment has been problematic.
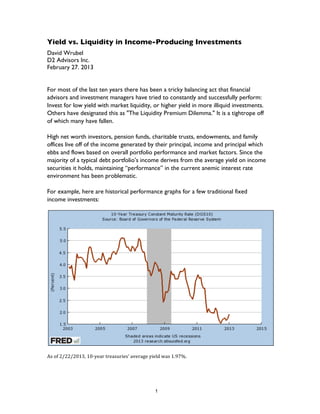
For example, here are historical performance graphs for a few traditional fixed
income investments:
As
of
2/22/2013,
10-‐year
treasuries’
average
yield
was
1.97%.
1
2.
As
of
2/25/2013,
AA
yield
was
2.05%.
As
of
2/07/2013,
Baa
Corporate
Bond
yield
was
4.73%
2
3.
Dividend
Yield,
2/25/2013:
5.97%
REIT
Exchange
Traded
Funds,
as
of
2/25/2013
Annual Annual
Dividend Divide P/E
Symbol Name Dividend Dividend Beta
Date nd Ratio
Rate Yield %
Active U.S. Real Estate
PSR $1.13 2012-12-21 $0.50 1.90% n/a 0.77
Fund
FRI S&P REIT Index Fund $0.40 2012-12-21 $0.14 2.16% n/a 0.89
FTSE NAREIT Retail Index
RTL $0.86 2012-12-19 $0.42 2.31% n/a 0.79
Fund
SCHH U.S. REIT ETF $0.77 2012-12-24 $0.26 2.39% 40.14 0.94
WREI Wilshire US REIT ETF $1.04 2012-12-24 $0.30 2.73% 40.91 0.74
FTSE NAREIT
FNIO Industrial/Office Capped $0.85 2012-12-19 $0.22 2.75% 37.69 1.09
Index Fund
Cohen & Steers Realty
ICF $2.38 2012-12-19 $0.67 2.90% n/a 0.98
Major
RWR SPDR DJ Wilshire REIT ETF $2.23 2012-12-21 $0.64 2.91% n/a 0.91
FTSE NAREIT Residential
REZ $1.50 2012-12-19 $0.38 2.93% n/a 0.85
Index Fund
FTSE EPRA/NAREIT North
IFNA $1.49 2012-12-14 $0.42 2.97% n/a 1.20
America Index Fund
FTSE NAREIT Real Estate
FTY $1.38 2012-12-19 $0.36 3.32% n/a 0.83
50 Index Fund
VNQ REIT ETF $2.34 2012-12-24 $0.80 3.37% n/a 0.94
Dow Jones U.S. Real
IYR $2.40 2012-12-19 $0.79 3.52% n/a 0.90
Estate Index Fund
IQ US Real Estate Small
ROOF $0.98 2012-12-27 $0.20 3.95% 16.46 1.08
Cap ETF
KBW Premium Yield Equity
KBWY $1.30 2013-01-15 $0.13 4.22% 22.97 0.91
REIT Portfolio
Market Vector Mortgage
MORT $2.76 2012-12-27 $0.78 9.95% n/a 1.00
REIT Income ETF
FTSE NAREIT Mortgage
REM $1.72 2012-12-19 $0.46 11.52% n/a 0.96
REITs Index Fund
Source: ETF Database – etfdb.com
3
4. This is not the place to discuss the advantages and disadvantages of these income
investments. Arguably, all have a place in a diversified, reasonably prudent income
portfolio, side by side with the entity’s allocation to stock and similar investments.
The differentiating factor is that all of the fixed income investments highlighted above
are highly liquid.
Whether such liquidity is worth the premium paid for it (in the form of lower yield
for the risk incurred) is debatable. The primary reason investors “pay” this liquidity
premium is for the ability to get out of an investment that appears to be going in the
wrong direction. Another reason is the ability to sell and take profits, but that begs
the question…”what do I do with the proceeds?”
A Risk Adjusted Alternative
Not all illiquid investments are created equally. Some have high risk/high return
characteristics; some purport to be conservative and safe. We believe a key factor in
determining how much illiquidity a portfolio can bear is the length of the
investment holding period. For example, real estate represents the classic
illiquid investment, yet some real estate investments have holding periods of seven to
ten years while others have somewhat shorter holding periods. Another key factor
we look at are risk-adjusted returns…how much risk has been squeezed out of
an investment while retaining high current returns and potential capital appreciation?
For example, in our view certain Net Lease Real Estate Funds provide outstanding
risk adjusted returns, comprised of high levels of current income and the potential
for capital appreciation. We prefer Funds that focus on investing in properties under
long term leases to investment grade corporate tenants, with built-in lease increases
and where the corporate tenant pays for all the operating expenses of the property.
The long-term leases to an investment grade tenants generate predictable, secure
cash flow, the opportunity for superior risk adjusted returns, and limit exposure to
market fluctuations.
EGM V Net Lease Strategy Overview characteristics:
A well-structured Net Lease Fund has the following
Invest in net lease assets essential to the operations of investment grade tenants
Originate sale-leasebacks at attractive pricing
EGM V
Structure build-to-suit acquisitions at below market cost
Strategy
Purchase institutional quality net lease assets at a discount
Seek to deliver predictable income and equity-like returns while taking bond-like risk
EGM V Assets with short term leases
Seeks to
Avoid Investments with below investment grade credit
4
Proven track record with some of the best returns in the industry
EGM V
Strategic Ability to creatively structure transactions and move with speed
Advantage
5. A substantial amount of risk is “squeezed out” of such investments because there is
no lease up risk, no construction risk, no operating risk, and virtually no re-leasing
risk because credit rated corporate tenants stand behind the leases of what they
consider to be mission critical facilities.
investment grade sector.
Investing in a Net Lease
Real Estate Fund where Moody's S&P Fitch
the tenants are, for
Long-term Long-term Long-term
example, Pepsico, FedX, Aaa AAA AAA Prime
ATT, and DuPont, is not Aa1 AA+ AA+
dissimilar to investing in Aa2 AA AA High grade
corporate bonds of thoseEGM
Aa3 AA- AA-
companies….except: Target
A1 A+ A+
The bonds are liquid, the A2 A A Upper medium grade
A3 A- A-
real estate is not. The
Baa1 BBB+ BBB+
bonds generate a return Baa2 BBB BBB Lower medium grade
of less than 3½% annually, Baa3 BBB- BBB-
the net lease perhaps Ba1 BB+ BB+
7½% annually.
What combination of risk and reward, liquidity and illiquidity, is good for a given
investor? Is a 3% long term bond that provides predictable current return but
variable total return that could be less than 3% (and possibly generate a negative total
return) worth the implicit liquidity? Is a Net Lease Real Estate Fund with quality
credit rated tenants that produces predictable 7%+ cash distributions with realistic
potential for upside at sale, but offers no liquidity for 3 to 6 years, worth the reduced
liquidity for some portion of an investors assets? Is the loss of 300+ basis points of
current yield too expensive of a liquidity premium for a portion of your income
producing assets?
Are you taking too much risk for too little return?
We think so.
You decide!
For more information, contact David Wrubel at davidw@d2advisors.com
5