Tax Reform: Time for Rubber to meet the road!
•
1 gostou•97 visualizações

Tax Reform: Time for Rubber to meet the road!

Recomendados
Mais conteúdo relacionado
Mais procurados
Mais procurados (19)
Semelhante a Tax Reform: Time for Rubber to meet the road!
Semelhante a Tax Reform: Time for Rubber to meet the road! (20)
Mais de David Apted
Mais de David Apted (13)
Último
Último (20)
Tax Reform: Time for Rubber to meet the road!
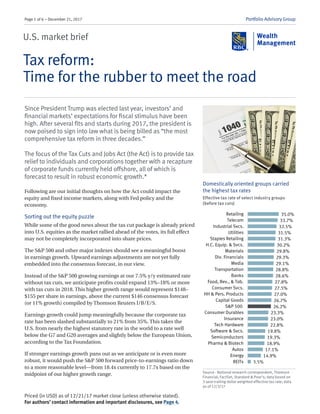
- 1. Page 1 of 6 – December 21, 2017 Portfolio Advisory Group U.S. market brief Tax reform: Time for the rubber to meet the road Since President Trump was elected last year, investors’ and financial markets’ expectations for fiscal stimulus have been high. After several fits and starts during 2017, the president is now poised to sign into law what is being billed as “the most comprehensive tax reform in three decades.” The focus of the Tax Cuts and Jobs Act (the Act) is to provide tax relief to individuals and corporations together with a recapture of corporate funds currently held offshore, all of which is forecast to result in robust economic growth.* Following are our initial thoughts on how the Act could impact the equity and fixed income markets, along with Fed policy and the economy. Sorting out the equity puzzle While some of the good news about the tax cut package is already priced into U.S. equities as the market rallied ahead of the votes, its full effect may not be completely incorporated into share prices. The S&P 500 and other major indexes should see a meaningful boost in earnings growth. Upward earnings adjustments are not yet fully embedded into the consensus forecast, in our view. Instead of the S&P 500 growing earnings at our 7.5% y/y estimated rate without tax cuts, we anticipate profits could expand 13%–18% or more with tax cuts in 2018. This higher growth range would represent $148– $155 per share in earnings, above the current $146 consensus forecast (or 11% growth) compiled by Thomson Reuters I/B/E/S. Earnings growth could jump meaningfully because the corporate tax rate has been slashed substantially to 21% from 35%. This takes the U.S. from nearly the highest statutory rate in the world to a rate well below the G7 and G20 averages and slightly below the European Union, according to the Tax Foundation. If stronger earnings growth pans out as we anticipate or is even more robust, it would push the S&P 500 forward price-to-earnings ratio down to a more reasonable level—from 18.4x currently to 17.7x based on the midpoint of our higher growth range. Priced (in USD) as of 12/21/17 market close (unless otherwise stated). For authors’ contact information and important disclosures, see Page 4. Domestically oriented groups carried the highest tax rates Effective tax rate of select industry groups (before tax cuts) Source - National research correspondent, Thomson Financial, FactSet, Standard & Poor’s; data based on 3-year trailing dollar weighted effective tax rate; data as of 12/3/17 35.0% 33.7% 32.5% 31.5% 31.3% 30.2% 29.8% 29.3% 29.1% 28.8% 28.6% 27.8% 27.5% 27.0% 26.7% 26.2% 23.3% 23.0% 22.8% 19.8% 19.3% 18.9% 17.1% 14.9% 3.5% Retailing Telecom Industrial Svcs. Utilities Staples Retailing H.C. Equip. & Svcs. Materials Div. Financials Media Transportation Banks Food, Bev., & Tob. Consumer Svcs. HH & Pers. Products Capital Goods S&P 500 Consumer Durables Insurance Tech Hardware Software & Svcs. Semiconductors Pharma & Biotech Autos Energy REITs
- 2. Page 2 of 6 U.S. market brief: Tax reform: Time for the rubber to meet the road, continued December 21, 2017 | RBC Wealth Management Industries with a large share of domestic revenues and high capital spending levels should capture the greatest incremental increases in free cash flow. Among large-cap companies, many are in retailing, telecommunications, industrials, utilities, and financials, and the list goes on (see chart on previous page). U.S.-based multinational firms that had high tax rates will be able to compete more effectively with low-taxed foreign rivals. Also, small-capitalization public companies and small private firms should see the biggest declines in tax rates as they previously paid the highest effective rates. Many companies may use the extra cash flow to initiate or increase stock buybacks, hike dividends, embark on acquisitions, and/or expand by other means—all of which could be positive for shareholders. The legislation aims to provide U.S.-based companies with additional flexibility to grow their businesses, compete globally, and prosper. “Need to Know” issues for fixed income Even before passage of the Act, 2018 was setting up to be a pivotal year for the Fed as Janet Yellen is replaced by Jerome Powell (pending Senate confirmation) and the need to fill other vacancies at the Fed. Powell is not expected to deviate from Yellen’s slow, deliberate approach, and as she noted at her final Federal Open Market Committee (FOMC) press conference, “We continue to think as you can see from the projections (of other FOMC policymakers) that a gradual path of rate increases remains appropriate even with almost all participants now factoring in their impact of the tax policy.” The Fed is forecasting three hikes in 2018, although prolonged low inflation or faster growth could alter its plans. We see the March FOMC meeting as the likely next opportunity for a rate hike. However, after that, we think sticky, low inflation, will cause the Fed to pause and ultimately raise rates just twice in 2018. The yield spike we’ve seen in recent days—10Y Treasury yields are up about 15 basis points—is somewhat reminiscent of the jump in rates after the 2016 election when markets anticipated that fiscal stimulus would result in faster growth and potentially a more aggressive Fed. Now, higher yields are a result of projections of stronger growth and Fed expectations, but also increased Treasury borrowing to fund the higher federal debt (about $1.5T) from tax reform. In our opinion, as was the case this year, the initial exuberance over tax reform will subside. The focus should then return to underlying economic fundamentals of modest growth and low inflation. In our opinion, the Fed’s 2.75% forecast for terminal Fed Funds will act as a soft cap on the 10Y Treasury keeping rates relatively close to current levels. 2018 tax rate changes Source - Congress.gov, Tax Cuts and Jobs Act Tax bracket 2017 2018 Tax bracket 2017 2018 $0‒$19,050 10% 10% $0‒$9,525 10% 10% $19,051‒$77,400 15% 12% $9,526‒$38,700 15% 12% $77,401‒$165,000 25% 22% $38,701‒$82,500 25% 22% $165,001‒$315,000 28% 24% $82,501‒$157,500 28% 24% $315,001‒$400,000 33% 32% $157,501‒$200,000 33% 32% $400,001‒$600,000 35% 35% $200,001‒$500,000 35% 35% $600,000+ 39.6% 37% $500,000+ 39.6% 37% IndividualMarried filing joint YearYear Issues for individual investors: The most visible aspects of tax reform for fixed income investors will center on revisions to individual tax rates, revisions to both the alternative minimum tax and state and local tax deductions. But, as the chart shows, the individual tax rate changes are modest and, in our view, the lower top rates shouldn’t reduce demand for municipal bonds especially as new issuance is expected to lag in 2018 due to the elimination of Advanced Refunding bonds. The lower corporate rate,
- 3. Page 3 of 6 U.S. market brief: Tax reform: Time for the rubber to meet the road, continued December 21, 2017 | RBC Wealth Management 21% vs. 35%, could reduce the issuance of corporate debt, and possibly lower demand for munis from some corporations, but in our opinion continued low rates will fuel investor demand for yield in credit and munis. The economy has been fine, even without tax reform We have been hearing about tax reform for several months, but behind the scenes the U.S. economy hasn’t been standing still. It has continued to chug along slowly, but steadily once again proving that the business cycle ultimately impacts the stock and bond markets far more than the political cycle. That being said, tax reform could very well result in stronger near-term growth. GDP has posted two consecutive quarters of 3% growth and with 2.7% forecast for Q4, GDP growth in 2017 could come in at about 2.5%. We pay close attention to several key recession indicators—yield curve, interest rates, employment, jobless claims, leading index, and manufacturing—and all are currently flashing green (showing no recession risks).To us, it is clear the U.S. economy, even before tax reform, had been on solid footing and the current expansion is poised to continue. Forecasts from our colleagues at RBC Capital Markets and RBC Global Asset Management suggest tax reform could boost growth 0.4—0.5 percentage points over the next couple of years, increasing annual GDP growth to over 3%+, which likely further pushes into the future chances of a recession. It is noteworthy to consider however that with some components of tax reform set to expire in future years, the boost to growth could be temporary. * The material contained herein is for informational purposes only and does not constitute tax advice. Given that RBC Wealth Management does not provide tax or legal advice, clients should consult with a qualified tax advisor or attorney with regard to their personal tax situation.
- 4. Page 4 of 6 U.S. market brief: Tax reform: Time for the rubber to meet the road, continued December 21, 2017 | RBC Wealth Management Authors Analyst Certification All of the views expressed in this report accurately reflect the personal views of the responsible analyst(s) about any and all of the subject securities or issuers. No part of the compensation of the responsible analyst(s) named herein is, or will be, directly or indirectly, related to the specific recommendations or views expressed by the responsible analyst(s) in this report. Important Disclosures In the U.S., RBC Wealth Management operates as a division of RBC Capital Markets, LLC. In Canada, RBC Wealth Management includes, without limitation, RBC Dominion Securities Inc., which is a foreign affiliate of RBC Capital Markets, LLC. This report has been prepared by RBC Capital Markets, LLC. which is an indirect wholly-owned subsidiary of the Royal Bank of Canada and, as such, is a related issuer of Royal Bank of Canada. Non-U.S. Analyst Disclosure: Alicia Buckiewicz, Farazeh Mahboob, and Jay Roberts, employees of RBC Wealth Management USA’s foreign affiliate RBC Dominion Securities Inc.; and Frédérique Carrier and Thomas McGarrity, employees of RBC Wealth Management USA’s foreign affiliate Royal Bank of Canada Investment Management (U.K.) Limited; contributed to the preparation of this publication. These individuals are not registered with or qualified as research analysts with the U.S. Financial Industry Regulatory Authority (“FINRA”) and, since they are not associated persons of RBC Wealth Management, they may not be subject to FINRA Rule 2241 governing communications with subject companies, the making of public appearances, and the trading of securities in accounts held by research analysts. In the event that this is a compendium report (covers six or more companies), RBC Wealth Management may choose to provide important disclosure information by reference. To access current disclosures, clients should refer to http://www.rbccm.com/ GLDisclosure/PublicWeb/DisclosureLookup.aspx?EntityID=2 to view disclosures regarding RBC Wealth Management and its affiliated firms. Such information is also available upon request to RBC Wealth Management Publishing, 60 South Sixth St, Minneapolis, MN 55402. References to a Recommended List in the recommendation history chart may include one or more recommended lists or model portfolios maintained by RBC Wealth Management or one of its affiliates. RBC Wealth Management recommended lists include Craig Bishop – Minneapolis, United States craig.bishop@rbc.com; RBCCapital Markets, LLC Kelly Bogdanov – San Francisco, United States kelly.bogdanov@rbc.com; RBCCapital Markets, LLC Alan Robinson – Seattle, United States alan.robinson@rbc.com; RBCCapital Markets, LLC D isclosures and Disclaimer the Guided Portfolio: Prime Income (RL 6), the Guided Portfolio: Dividend Growth (RL 8), the Guided Portfolio: ADR (RL 10), and the Guided Portfolio: All Cap Growth (RL 12), and former lists called the Guided Portfolio: Large Cap (RL 7), the Guided Portfolio: Midcap 111 (RL 9), and the Guided Portfolio: Global Equity (U.S.) (RL 11). RBC Capital Markets recommended lists include the Strategy Focus List and the Fundamental Equity Weightings (FEW) portfolios. The abbreviation ‘RL On’ means the date a security was placed on a Recommended List. The abbreviation ‘RL Off’ means the date a security was removed from a Recommended List. Distribution of Ratings For the purpose of ratings distributions, regulatory rules require member firms to assign ratings to one of three rating categories - Buy, Hold/Neutral, or Sell - regardless of a firm’s own rating categories. Although RBC Capital Markets, LLC ratings of Top Pick (TP)/Outperform (O), Sector Perform (SP) and Underperform (U) most closely correspond to Buy, Hold/Neutral and Sell, respectively, the meanings are not the same because our ratings are determined on a relative basis (as described below). Explanation of RBC Capital Markets, LLC Equity Rating System An analyst’s “sector” is the universe of companies for which the analyst provides research coverage. Accordingly, the rating assigned to a particular stock represents solely the analyst’s view of how that stock will perform over the next 12 months relative to the analyst’s sector average. Although RBC Capital Markets, LLC ratings of Top Pick (TP)/Outperform (O), Sector Perform (SP), and Underperform (U) most closely correspond to Buy, Hold/Neutral and Sell, respectively, the meanings are not the same because our ratings are determined on a relative basis (as described below). Ratings: Top Pick (TP): Represents analyst’s best idea in the sector; expected to provide significant absolute total return over 12 months with a favorable risk-reward ratio. Outperform (O): Expected to materially outperform sector average over 12 months. Sector Perform (SP): Returns expected to be in line with sector average over 12 months. Underperform (U): Returns expected to be materially below sector average over 12 months. Risk Rating: As of March 31, 2013, RBC Capital Markets, LLC suspends its Average and Above Average risk ratings. The Speculative risk rating reflects a security’s lower level of financial or operating predictability, illiquid share trading volumes, high balance sheet leverage, or limited operating history that result in a higher expectation of financial and/or stock price volatility. Valuation and Risks to Rating and Price Target When RBC Wealth Management assigns a value to a company in a research report, FINRA Rules and NYSE Rules (as incorporated into As of September 30, 2017 Rating Count Percent Count Percent Buy [Top Pick & Outperform] 859 52.92 294 34.23 Hold [Sector Perform] 660 40.67 154 23.33 Sell [Underperform] 104 6.41 7 6.73 Investment Banking Services Provided During Past 12 Months Distribution of Ratings - RBC Capital Markets, LLC Equity Research
- 5. Page 5 of 6 U.S. market brief: Tax reform: Time for the rubber to meet the road, continued December 21, 2017 | RBC Wealth Management the FINRA Rulebook) require that the basis for the valuation and the impediments to obtaining that valuation be described. Where applicable, this information is included in the text of our research in the sections entitled “Valuation” and “Risks to Rating and Price Target”, respectively. The analyst(s) responsible for preparing this research report received compensation that is based upon various factors, including total revenues of RBC Capital Markets, LLC, and its affiliates, a portion of which are or have been generated by investment banking activities of the member companies of RBC Capital Markets, LLC and its affiliates. Other Disclosures Prepared with the assistance of our national research sources. RBC Wealth Management prepared this report and takes sole responsibility for its content and distribution. The content may have been based, at least in part, on material provided by our third-party correspondent research services. Our third-party correspondent has given RBC Wealth Management general permission to use its research reports as source materials, but has not reviewed or approved this report, nor has it been informed of its publication. Our third-party correspondent may from time to time have long or short positions in, effect transactions in, and make markets in securities referred to herein. Our third-party correspondent may from time to time perform investment banking or other services for, or solicit investment banking or other business from, any company mentioned in this report. RBC Wealth Management endeavors to make all reasonable efforts to provide research simultaneously to all eligible clients, having regard to local time zones in overseas jurisdictions. In certain investment advisory accounts, RBC Wealth Management will act as overlay manager for our clients and will initiate transactions in the securities referenced herein for those accounts upon receipt of this report. These transactions may occur before or after your receipt of this report and may have a short-term impact on the market price of the securities in which transactions occur. RBC Wealth Management research is posted to our proprietary Web sites to ensure eligible clients receive coverage initiations and changes in rating, targets, and opinions in a timely manner. Additional distribution may be done by sales personnel via e-mail, fax, or regular mail. Clients may also receive our research via third-party vendors. Please contact your RBC Wealth Management Financial Advisor for more information regarding RBC Wealth Management research. Conflicts Disclosure: RBC Wealth Management is registered with the Securities and Exchange Commission as a broker/dealer and an investment adviser, offering both brokerage and investment advisory services. RBC Wealth Management’s Policy for Managing Conflicts of Interest in Relation to Investment Research is available from us on our Web site at http://www.rbccm.com/GLDisclosure/ PublicWeb/DisclosureLookup.aspx?EntityID=2. Conflicts of interests related to our investment advisory business can be found in Part II of the Firm’s Form ADV or the Investment Advisor Group Disclosure Document. Copies of any of these documents are available upon request through your Financial Advisor. We reserve the right to amend or supplement this policy, Part II of the ADV, or Disclosure Document at any time. The authors are employed by one of the following entities: RBC Wealth Management USA, a division of RBC Capital Markets, LLC, a securities broker-dealer with principal offices located in Minnesota and New York, USA; by RBC Dominion Securities Inc., a securities broker-dealer with principal offices located in Toronto, Canada; by RBC Investment Services (Asia) Limited, a subsidiary of RBC Dominion Securities Inc., a securities broker-dealer with principal offices located in Hong Kong, China; and by Royal Bank of Canada Investment Management (U.K.) Limited, an investment management company with principal offices located in London, United Kingdom. Research Resources This document is produced by the Global Portfolio Advisory Committee within RBC Wealth Management’s Portfolio Advisory Group. The RBC WM Portfolio Advisory Group provides support related to asset allocation and portfolio construction for the firm’s Investment Advisors / Financial Advisors who are engaged in assembling portfolios incorporating individual marketable securities. The Committee leverages the broad market outlook as developed by the RBC Investment Strategy Committee, providing additional tactical and thematic support utilizing research from the RBC Investment Strategy Committee, RBC Capital Markets, and third-party resources. Third-party disclaimers The Global Industry Classification Standard (“GICS”) was developed by and is the exclusive property and a service mark of MSCI Inc. (“MSCI”) and Standard & Poor’s Financial Services LLC (“S&P”) and is licensed for use by RBC. Neither MSCI, S&P, nor any other party involved in making or compiling the GICS or any GICS classifications makes any express or implied warranties or representations with respect to such standard or classification (or the results to be obtained by the use thereof), and all such parties hereby expressly disclaim all warranties of originality, accuracy, completeness, merchantability and fitness for a particular purpose with respect to any of such standard or classification. Without limiting any of the foregoing, in no event shall MSCI, S&P, any of their affiliates or any third party involved in making or compiling the GICS or any GICS classifications have any liability for any direct, indirect, special, punitive, consequential or any other damages (including lost profits) even if notified of the possibility of such damages. References herein to “LIBOR”, “LIBO Rate”, “L” or other LIBOR abbreviations means the London interbank offered rate as administered by ICE Benchmark Administration (or any other person that takes over the administration of such rate). Disclaimer The information contained in this report has been compiled by RBC Wealth Management, a division of RBC Capital Markets, LLC, from sources believed to be reliable, but no representation or warranty, express or implied, is made by Royal Bank of Canada, RBC Wealth Management, its affiliates or any other person as to its accuracy, completeness or correctness. All opinions and estimates contained in this report constitute RBC Wealth Management’s judgment as of the date of this report, are subject to change without notice and are provided in good faith but without legal responsibility. Past performance is not a guide to future performance, future returns are not guaranteed, and a loss of original capital may occur. Every province in Canada, state in the U.S., and most countries throughout the world have their own laws regulating the types of securities and other investment products which may be offered to their residents, as well as the process for doing so. As a result, the securities discussed in this report may not be eligible for sale in some jurisdictions. This report is not, and under no circumstances should
- 6. Page 6 of 6 U.S. market brief: Tax reform: Time for the rubber to meet the road, continued December 21, 2017 | RBC Wealth Management be construed as, a solicitation to act as securities broker or dealer in any jurisdiction by any person or company that is not legally permitted to carry on the business of a securities broker or dealer in that jurisdiction. Nothing in this report constitutes legal, accounting or tax advice or individually tailored investment advice. This material is prepared for general circulation to clients, including clients who are affiliates of Royal Bank of Canada, and does not have regard to the particular circumstances or needs of any specific person who may read it. The investments or services contained in this report may not be suitable for you and it is recommended that you consult an independent investment advisor if you are in doubt about the suitability of such investments or services. To the full extent permitted by law neither Royal Bank of Canada nor any of its affiliates, nor any other person, accepts any liability whatsoever for any direct or consequential loss arising from any use of this report or the information contained herein. No matter contained in this document may be reproduced or copied by any means without the prior consent of Royal Bank of Canada. Additional information is available upon request. The material contained herein is for informational purposes only and does not constitute tax advice. Given that RBC Wealth Management does not provide tax or legal advice, clients should consult with a qualified tax advi- sor or attorney with regard to their personal tax situation. To U.S. Residents: This publication has been approved by RBC Capital Markets, LLC, Member NYSE/FINRA/SIPC, which is a U.S. registered broker-dealer and which accepts responsibility for this report and its dissemination in the United States. RBC Capital Markets, LLC, is an indirect wholly-owned subsidiary of the Royal Bank of Canada and, as such, is a related issuer of Royal Bank of Canada. Any U.S. recipient of this report that is not a registered broker-dealer or a bank acting in a broker or dealer capacity and that wishes further information regarding, or to effect any transaction in, any of the securities discussed in this report, should contact and place orders with RBC Capital Markets, LLC. International investing involves risks not typically associated with U.S. investing, including currency fluctuation, foreign taxation, political instability and different accounting standards. To Canadian Residents: This publication has been approved by RBC Dominion Securities Inc. RBC Dominion Securities Inc.* and Royal Bank of Canada are separate corporate entities which are affiliated. *Member-Canadian Investor Protection Fund. ®Registered trademark of Royal Bank of Canada. Used under license. RBC Wealth Management is a registered trademark of Royal Bank of Canada. Used under license. RBC Wealth Management (British Isles): This publication is distributed by Royal Bank of Canada Investment Management (U.K.) Limited and RBC Investment Solutions (CI) Limited. Royal Bank of Canada Investment Management (U.K.) Limited is authorised and regulated by the Financial Conduct Authority (Reference number: 146504). Registered office: Riverbank House, 2 Swan Lane , London, EC4R 3BF, UK. RBC Investment Solutions (CI) Limited is regulated by the Jersey Financial Services Commission in the conduct of investment business in Jersey. Registered office: Gaspé House, 66- 72 Esplanade, St Helier, Jersey JE2 3QT, Channel Islands, registered company number 119162. To Hong Kong Residents: This publication is distributed in Hong Kong by Royal Bank of Canada, Hong Kong Branch which is regulated by the Hong Kong Monetary Authority and the Securities and Futures Commission (‘SFC’), and RBC Investment Services (Asia) Limited, which is regulated by the SFC. Financial Services provided to Australia: Financial services may be provided in Australia in accordance with applicable law. Financial services provided by the Royal Bank of Canada, Hong Kong Branch are provided pursuant to the Royal Bank of Canada’s Australian Financial Services Licence (‘AFSL’) (No. 246521). To Singapore Residents: This publication is distributed in Singapore by the Royal Bank of Canada, Singapore Branch, a registered entity granted offshore bank licence by the Monetary Authority of Singapore. This material has been prepared for general circulation and does not take into account the objectives, financial situation, or needs of any recipient. You are advised to seek independent advice from a financial adviser before purchasing any product. If you do not obtain independent advice, you should consider whether the product is suitable for you. Past performance is not indicative of future performance. If you have any questions related to this publication, please contact the Royal Bank of Canada, Singapore Branch. Royal Bank of Canada, Singapore Branch accepts responsibility for this report and its dissemination in Singapore. © RBC Capital Markets, LLC 2017 - Member NYSE/FINRA/SIPC © RBC Dominion Securities Inc. 2017 - Member Canadian Investor Protection Fund © RBC Europe Limited 2017 © Royal Bank of Canada 2017 All rights reserved