Tricumen 4Q17/FY17 wholesale Banking results_open 260218

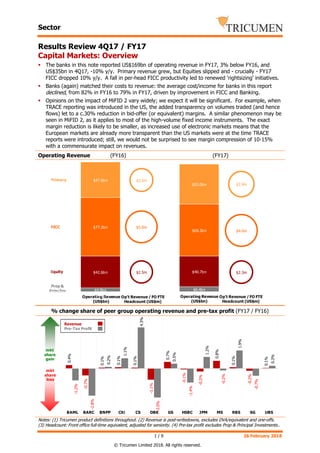
Capital Markets: Overview The banks in this note reported US$169bn of operating revenue in FY17, 3% below FY16, and US$35bn in 4Q17, -10% y/y. Primary revenue grew, but Equities slipped and - crucially - FY17 FICC dropped 10% y/y. A fall in per-head FICC productivity led to renewed 'rightsizing' initiatives. Banks (again) matched their costs to revenue: the average cost/income for banks in this report declined, from 82% in FY16 to 79% in FY17, driven by improvement in FICC and Banking. Opinions on the impact of MiFID 2 vary widely; we expect it will be significant. For example, when TRACE reporting was introduced in the US, the added transparency on volumes traded (and hence flows) let to a c.30% reduction in bid-offer (or equivalent) margins. A similar phenomenon may be seen in MiFID 2, as it applies to most of the high-volume fixed income instruments. The exact margin reduction is likely to be smaller, as increased use of electronic markets means that the European markets are already more transparent than the US markets were at the time TRACE reports were introduced; still, we would not be surprised to see margin compression of 10-15% with a commensurate impact on revenues.

Recomendados
Recomendados
Mais conteúdo relacionado
Mais procurados
Mais procurados (17)
Semelhante a Tricumen 4Q17/FY17 wholesale Banking results_open 260218
Semelhante a Tricumen 4Q17/FY17 wholesale Banking results_open 260218 (20)
Mais de Tricumen Ltd
Mais de Tricumen Ltd (20)
Último
Último (20)
Tricumen 4Q17/FY17 wholesale Banking results_open 260218
- 1. Sector 1 / 9 26 February 2018 © Tricumen Limited 2018. All rights reserved. Results Review 4Q17 / FY17 Capital Markets: Overview The banks in this note reported US$169bn of operating revenue in FY17, 3% below FY16, and US$35bn in 4Q17, -10% y/y. Primary revenue grew, but Equities slipped and - crucially - FY17 FICC dropped 10% y/y. A fall in per-head FICC productivity led to renewed 'rightsizing' initiatives. Banks (again) matched their costs to revenue: the average cost/income for banks in this report declined, from 82% in FY16 to 79% in FY17, driven by improvement in FICC and Banking. Opinions on the impact of MiFID 2 vary widely; we expect it will be significant. For example, when TRACE reporting was introduced in the US, the added transparency on volumes traded (and hence flows) let to a c.30% reduction in bid-offer (or equivalent) margins. A similar phenomenon may be seen in MiFID 2, as it applies to most of the high-volume fixed income instruments. The exact margin reduction is likely to be smaller, as increased use of electronic markets means that the European markets are already more transparent than the US markets were at the time TRACE reports were introduced; still, we would not be surprised to see margin compression of 10-15% with a commensurate impact on revenues. Operating Revenue (FY16) (FY17) % change share of peer group operating revenue and pre-tax profit (FY17 / FY16) Notes: (1) Tricumen product definitions throughout. (2) Revenue is post-writedowns, excludes DVA/equivalent and one-offs. (3) Headcount: Front office full-time equivalent, adjusted for seniority. (4) Pre-tax profit excludes Prop & Principal Investments.. $2.9m $4.6m $2.3m 0.5 1 1.5 2 2.5 3 0.8 1 1.2 $2.6m $5.0m $2.5m 0.5 1 1.5 2 2.5 3 0.8 1 1.2 FICC Equity Prop & PrincInv Primary Operating Revenue (US$bn) Op't Revenue / FO FTE Headcount (US$m) Operating Revenue (US$bn) Op't Revenue /FO FTE Headcount (US$m) $4.9bn $6.4bn $42.6bn $40.7bn $77.2bn $69.3bn $47.6bn $53.0bn 0 20 40 60 80 100 120 140 160 FY16 0.4% -0.7% 0.1% 0.1% 0.1% -1.1% 0.7% -0.1% -0.3% 0.8% 0.1% -0.2% 0.1% -1.2% -2.8% 0.2% 1.1% 4.3% -3.0% 0.5% -1.4% 1.2% -0.2% 1.9% -0.7% 0.3% -0.04 -0.03 -0.02 -0.01 0 0.01 0.02 0.03 0.04 0.05 BAML BARC BNPP Citi CS DBK GS HSBC JPM MS RBS SG UBS mkt share gain mkt share loss Revenue Pre-Tax Profit
- 2. Sector 2 / 9 26 February 2018 © Tricumen Limited 2018. All rights reserved. Capital Markets (cont.): Primary issuance & Advisory In FY17, DCM issuance fees earned by 'our' banks comfortably exceeded 2016. The key market drivers were high yield (global volumes +40% y/y), US high grade and emerging markets. A healthy y/y growth in securitisation issuance in 4Q17 - Agency CMOs and Non-Agency RMBS in particular - was more than offset by a drop in trading margins. In CLOs, the expectation of higher interest rates and tighter credit markets is driving both managers and investors to more frequent 'resetting' of CLOs. Benefits to both sides are considerable, and we expect this trend to continue. Top 13' ECM fees grew 28% y/y in FY17 and 23% in 4Q17. IPO activity was exceptionally strong throughout the year, led by the US and EMEA, and with strong contribution from APAC. APOs also posted double-digit growth rates in FY17, led by Financials, Media & Tech and Industrials. The top players' fee growth exceeded that of a wider market. Despite a slow 4Q17, M&A/Advisory held up well: in FY17, 'our' banks grew fees by 5% y/y. APAC continues to surge: 4Q17 fees were c.70% ahead of 4Q16 and more than 2x above 3Q16. The US market, however, was subdued, partially due to margin pressures which we noted in our 3Q17 report and EMEA fees were flat versus 4Q16 (though sharply down from 3Q17). Operating Revenue (FY16) (FY17) % change share of peer group operating revenue and pre-tax profit (FY17 / FY16) Notes: (1) Tricumen product definitions throughout. (2) Revenue is post-writedowns, excludes DVA/equivalent and one-offs. (3) Headcount: Front office full-time equivalent, adjusted for seniority. $3.2m $4.5m $1.7m 0.5 1 1.5 2 2.5 3 0.8 1 1.2 $3.5m $6.2m $1.8m 0.5 1 1.5 2 2.5 3 0.8 1 1.2 DCM & Securitisation ECM M&A / Advisory Operating Revenue (US$bn) Op't Revenue /FO FTE Headcount (US$m) Operating Revenue (US$bn) Op't Revenue /FO FTE Headcount (US$m) $13.3bn $13.9bn $6.7bn $8.6bn $27.6bn $30.4bn 0 10 20 30 40 50 FY16 0.3% -0.6% 0.2% -0.3% 0.4% -0.8% 0.4% 0.1% -0.3% 1.1% -0.1% -0.3% -0.1% -3.6% -2.2% 2.9% -4.0% 10.2% -2.2% 1.4% -0.8% -2.7% -1.2% 3.6% -0.5% -1.0% -0.06 -0.04 -0.02 0 0.02 0.04 0.06 0.08 0.1 0.12 BAML BARC BNPP Citi CS DBK GS HSBC JPM MS RBS SG UBS mkt share gain mkt share loss Revenue Pre-Tax Profit
- 3. Sector 3 / 9 26 February 2018 © Tricumen Limited 2018. All rights reserved. Capital Markets (cont.): FICC In 4Q17, FX revenues suffered a sharp drop versus a prior-year period. Strong volumes (especially in forwards) were offset by significant margin compression - in some cases by as much as 50%. Latin American and APAC markets fared better than North America and Western Europe. Rates trading also declined compared to 4Q16: weak US Treasuries and JGB volumes reduced client revenue opportunity by c.10% y/y. Short-end declined, too, with repo volumes 7% below 4Q16 in both the US and Europe. Swap trading grew at a healthy clip in the US and especially Europe, but margin reductions wiped out any revenue gains. Bright spots were APAC repo trading - which benefited from higher volumes and rising interest rates - and European govies. Most - though not all - banks in this report reported a y/y decline in 4Q17 credit revenues versus 4Q16 amid falling margins in the US, margins and volume compression in Europe and weak volumes in APAC. Latin America, however, saw a pick-up in activity. In commodities, energy trading declined relative to 4Q16 and, while traded volumes grew strongly in base and precious metals, this was not enough to compensate for significant margin tightening. 'Our' banks continued whittling down their operations. Operating Revenue (FY16) (FY17) % change share of peer group operating revenue and pre-tax profit: (FY17 / FY16) Notes: (1) Tricumen product definitions throughout. (2) Revenue is post-writedowns, excludes DVA/equivalent and one-offs. (3) Headcount: Front office full-time equivalent, adjusted for seniority. (4) Pre-tax profit excludes Prop & Principal Investments. $7.4m $4.2m $4.6m $5.5m 0.5 1 1.5 2 2.5 3 0.8 1 1.2 $6.6m $3.9m $4.5m $3.6m 0.5 1 1.5 2 2.5 3 0.8 1 1.2 FX Rates Credit Commodities Operating Revenue (US$bn) Op't Revenue /FO FTE Headcount (US$m) Operating Revenue (US$bn) Op't Revenue /FO FTE Headcount (US$m) $4.3bn $2.8bn $18.3bn $17.8bn $31.8bn $28.5bn $22.8bn $20.2bn 0 10 20 30 40 50 60 70 FY16 0.8% -0.7% -0.3% 1.0% 0.0% -0.8% -1.1% -0.0% -0.4% 0.6% 0.6% 0.4% -0.0% -2.0% -1.8% 1.1% 4.8% 0.8% -4.6% -3.3% -1.1% 4.4% -0.4% 1.6% 0.7% -0.0% -0.06 -0.04 -0.02 0 0.02 0.04 0.06 BAML BARC BNPP Citi CS DBK GS HSBC JPM MS RBS SG UBS mkt share gain mkt share loss Revenue Pre-Tax Profit
- 4. Sector 4 / 9 26 February 2018 © Tricumen Limited 2018. All rights reserved. Capital Markets (cont.): Equities Cash equity trading revenues were broadly unchanged from 4Q16. Strong overall growth in Japan (c.20% in hi-touch and 60% in electronic) and steady US and European electronic markets were offset by weak hi-touch US and European markets and modest shrinkage in APAC ex-Japan. On full-year basis, electronic markets comfortably outpaced hi-touch in all major regions. In 4Q17, solid US and APAC structured equity derivatives trading was more than offset by declines in Americas flow trading and European structured product issuance. Prime service revenues were slightly below 4Q16 as growth in prime brokerage fees was negated by lower securities lending. Operating Revenue (FY16) (FY17) % change share of peer group operating revenue and pre-tax profit (FY17 / FY16) Notes: (1) Tricumen product definitions throughout. (2) Revenue is post-writedowns, excludes DVA/equivalent and one-offs. (3) Headcount: Front office full-time equivalent, adjusted for seniority. (4) Pre-tax profit excludes Prop & Principal Investments. $1.6m $3.6m $2.7m 0.5 1 1.5 2 2.5 3 0.8 1 1.2 $1.6m $3.3m $2.7m 0.5 1 1.5 2 2.5 3 0.8 1 1.2 EQ Cash EQ Derv'& Converts Prime Services Operating Revenue (US$bn) Op't Revenue /FO FTE Headcount (US$m) Operating Revenue (US$bn) Op't Revenue /FO FTE Headcount (US$m) $10.4bn $10.0bn $19.4bn $18.2bn $12.8bn $12.5bn 0 5 10 15 20 25 30 35 40 FY16 0.2% -1.0% 0.8% 0.2% -0.6% -1.7% 0.5% 0.6% 0.3% 0.6% -0.3% 0.4% 3.2% -3.6% 0.5% -3.2% 1.8% -6.3% -0.3% 3.2% 5.1% -0.2% -2.8% 2.5% -0.08 -0.06 -0.04 -0.02 0 0.02 0.04 0.06 BAML BARC BNPP Citi CS DBK GS HSBC JPM MS RBS SG UBS N/A mkt share gain mkt share loss Revenue Pre-Tax Profit
- 5. Sector 5 / 9 26 February 2018 © Tricumen Limited 2018. All rights reserved. Commercial/Transaction Banking In the US, commercial lending remained steady. While rising interest rates favoured some banks, others found their financing margins unchanged relative to 4Q17. European volumes declined - slightly in continental Europe and more sharply in the UK. In general, banks saw net interest margins tightening on their existing loan portfolio, but margins on new loans were healthier. Driven by strong activity in the US and Europe, 4Q17 payments volumes grew by approximately 10% compared to prior-year period. Trade finance activity steadied, with a year-on-year decline of almost imperceptible 0.5%. Operating Revenue (FY16) (FY17) % change share of peer group operating revenue and pre-tax profit (FY17 / FY16) Notes: (1) Tricumen product definitions throughout. (2) Revenue is post-writedowns, excludes DVA/equivalent and one-offs. (3) Headcount: Front office full-time equivalent, adjusted for seniority. (4) In-scope: Large Cap/MNC and Mid-Cap/SMEs. $3.9m $1.9m 0.5 1 1.5 2 2.5 3 0.8 1 1.2 $3.9m $2.2m 0.5 1 1.5 2 2.5 3 0.8 1 1.2 Commercial Banking Treasury Services Operating Revenue (US$bn) Op't Revenue /FO FTE Headcount (US$m) Operating Revenue (US$bn) Op't Revenue /FO FTE Headcount (US$m) $35.3bn $38.2bn $44.6bn $45.8bn 0 10 20 30 40 50 60 70 80 FY16 0.3% -0.2% -0.4% -0.8% -0.5% 1.5% 1.6% 1.3% -1.7% -1.0% -1.2% 1.1% -0.02 -0.015 -0.01 -0.005 0 0.005 0.01 0.015 0.02 BAML BNPP Citi DBK HSBC JPM mkt share gain mkt share loss Revenue Pre-Tax Profit
- 6. Sector 6 / 9 26 February 2018 © Tricumen Limited 2018. All rights reserved. Wealth Management Wealth management revenues of the banks included in this report reached US$66bn in FY17, +8% y/y, with corresponding increase in productivity. Pre-tax profits jumped 16% y/y, despite a sizeable investment in front- and middle-office staff and (selective) investment in systems. MiFID 2 is likely to accelerate the shift from advisory to discretionary activities (here, we aggregate fees from both within 'investment management'). With questionable wisdom, the impractically detailed MiFID 2 stipulates that firms must show how each advice that is given meets the client's objectives and circumstances - even if a transaction was discussed with the client beforehand. A resultant increase in provider's cost may make advisory even more niche than it already is; several smaller firms we follow have already ceased marketing advisory service - even if they still offer it. Other key challenges for the industry in 2018 and beyond include: a continued shift to tech solutions/AI (including cooperation with specialist external operators), a more transparent pricing, emphasising performance over a simple share-of-AuM, especially in the UHNW segment. Operating Revenue (FY16) (FY17) % change share of peer group operating revenue and pre-tax profit (FY17 / FY16) Notes: (1) Tricumen product definitions throughout. (2) Revenue is post-writedowns, excludes DVA/equivalent and one-offs. (3) Headcount: Front office full-time equivalent, adjusted for seniority. $1.1m 0.5 1 1.5 2 2.5 3 0.8 1 1.2 $1.2m 0.5 1 1.5 2 2.5 3 0.8 1 1.2 Lending Investment Management Brokerage Operating Revenue (US$bn) Op't Revenue /FO FTE Headcount (US$m) Operating Revenue (US$bn) Op't Revenue /FO FTE Headcount (US$m) $10.2bn $10.4bn $31.3bn $33.7bn $18.5bn $20.0bn $1.9bn $2.1bn 0 10 20 30 40 50 60 FY16 Advisory -0.5% -0.2% -0.2% 0.2% 1.1% -0.4% -0% -1% 0.6% -1% 1.7% -0% -0.015 -0.01 -0.005 0 0.005 0.01 0.015 0.02 BAML CS DBK JPM MS UBS mkt share gain mkt share loss Revenue Pre-Tax Profit
- 7. Sector 7 / 9 26 February 2018 © Tricumen Limited 2018. All rights reserved. Revenue dynamics FY17 / FY16 (Operating revenue, % change, US$, Global Level 1) 4Q17 / 4Q16 (Operating revenue, % change, US$, Global Level 1) Source: Tricumen. Notes: (1) Tricumen product definitions throughout. (2) Arrows show % change in revenue vs peers. Up- /down-arrows: top-/bottom-quartile. (3) Revenue is post-writedowns, excludes DVA/equivalent and one-offs, as described in the Company Section. (4) In-scope: Large Cap/MNC and Mid-Cap/SMEs. BAML BARC BNPP Citi CS DBK GS HSBC JPM MS RBS SG UBS Top 25% Bottom25% Capital Markets +2% -4% Primary +15% +3% DCM Bonds +26% +3% DCM Loans N/M +25% +4% Securitisation +5% -18% ECM N/M +41% +6% M&A / Advisory N/M +9% -2% Sales & Trading -4% -10% FX -6% -20% Rates -1% -21% Credit +14% -10% Commodities N/M -19% -50% EQ Cash N/M +1% -6% EQ Derv & Converts N/M +1% -13% Prime Services N/M +3% -2% Prop Trading N/M N/M N/M N/M N/M N/M N/M N/M +7% -29% Principal Investments N/M N/M N/M N/M N/M N/M N/M N/M +46% -14% Commercial / Transaction Banking N/M N/M N/M N/M N/M N/M N/M +6% +3% Commercial Banking N/M N/M N/M N/M N/M N/M N/M +4% -0% Treasury Services N/M N/M N/M N/M N/M N/M N/M +10% +6% Wealth Management N/M N/M N/M N/M N/M N/M N/M +9% +6% Advisory N/M N/M N/M N/M N/M N/M N/M +10% +2% Lending N/M N/M N/M N/M N/M N/M N/M +8% +3% Investment Management N/M N/M N/M N/M N/M N/M N/M +10% +5% Brokerage N/M N/M N/M N/M N/M N/M N/M +3% -3% BAML BARC BNPP Citi CS DBK GS HSBC JPM MS RBS SG UBS Top 25% Bottom25% Capital Markets -4% -11% Primary +17% +3% DCM Bonds N/M +49% +12% DCM Loans N/M +30% -4% Securitisation +12% -13% ECM N/M +22% -15% M&A / Advisory N/M +9% -8% Sales & Trading -7% -26% FX -13% -38% Rates -1% -41% Credit +1% -27% Commodities N/M -32% -57% EQ Cash N/M +6% -11% EQ Derv & Converts N/M -5% -24% Prime Services N/M +10% -3% Prop Trading N/M N/M N/M N/M N/M N/M N/M N/M N/M N/M -10% -29% Principal Investments N/M N/M N/M N/M N/M N/M N/M N/M N/M +277% +112% Commercial / Transaction Banking N/M N/M N/M N/M N/M N/M N/M +8% +3% Commercial Banking N/M N/M N/M N/M N/M N/M N/M +7% -1% Treasury Services N/M N/M N/M N/M N/M N/M N/M +10% +5% Wealth Management N/M N/M N/M N/M N/M N/M N/M +10% +7% Advisory N/M N/M N/M N/M N/M N/M N/M +14% +6% Lending N/M N/M N/M N/M N/M N/M N/M +13% +4% Investment Management N/M N/M N/M N/M N/M N/M N/M +20% +8% Brokerage N/M N/M N/M N/M N/M N/M N/M +5% -4%
- 8. Sector 8 / 9 26 February 2018 © Tricumen Limited 2018. All rights reserved. Operating cost / income (US$, Global Level 1) Capital Markets Banking FICC Equities Source: Tricumen. Notes: (1) TRIC product definitions, standard deviation, product Level 1; (2) Operating expenses exclude one-off non-operational items, insurance-related benefits & claims, and credit expense/recovery/NPL provisions. Capital expenditure is included as accrued. Litigation expense is allocated to front-line units. (3) positive values indicate outperformance; missing fields indicate that data is not meaningful, or available; (4) outliers are excluded. (5) RBS does not compete in Equities markets. -2.0 -1.0 0.0 1.0 2.0 3.0 BAML BARC BNPP Citi CS DBK GSHSBC JPM MS RBS SG UBS FY17 Peer Gp Avg -3.0 -2.0 -1.0 0.0 1.0 2.0 BAML BARC BNPP Citi CS DBK GSHSBC JPM MS RBS SG UBS FY17 Peer Gp Avg -2.0 -1.0 0.0 1.0 2.0 BAML BARC BNPP Citi CS DBK GSHSBC JPM MS RBS SG UBS FY17 Peer Gp Avg -2.0 -1.0 0.0 1.0 2.0 BAML BARC BNPP Citi CS DBK GS HSBC JPM MS SG UBS FY17 Peer Gp Avg
- 9. Sector 9 / 9 26 February 2018 © Tricumen Limited 2018. All rights reserved. About Tricumen Tricumen was founded in 2008. It quickly became a strong provider of diversified market intelligence across the capital markets and has since expanded into transaction and corporate banking as well as asset and wealth management. Tricumen’s data has been used by many of the world’s leading investment banks as well as strategy consulting firms, investment managers and ‘blue chip’ corporations. Situated near Cambridge in the UK, Tricumen is almost exclusively staffed with senior individuals with an extensive track record of either working for or analysing banks; and boasts what we believe is the largest capital markets-focused research network of its peer group. Notes & Caveats No part of this document may be reproduced or transmitted in any form by any means without written permission of Tricumen Limited. Such consent is often given, provided that the information released is sourced to Tricumen and that it does not prejudice Tricumen Limited’s business or compromise the company’s ability to analyse the financial markets. Full acknowledgement of Tricumen Limited must be given. Tricumen Limited has used all reasonable care in writing, editing and presenting the information found in this report. All reasonable effort has been made to ensure the information supplied is accurate and not misleading. For the purposes of cross- market comparison, all numerical data is normalised in accordance to Tricumen Limited’s proprietary product classification. Fully-researched dataset may contain margin of error of 10%; for modelled datasets, this margin may be wider. The information and commentary provided in this report has been compiled for informational purposes only. We recommend that independent advice and enquiries should be sought before acting upon it. Readers should not rely on this information for legal, accounting, investment, or similar purposes. No part of this report constitutes investment advice, any form of recommendation, or a solicitation to buy or sell any instrument or to engage in any trading or investment activity or strategy. Tricumen Limited does not provide investment advice or personal recommendation nor will it be deemed to have done so. Tricumen Limited makes no representation, guarantee or warranty as to the suitability, accuracy or completeness of the report or the information therein. Tricumen Limited assumes no responsibility for information contained in this report and disclaims all liability arising from negligence or otherwise in respect of such information. Tricumen Limited is not liable for any damages arising in contract, tort or otherwise from the use of or inability to use this report or any material contained in it, or from any action or decision taken as a result of using the report. © Tricumen Limited 2018. All rights reserved