Clareo jaouiche utility
•
0 gostou•139 visualizações

Utilities today face a host of significant challenges. Among them are environmental regulations; fuel price uncertainty; and fresh capital needs for plant upgrades, baseload generation investments, and transmission investments. One of the largest disruptors, however, may be the erosion of the utility business model itself.

Recomendados
Recomendados
Mais conteúdo relacionado
Mais procurados
Mais procurados (20)
Semelhante a Clareo jaouiche utility
Semelhante a Clareo jaouiche utility (20)
Último
Último (20)
Clareo jaouiche utility
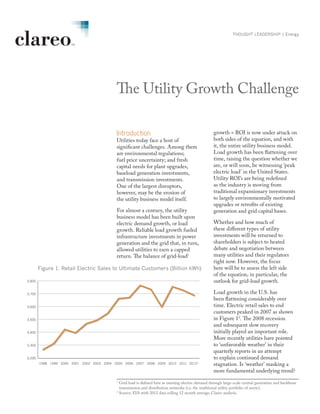
- 1. 3,200 3,300 3,400 3,500 3,600 3,700 3,800 1998 1999 2000 2001 2002 2003 2004 2005 2006 2007 2008 2009 2010 2011 2012* THOUGHT LEADERSHIP | Energy The Utility Growth Challenge Introduction Utilities today face a host of significant challenges. Among them are environmental regulations; fuel price uncertainty; and fresh capital needs for plant upgrades, baseload generation investments, and transmission investments. One of the largest disruptors, however, may be the erosion of the utility business model itself. For almost a century, the utility business model has been built upon electric demand growth, or load growth. Reliable load growth fueled infrastructure investments in power generation and the grid that, in turn, allowed utilities to earn a capped return. The balance of grid-load1 1 Grid load is defined here as meeting electric demand through large-scale central generation and backbone transmission and distribution networks (i.e. the traditional utility portfolio of assets). 2 Source: EIA with 2012 data rolling 12 month average, Clareo analysis. growth = ROI is now under attack on both sides of the equation, and with it, the entire utility business model. Load growth has been flattening over time, raising the question whether we are, or will soon, be witnessing ‘peak electric load’ in the United States. Utility ROI’s are being redefined as the industry is moving from traditional expansionary investments to largely environmentally motivated upgrades or retrofits of existing generation and grid capital bases. Whether and how much of these different types of utility investments will be returned to shareholders is subject to heated debate and negotiation between many utilities and their regulators right now. However, the focus here will be to assess the left side of the equation, in particular, the outlook for grid-load growth. Load growth in the U.S. has been flattening considerably over time. Electric retail sales to end customers peaked in 2007 as shown in Figure 12 . The 2008 recession and subsequent slow recovery initially played an important role. More recently utilities have pointed to ‘unfavorable weather’ in their quarterly reports in an attempt to explain continued demand stagnation. Is ‘weather’ masking a more fundamental underlying trend? Figure 1: Retail Electric Sales to Ultimate Customers (Billion kWh)
- 2. assumed for utilities. Macro drivers alone, however, are no longer sufficient to determine load growth for utilities. Several technology drivers are gaining momentum and could effectively reverse any remaining load growth on the grid. Technology Driving Load Growth Three technology drivers have real potential to further reduce load growth on the utility grid: • energy efficiency gains, • smart grids, • and decentralized generation and storage. Power consumption efficiency gains derived from CFL or LED lights to appliances and air- conditioners are making their way into more homes. Generally high IRRs are pushing commercial and industrial users to adopt large-scale building and facility retrofits. While their impact today may still be small, projections see electric consumption curbed by 4% to 5% in 2020 and around 8% by 2030 owing to efficiency gains alone, as shown in Figure 35 . Driving these gains are improved energy efficiency labeling; new metrics; green product launches at lower prices; and active merchandising by major retailers that have accelerated mindset changes and adoptions by consumers. Clareo Partners2 THOUGHT LEADERSHIP | Energy Macro Impacts on Load Growth Stepping back and looking at longer-term historic drivers, two macro impacts generally affect developed economies in mature stages: (1) flattening or stagnating economic growth and (2) reduced energy intensity. Following the decade long growth stagnation or decline in Western Europe and Japan, the U.S. is now facing relatively anemic GDP growth of 1.5% to 2.5% in future years3 . Gone are the heydays of 3% or more growth per year. Long- term structural realignment in the housing, financial, manufacturing and other sectors is the cause. As the U.S. continues to mature from resource and manufacturing sectors to service, finance, and other less energy-intensive sectors, electric intensity per GDP continues to drop accordingly as seen in Figure 24 . A muted economic growth outlook combined with declining energy and electric intensity point to a sub-1.5% or possibly sub-1% load growth outlook for utilities based on macro drivers—a material departure from the traditionally more accepted 1.5% to 2.5% organic growth potential 3 Source: The World Bank. 4 Source: EIA, EPRI, Clareo analysis. 5 Source: U.S. Bureau of Economic Analysis, Clareo analysis. 0% 2% 4% 6% 8% 10% 1950-60 1960-70 1970-80 1980-90 1990-2000 2000-10 2010-20? US Energy Demand Growth US Electric Demand Growth Figure 2: U.S. Energy and Electric Demand Growth by Decade Figure 3: Electric Demand Efficiency Gains by Sector 0% 2% 4% 6% 8% 10% Res Ind Com Res Ind Com Res Ind Com 2010 2020 2030 PercentEfficiencyGainfromCurrentBaseline
- 3. An enhanced, more optimized grid—or smart grid—will do its part to mute load growth on the grid. Peak-shaving and valley- filling technologies, such as • demand-side management, • real-time metering, • congestion management, • tiered or spot pricing, • and other processes or tools, will allow for better distribution and utilization of existing energy on the grid (Figure 4). Smart grids will also improve integration and leverage new intermittent sources such as wind and solar. The third and most underestimated load growth disruptor is decentralized self-generation and new storage technologies. Decentralized or end-use generation and storage takes load away from the grid and replaces it on the edge of the grid close to the end-user shown in Figure 5. This trade-off in the generation footprint captures business from traditional utilities that control the grid and transfers it into a nascent grid-edge market with new players and different business models. Solar photovoltaic (PV) panels are surfacing on an increasing number of rooftops in many neighborhoods across the country. Solar installations in particular have benefited from two market developments: a rapid decline in the cost of solar panel production and installation (Figure 6)6 and novel financing offers. Supported by federal or state sponsored financial and tax incentives, solar companies are able to offer leases that require no upfront capital investment for the end-user yet allow them to save on their utility bill from day one, even when including lease payments. Depending on location, load footprint, and installation size, a single-family house can reduce its grid-load demand by between 20% to 60%. Combine that with forthcoming home-based battery storage and electric vehicle to grid technology and end-user load may begin to drop off dramatically with increasing solar penetration rates. Industrial and commercial customers will seize similar opportunities. The U.S. military’s goal of shaving three GW of load from their demand by 2025 is a case in point. The Army, Air Force, and Navy each have pledged to reduce their power consumption by one GW through implementation of net-zero bases and facilities7 . A net-zero facility produces as much energy as it consumes. Three GW of load represents about 0.3% of the U.S. generation capacity, a significant reduction even on a national scale. 3The Utility Growth Challenge 6 Source: Clareo analysis. 7 Source: Katherine Hammack, Assistant Secretary of the Army for Installations, Energy, and the Environment, US Army; June 2012 Atlantic Council Keynote Figure 4: Illustrative Smart Grid Figure 5: Illustrative ‘Grid-Edge’
- 4. Utility Strategic Responses to Load Growth Decline The convergence of these three trends is making it imperative for utility companies to redefine their business model—status quo will no longer be enough. The old load-growth business model is in peril and must be redesigned. The first step is to have all stakeholders acknowledge and accept the challenge. The second step is to assess the scope of the challenge for their business. A thorough and honest assessment will be key to separate the white noise of weather and economic slowdown from medium- term grid-load trends. Utilities will have to focus in particular on analyzing and projecting end-user efficiency gains and self-generation trends in their geographic footprint. Reviewing the competitive landscape on the grid edge with its solar, efficiency, and other players will be as important as understanding their enabling technologies, costs, and adoption rates. The status of smart-grid deployments and their impacts on networks and customers are another important driver of the assessment. A natural next step is to assess the new grid-edge market in each utility’s footprint. The utility can then decide whether and how to participate. The current grid-edge market space is comprised of unregulated players. A regulated entry strategy for a utility would include negotiating efficiency gains, smart-grid investments, and end-user installations into the rate base with the regulators. The unregulated strategy would focus on keeping the newly created revenue streams and grid-edge load away from regulators. In either case, utilities will have to define a new business model as the existing rate mechanism won’t translate properly into this space. PG&E in California is an example of a utility that embraced the challenge head-on and has developed a decentralized solar offering for their commercial, industrial, and residential customers while also adding utility-scale solar installation to its generation portfolio8 . In contrast, Excel Energy, a Colorado utility is trying to prevent Boulder residents from receiving incentives for smaller solar installations and place a cap on energy-efficiency rebates9 . 4 THOUGHT LEADERSHIP | Energy 8 Source: http://www.pge.com/csi/ 9 Source: http://www.dailycamera.com/energy/ci_20964910/puc-rejects-xcel-bid-limit-boulder-access-energy $0.00 $1.00 $2.00 $3.00 $4.00 $5.00 $6.00 $7.00 1990 1991 1992 1993 1994 1995 1996 1997 1998 1999 2000 2001 2002 2003 2004 2005 2006 2007 2008 2009 2010 2011 Silicon Shortage Figure 6: Solar Module Pricing (2011 $/W)
- 5. Daniel Jaouiche djaouiche@clareopartners.com Copyright © 2012 Clareo Partners. All rights reserved. UTL_UTLYGWTHWP_062212_004 Significant opportunities may exist if a utility company redefines engagement with key stakeholders. Recognizing that utility companies are interdependent upon the communities where they operate and being proactive to customer preference and perception may lead to surprising possibilities. Independent of whether or not a utility decides to participate in the grid-edge market, it will have to reassess how it earns money today and the regulatory prerequisites. Will stagnating or contracting grid load still allow a utility to earn a proper return? And if not, what new model can be envisioned that fully decouples load growth from returns. It will take stepping out of conventional thinking and applying new lenses, ideas, and outside industry approaches to re-imagine the utility of the 21st century. About Clareo Partners Clareo Partners a strategy consulting firm designed to inspire and achieve transformational growth for enterprising businesses. We develop targeted strategies to drive growth through innovation, expansion in new markets, development & commercialization of new ideas, corporate entrepreneurship, and venturing & licensing. Poised at the intersection of business, academia, design, science, art and entrepreneurship, we offer access to a global network of distinguished opinion leaders.Through its highly collaborative methodology, Clareo works with clients to deliver breakthrough, innovative thinking, a practical, clear roadmap, and the customized toolset to reach its long term goals. We light the path. You lead the way. To find out more about Clareo Partners visit: www.clareopartners.com It should come as no surprise that the almost century-old public utility regulatory construct has finally started to crumble in the face of fundamental market changes. What are the opportunities for utility companies to reposition themselves as solution providers for the new energy markets of today—leveraging new technologies in efficiency and environment while at the same time achieving a healthy return?