The effect of particle fragmentation.pptx
•Transferir como PPTX, PDF•
0 gostou•29 visualizações

Effect of particle fragmentation on catalysis.

Recomendados
Recomendados
Mais conteúdo relacionado
Semelhante a The effect of particle fragmentation.pptx
Semelhante a The effect of particle fragmentation.pptx (20)
Mais de Helmholtz-Zentrum Berlin für Materialien und Energie
Mais de Helmholtz-Zentrum Berlin für Materialien und Energie (7)
Último
Último (20)
The effect of particle fragmentation.pptx
- 1. Literature Presentation Debabrata Bagchi Ph. D. Student 23/04/2019
- 3. Synthesis of Cu-Based NPs on Carbon support 60 mg of Cu(NO3)2·xH2O 10 mL of EG Stirring At 120°C + 20 mg of Carbon 1 mg of Cysteamine dispersed in 10 mL of EG Kept under Stirring At 120°C for 20 min 180°C for 7h 220°C for 4h Cu2O NP/C Cu@CuO NP/C 20 nm sized NP 200°C for 1h 2-4 nm sized NP
- 4. Electrochemical Study & Product Analysis Working Electrode: 1.0 mg of catalysts + 1.0 mL IPA + 30 μL Nafion (5 wt %) on GC plate, loading 0.4 mg/cm2, Membrane: Selemion AMV, anion exchange membrane, Counter Electrode: Pt foil, Reference Electrode: Ag/AgCl (3 M NaCl), Electrolyte: 0.1 M KHCO3, purged with CO2 gas flow rate of 20 sccm for more than 1 h at pH of 6.8 before CO2-RR. Chrono-Amperometry(CA): at each fixed potentials for 30 min, Gaseous Product Analysis: By online GC, Liquid Product Analysis: 1H NMR, 600MHz 700 μL of catholyte + 35 μL of an internal standard (10 mM DMSO, 50 mM phenol in D2O).
- 5. Cubic shaped NP with about 20 nm size Cu2O Nanoparticles on Carbon Support (Cu2O NP/C) In-Situ generated fragmented interconnected smaller( 2-4 nm sized NP) increased activity towards CO2-RR.
- 6. PXRD & XPS Analysis of Cu2O NP/C PXRD pattern revealed a face-centered cubic crystalline structure of Cu2O XPS had a main Cu 2p3/2 feature at 932.4 eV which can be assigned to either Cu2O (Cu+) or Cu (Cu0) but is not distinguishable from the metallic polycrystalline Cu foil because the binding energies between Cu+ and Cu0 differ by only 0.1 eV.
- 7. Auger spectra of Cu of Cu2O NP/C AES of Cu signal showed the presence of Cu+ (Cu2O) oxidation state near 569.9 eV, which is different from that of the polycrystalline Cu foil having both metallic Cu0 (568.0 eV) and natively oxidized Cu+ features (569.9 eV)
- 8. XPS spectra of S & N of Cu2O NP/C & Cu@CuO NP/C XPS S 2p and N 1s spectra showed sulfur and nitrogen element were present on the nanoparticle catalyst, related to cysteamine molecules
- 9. XANES spectra of Cu of Cu2O NP/C Cu2O NP/C catalyst had well matched XANES spectra with the Cu2O reference
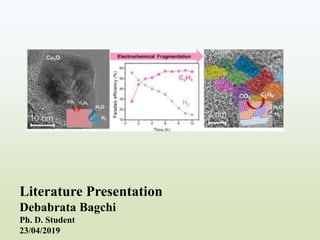
- 10. Electrochemical Fragmentation of Cu2O NP/C during CO2RR Faradaic efficiency for C2H4 production (FEC2H4) and total current density during 10 h at −1.1 V vs RHE, a favorable bias potential of Cu electrocatalysts for CO2RR. Catalyst produced an average of 57.3% FEC2H4 after 6 h, one of the highest FEs reported for C2H4 production
- 11. TEM Analysis of Cu2O NP/C catalyst during CO2RR The size and morphology of the NPs dramatically changes during the initial few hours, aggregation and destruction coincided.
- 12. HRTEM Images of Cu2O NP/C catalyst After 2h of CO2RR Distortion of crystal planes started from the outside of particles & formed distinct domains with different orientation indicating the destruction of the nanoparticle was induced at its surface. FEC2H4 is greatest between one & two hours when the fragmentation begins to be observed. During time 6 to 10 h, the overall morphology was similar showing fragmented small nanoparticles, and FEC2H4 reached a plateau around 55−60%.
- 13. After 10h of CO2RR : Cu2O NP/C catalyst 20 nm Cu2O NPs was completely collapsed and fragmented into smaller 2−4 nm sized crystalline.
- 14. Origin of NP Fragmentation: CO2-RR or only –ve Potential ? TEM & ED pattern of Cu2O NP/C after 10h reduction at -1.1 V under Ar atm. After 10 h of HER, initial cubic morphology was strongly deformed, but the fragmentation of the nanoparticle was not obtained. This suggests that CO2RR is crucial possibly due to the interaction between the surface of the nanoparticle catalyst and the chemical species such as intermediates (i.e., *CO or its coupled OCCO* intermediates).
- 15. Potential dependence of NP Fragmentation: After 10h CO2-RR -0.7 V -1.1 V -1.5 V Applied potentials (affect the catalytic activity & selectivity of the products) are important to cause optimal fragmentation of the Cu2O nanoparticle.
- 16. Effect of pH on NP Fragmentation: After 10h CO2-RR When CO2RR was conducted in the 0.1 M KCl acidic electrolyte (pH 3.9), agglomeration of the particles dominantly occurred. pH or the electrolyte type can influence on the crystal deformation at the surface. Adsorbate species (i.e., CO* or H*) or the negative repulsive electrostatic force on the surface can influence the thermodynamic stability of the copper surface leading to reconstruction in the opposite direction of the bulk expectation.
- 17. Logic behind Morphological Transformation Applied potential can reconstruct Cu surface as Cu has low cohesive energy Cu-based NPs are agglomerated to larger crystal size induced by the negatively applied potential to decrease the surface energy Low CO2RR activity Crystal plane started distortion from the surface to form defects through the interaction with intermediates of CO2RR, cysteamine, & Cu atom Defects have high selectivity for C−C coupling reaction from CO2RR. Deformation of the crystal structure can be accelerated as the coverage of intermediates increases with enhanced ethylene production from CO2RR. Steady state morphology of catalyst achieved with compact boundaries.
- 18. Electrochemical Surface Area (ECSA) The measured ECSAs of Cu2O NP/C increased as the nanoparticle was fragmented into small particles over the reaction time.
- 19. jgeometric vs. jECSA Current densities over reaction time at -1.1V normalised by a) geometric area b) Electrochemical Surface Area (ECSA) of Cu2O NP/C jECSA suggest that selectivity of C−C coupling reaction increased mainly due to the suppression of H2 production, while C2H4 production were more or less similar after 2 h of CO2RR
- 20. CO2RR Activity for Selective C2+ Production & HER Suppression
- 21. The impact of the mass transport is studied by varying CO2 flow rate. The product distribution was affected when CO2 flow rate was decreased from 20 to 10 sccm. CO2 conversion rate is calculated from the partial current density of each product It is found that CO2 conversion rate is closed to be saturated below −1.1 vs.RHE. The saturation of the CO2 conversion rate has been reported due to the mass transport limitation of the dissolved CO2 gas in the electrolyte. Mass transport limit in CO2-RR
- 22. Spherical shaped Cu@CuO NP/C
- 23. CO2-RR for 10 h at -1.1 V vs. RHE The Cu@CuO NP/C shows higher selectivity for CH4 production compared with fragmented Cu based Cu2O NP/C Maximum FE for C2+ products is less than previous one.
- 24. Role of Cysteamine Cu2O NP/C synthesized without cysteamine As synthesized After 10h of CO2RR The Cu2O NP synthesized by the one-pot synthesis has special fragmentation with the assistance of the cysteamine.
- 25. CO2-RR Activity of as-synthesized 2-4 nm sized Cu NP/C The small particle size alone do not contribute to CO2RR activity The defective structures having strain or under-coordinated surface sites at boundaries have been demonstrated to be active sites for promoting C−C coupling.
- 26. Operando XAS Set-up for CO2RR Synchrotron radiation beam at Pohang Accelerator Laboratory (PAL) 10 C beamline
- 27. XANES Spectra analysis during CO2-RR Metallic Cu0 is the active state under CO2RR, The oxidation state (Cu2O) of the catalyst reduces toward Cu0 during CO2RR XANES was also measured under OCV condition at each time, right after the applied potential was paused. after the 6 h of CO2RR, corresponding to the time when FEC2H4 was saturated to the maximum value and NPs were fragmented into small one, the catalyst was easily reoxidized to Cu2O at open circuit voltage condition in electrolyte without exposing air.
- 29. Faradaic Efficiencies of products at different potentials
- 30. Summary and Conclusion Unique morphological evolution Cu2O NPs catalysts during CO2RR & this in situ electrochemical fragmentation can be utilized to develop high selectivity for C2+ chemical production. The fragmented Cu-based NP/C catalysts especially reached high selectivity for C2H4 (FEC2H4 = 57.3%) and C2 + C3 chemicals (FEC2+C3 = 74%). Higher HER and CH4 production activity were achieved using Cu@CuO NP/C catalyst which did not evolve morphological transformation toward fragmentation. TEM & In-situ XAS suggests that unique morphology, combination of small sized Cu- based nanoparticles and compact arrangement, which selectively catalyzes C−C coupling and suppress HER. Thank you…..
- 32. Morphological evolution of the CuNCs during electrolysis. a–c Representative CuNCs of three different sizes: a 16 nm, b 41 nm, and c 65 nm, imaged with TEM at different operation times. The rectangle in a encloses an aggregated assembly of particles. The red and yellow arrows in b indicate small clusters and broken CuNCs, respectively. Scale bars: 100 nm Characterization of the nanoclusters during CO2-ER
- 33. Characterizations of the Cu nanoclusters formed during electrolysis. a–e of a, b Cu nanoclusters (<3 nm) and c–e Cu nanoparticles (~5 nm) formed from the 41 nm CuNCs during electrolysis for 4.5 h under CO2RR conditions. Circles in a, b, and c enclose regions containing nanoclusters and nanoparticles, respectively. e is a high-magnification view of the region boxed in d. f FFT of the HR-STEM image shown in e. Simulated electron diffraction pattern (blue rings: ring sampling diffraction planes; red spectrum: intensity profile) of Cu are included for reference. Scale bars: a 3 nm, b, c, e 5 nm, d 50 nm, and f 5 nm−1 High-resolution HAADF-STEM images
- 34. Electrocatalytic performance over time of the CuNCs. a–c Faradaic efficiency of gaseous products and current density from CuNCs of three different sizes: a 16 nm, b 41 nm, c 65 nm, collected during a 12 h-course of CO2RR. Shaded areas of each line show standard deviations from three independent measurements Impact of the morphological changes on the CO2RR performance.
- 35. Impact of the morphological changes on the CO2RR performance. Gaseous products of CO2RR. a-c Faradaic efficiencies of gaseous products, i.e., C2H4, CH4 and CO, for a 16, b 41 and c 65 nm CuNCs over a 12 h-course of CO2RR. Shaded areas of each line show standard deviations from three independent measurements.
Notas do Editor
- the ratio of peak area for formate to phenol, the ratio of peak areas for other products