SlideShare uma empresa Scribd logo
1 de 2
Baixar para ler offline
PROPRIETARY INFORMATION – USE ONLY WITH PERMISSION TalenTeck LLC White Paper
	
alen eck
TM
Smart data. Superior talent.
“Revealing the Hidden Costs of Employee Turnover”
Lalith Munasinghe, Rena Rosenberg, Cynthia Howells
Senior executives quantify thousands of costs in their organizations, yet the costs associated with
employee turnover— arguably a substantial expense particularly for labor intensive industries– are
rarely evaluated. Labor turnover quite literally means: ‘how many employees quit in a given year.’1
Executives intuitively know labor turnover is costly, yet most lack the rigorous framework to
systematically measure turnover the way they do just about every other project and program in the
budget. How can leaders manage what they can’t measure? We believe there are two basic questions
executives should be asking their teams to determine how much money you’re leaving on the table:
1. what is the financial impact of employee turnover?
2. how much is every per person reduction in turnover worth to us in EBITDA?
The framework that executives need is a useful breakdown of cash flow impacts. Reducing labor
turnover actually has two distinct components that can be quantified: (1) hiring and training savings,
and (2) productivity gains. Hiring and training new employees are hard money costs that are avoided
when employees stay, but top-line revenue growth is also gained when hired and trained employees
remain at the firm long enough to be sufficiently productive.
To make the cash flow
impact breakdown
tangible, here’s an
example of what we’ve
modeled at a real
company. The chart at
right shows results
from one of our case-
studies. It lays out the
percentage of
employee turnover
reduction (x-axis)
against actual
EBITDA impact (y-
axis). The top (blue)
bars map out Cost
Savings, or the hard-
costs of hiring and
training saved as
turnover is reduced.
The lower (orange)
bars show Productivity
Gains, or hidden impact in top-line revenue due to higher employee productivity as turnover is
																																																								
1 While recent media has focused on turnover of tenured employees -- for good reason due to things like promotion biases, work/life
balance, and pay differentials -- companies who get the early employee pipeline right should also see a positive impact on retention.
PROPRIETARY INFORMATION – USE ONLY WITH PERMISSION TalenTeck LLC White Paper
	
alen eck
TM
Smart data. Superior talent.
reduced. Each full bar represents the total Bottom-Line impact, the addition of the Cost Savings
plus Productivity Gains, to the firm at each level of turnover reduction, from existing levels.
In this particular example, if there was no turnover at the company, i.e., an absence of turnover or
100% turnover reduction, the y-axis shows the company could add $173 million annually to the
bottom-line (far right bar). Those benefits are split: approximately 60% / 40%; where the 60% come
from additional employee productivity of $100 million, and the 40% are due to hiring and training
savings of $73 million annually. In fact, the estimated total $173 million turnover gains left the table
far exceeds the actual EBITDA of this case-study company! Why wouldn’t senior executives want to
capture at least a part of that value?
Of course, saving all labor turnover costs by entirely eliminating employee turnover is unrealistic.
Turnover will never be zero, but even a small reduction yields big benefits.
Returning to this example, let’s look at what their executives believed was a more reasonable
reduction in turnover. This company’s actual turnover hovers around 75%. A 10% reduction in
turnover, from the 75.0% existing turnover to a 67.5%, adds a total of $40 million of the total
potential $173 million projected gains. That $40 million is divided into $19 million gained in hiring
and training, and $21 million in top-line revenue growth due to higher productivity. The kicker is –
the $40 million gain represents more than a 31% increase in EBITDA.
Your firm doesn’t have to reduce turnover very far to see enormous benefits. With the right tools,
the breakdown of the advantages is elementary. So we have to ask, why wouldn’t a senior executive
want to quantify labor turnover to begin reaping these huge gains?
To find our more about your company’s labor turnover costs, contact us at www.talenteck.com

Mais conteúdo relacionado

Mais procurados

Finance 320 Research Project
Finance 320 Research ProjectFinance 320 Research Project
Finance 320 Research ProjectSam Gritzmacher
 
070801 financial presentation
070801 financial presentation070801 financial presentation
070801 financial presentationMark Leslie
 
Stock Repurchases aka Share Buybacks for US Firms
Stock Repurchases aka Share Buybacks for US FirmsStock Repurchases aka Share Buybacks for US Firms
Stock Repurchases aka Share Buybacks for US FirmsPranav Ghai
 
Introduction to financial management ppt @ mba
Introduction to financial management ppt @ mbaIntroduction to financial management ppt @ mba
Introduction to financial management ppt @ mbaBabasab Patil
 
Ratio Analysis by Dr. Suresh vadde
Ratio Analysis by Dr. Suresh vaddeRatio Analysis by Dr. Suresh vadde
Ratio Analysis by Dr. Suresh vaddeSuresh Vadde
 
Ratio Analysis in Accounting
Ratio Analysis in AccountingRatio Analysis in Accounting
Ratio Analysis in AccountingCHIRANJIBI BISOI
 
Financial Accounting 6
Financial Accounting 6Financial Accounting 6
Financial Accounting 6KaleemSarwar2
 
Value Acceleration Lesson Learnt
Value Acceleration Lesson LearntValue Acceleration Lesson Learnt
Value Acceleration Lesson LearntVinh Nguyen
 
Cocacola ratio analysis
Cocacola ratio analysisCocacola ratio analysis
Cocacola ratio analysisgathondu
 

Mais procurados (13)

Finance 320 Research Project
Finance 320 Research ProjectFinance 320 Research Project
Finance 320 Research Project
 
Interpreting Financial Statements and their KPIs
Interpreting Financial Statements and their KPIsInterpreting Financial Statements and their KPIs
Interpreting Financial Statements and their KPIs
 
070801 financial presentation
070801 financial presentation070801 financial presentation
070801 financial presentation
 
Stock Repurchases aka Share Buybacks for US Firms
Stock Repurchases aka Share Buybacks for US FirmsStock Repurchases aka Share Buybacks for US Firms
Stock Repurchases aka Share Buybacks for US Firms
 
RELIANCE
RELIANCE RELIANCE
RELIANCE
 
Introduction to financial management ppt @ mba
Introduction to financial management ppt @ mbaIntroduction to financial management ppt @ mba
Introduction to financial management ppt @ mba
 
Ratio Analysis by Dr. Suresh vadde
Ratio Analysis by Dr. Suresh vaddeRatio Analysis by Dr. Suresh vadde
Ratio Analysis by Dr. Suresh vadde
 
Ratio Analysis in Accounting
Ratio Analysis in AccountingRatio Analysis in Accounting
Ratio Analysis in Accounting
 
Financial Accounting 6
Financial Accounting 6Financial Accounting 6
Financial Accounting 6
 
Value Acceleration Lesson Learnt
Value Acceleration Lesson LearntValue Acceleration Lesson Learnt
Value Acceleration Lesson Learnt
 
17 Key Financial Ratios
17 Key Financial Ratios17 Key Financial Ratios
17 Key Financial Ratios
 
Cocacola ratio analysis
Cocacola ratio analysisCocacola ratio analysis
Cocacola ratio analysis
 
corporate finance market ratio
corporate finance market ratiocorporate finance market ratio
corporate finance market ratio
 

Destaque

Счета под РЕПО с ЦК (T+ и Т0)
Счета под РЕПО с ЦК (T+ и Т0) Счета под РЕПО с ЦК (T+ и Т0)
Счета под РЕПО с ЦК (T+ и Т0) Sergey Filyaev
 
Mise en scene research
Mise en scene researchMise en scene research
Mise en scene researchNikki_Letts
 
Cetrix tesla brochure
Cetrix tesla brochure   Cetrix tesla brochure
Cetrix tesla brochure Linda Hawn
 
Mian Umar Sohail. Resume (1)
Mian Umar Sohail. Resume (1)Mian Umar Sohail. Resume (1)
Mian Umar Sohail. Resume (1)Mian Umar Sohail
 
Modern MySQL Monitoring and Dashboards.
Modern MySQL Monitoring and Dashboards.Modern MySQL Monitoring and Dashboards.
Modern MySQL Monitoring and Dashboards.Mydbops
 

Destaque (7)

Счета под РЕПО с ЦК (T+ и Т0)
Счета под РЕПО с ЦК (T+ и Т0) Счета под РЕПО с ЦК (T+ и Т0)
Счета под РЕПО с ЦК (T+ и Т0)
 
Mise en scene research
Mise en scene researchMise en scene research
Mise en scene research
 
Cetrix tesla brochure
Cetrix tesla brochure   Cetrix tesla brochure
Cetrix tesla brochure
 
Mian Umar Sohail. Resume (1)
Mian Umar Sohail. Resume (1)Mian Umar Sohail. Resume (1)
Mian Umar Sohail. Resume (1)
 
Sales Certificate
Sales CertificateSales Certificate
Sales Certificate
 
Build resources list v7
Build resources list v7Build resources list v7
Build resources list v7
 
Modern MySQL Monitoring and Dashboards.
Modern MySQL Monitoring and Dashboards.Modern MySQL Monitoring and Dashboards.
Modern MySQL Monitoring and Dashboards.
 

Semelhante a TT White Paper Series - Revealing the Hidden Costs of Turnover

Chapter EighteenManagement Making It WorkChapter OutlineMan.docx
Chapter EighteenManagement Making It WorkChapter OutlineMan.docxChapter EighteenManagement Making It WorkChapter OutlineMan.docx
Chapter EighteenManagement Making It WorkChapter OutlineMan.docxchristinemaritza
 
REDUCING INDIRECT COSTS IN MANUFACTURING INDUSTRIES
REDUCING INDIRECT COSTS IN MANUFACTURING INDUSTRIESREDUCING INDIRECT COSTS IN MANUFACTURING INDUSTRIES
REDUCING INDIRECT COSTS IN MANUFACTURING INDUSTRIESfaizyelectrical
 
Final Presentation NotesSlide 1(2-5 minutes)KTI lost revenue.docx
Final Presentation NotesSlide 1(2-5 minutes)KTI lost revenue.docxFinal Presentation NotesSlide 1(2-5 minutes)KTI lost revenue.docx
Final Presentation NotesSlide 1(2-5 minutes)KTI lost revenue.docxAKHIL969626
 
Economis assigignmet 1
Economis assigignmet 1Economis assigignmet 1
Economis assigignmet 1MuhMostafa
 
BenchmarkIndex analysis -Final
BenchmarkIndex analysis -FinalBenchmarkIndex analysis -Final
BenchmarkIndex analysis -FinalJuho Kamula
 
Survey Ro Ir2
Survey Ro Ir2Survey Ro Ir2
Survey Ro Ir2jpalien
 
How do you measure the sucess of AP automation
How do you measure the sucess of AP automationHow do you measure the sucess of AP automation
How do you measure the sucess of AP automationSarah Fane
 
Industry report busprofserv
Industry report busprofservIndustry report busprofserv
Industry report busprofservkhibinite
 
Communications Systems Unloved Restructuring Story Portends To 70% Upside
Communications Systems Unloved Restructuring Story Portends To 70% UpsideCommunications Systems Unloved Restructuring Story Portends To 70% Upside
Communications Systems Unloved Restructuring Story Portends To 70% UpsideLester Goh
 
Procter And Gamble Financial Analysis
Procter And Gamble Financial AnalysisProcter And Gamble Financial Analysis
Procter And Gamble Financial AnalysisKaren Thompson
 
UV1385 Rev. Nov. 14, 2016 This technical note was .docx
UV1385  Rev. Nov. 14, 2016  This technical note was .docxUV1385  Rev. Nov. 14, 2016  This technical note was .docx
UV1385 Rev. Nov. 14, 2016 This technical note was .docxjessiehampson
 
Investment/Technical Analyst
Investment/Technical AnalystInvestment/Technical Analyst
Investment/Technical AnalystFinancialBuzzGuru
 
How to analyze profitability
How to analyze profitabilityHow to analyze profitability
How to analyze profitabilityLam Chuc
 
steel industry project.docx
steel industry project.docxsteel industry project.docx
steel industry project.docxAman Singh
 
Bottom line growth vs top line growth
Bottom line growth vs top line growthBottom line growth vs top line growth
Bottom line growth vs top line growthPRAAVEEN KUMAR MISHRA
 
Chapter 3 - Financial Benchmarking for Inventory Turns and Working Capital
Chapter 3 - Financial Benchmarking for Inventory Turns and Working CapitalChapter 3 - Financial Benchmarking for Inventory Turns and Working Capital
Chapter 3 - Financial Benchmarking for Inventory Turns and Working CapitalSolventure
 

Semelhante a TT White Paper Series - Revealing the Hidden Costs of Turnover (20)

Chapter EighteenManagement Making It WorkChapter OutlineMan.docx
Chapter EighteenManagement Making It WorkChapter OutlineMan.docxChapter EighteenManagement Making It WorkChapter OutlineMan.docx
Chapter EighteenManagement Making It WorkChapter OutlineMan.docx
 
EBITDA.pptx
EBITDA.pptxEBITDA.pptx
EBITDA.pptx
 
REDUCING INDIRECT COSTS IN MANUFACTURING INDUSTRIES
REDUCING INDIRECT COSTS IN MANUFACTURING INDUSTRIESREDUCING INDIRECT COSTS IN MANUFACTURING INDUSTRIES
REDUCING INDIRECT COSTS IN MANUFACTURING INDUSTRIES
 
Final Presentation NotesSlide 1(2-5 minutes)KTI lost revenue.docx
Final Presentation NotesSlide 1(2-5 minutes)KTI lost revenue.docxFinal Presentation NotesSlide 1(2-5 minutes)KTI lost revenue.docx
Final Presentation NotesSlide 1(2-5 minutes)KTI lost revenue.docx
 
Vantage point 2012_issue2
Vantage point 2012_issue2Vantage point 2012_issue2
Vantage point 2012_issue2
 
Economis assigignmet 1
Economis assigignmet 1Economis assigignmet 1
Economis assigignmet 1
 
BenchmarkIndex analysis -Final
BenchmarkIndex analysis -FinalBenchmarkIndex analysis -Final
BenchmarkIndex analysis -Final
 
Survey Ro Ir2
Survey Ro Ir2Survey Ro Ir2
Survey Ro Ir2
 
Survey Ro Ir2
Survey Ro Ir2Survey Ro Ir2
Survey Ro Ir2
 
How do you measure the sucess of AP automation
How do you measure the sucess of AP automationHow do you measure the sucess of AP automation
How do you measure the sucess of AP automation
 
Value of Employee Engagement
Value of Employee EngagementValue of Employee Engagement
Value of Employee Engagement
 
Industry report busprofserv
Industry report busprofservIndustry report busprofserv
Industry report busprofserv
 
Communications Systems Unloved Restructuring Story Portends To 70% Upside
Communications Systems Unloved Restructuring Story Portends To 70% UpsideCommunications Systems Unloved Restructuring Story Portends To 70% Upside
Communications Systems Unloved Restructuring Story Portends To 70% Upside
 
Procter And Gamble Financial Analysis
Procter And Gamble Financial AnalysisProcter And Gamble Financial Analysis
Procter And Gamble Financial Analysis
 
UV1385 Rev. Nov. 14, 2016 This technical note was .docx
UV1385  Rev. Nov. 14, 2016  This technical note was .docxUV1385  Rev. Nov. 14, 2016  This technical note was .docx
UV1385 Rev. Nov. 14, 2016 This technical note was .docx
 
Investment/Technical Analyst
Investment/Technical AnalystInvestment/Technical Analyst
Investment/Technical Analyst
 
How to analyze profitability
How to analyze profitabilityHow to analyze profitability
How to analyze profitability
 
steel industry project.docx
steel industry project.docxsteel industry project.docx
steel industry project.docx
 
Bottom line growth vs top line growth
Bottom line growth vs top line growthBottom line growth vs top line growth
Bottom line growth vs top line growth
 
Chapter 3 - Financial Benchmarking for Inventory Turns and Working Capital
Chapter 3 - Financial Benchmarking for Inventory Turns and Working CapitalChapter 3 - Financial Benchmarking for Inventory Turns and Working Capital
Chapter 3 - Financial Benchmarking for Inventory Turns and Working Capital
 

TT White Paper Series - Revealing the Hidden Costs of Turnover

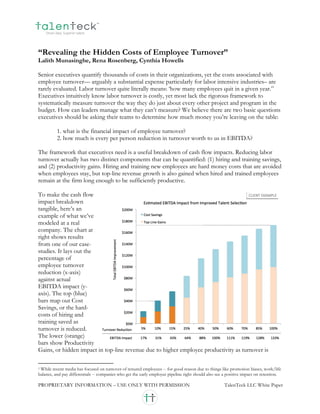
  • 1. PROPRIETARY INFORMATION – USE ONLY WITH PERMISSION TalenTeck LLC White Paper alen eck TM Smart data. Superior talent. “Revealing the Hidden Costs of Employee Turnover” Lalith Munasinghe, Rena Rosenberg, Cynthia Howells Senior executives quantify thousands of costs in their organizations, yet the costs associated with employee turnover— arguably a substantial expense particularly for labor intensive industries– are rarely evaluated. Labor turnover quite literally means: ‘how many employees quit in a given year.’1 Executives intuitively know labor turnover is costly, yet most lack the rigorous framework to systematically measure turnover the way they do just about every other project and program in the budget. How can leaders manage what they can’t measure? We believe there are two basic questions executives should be asking their teams to determine how much money you’re leaving on the table: 1. what is the financial impact of employee turnover? 2. how much is every per person reduction in turnover worth to us in EBITDA? The framework that executives need is a useful breakdown of cash flow impacts. Reducing labor turnover actually has two distinct components that can be quantified: (1) hiring and training savings, and (2) productivity gains. Hiring and training new employees are hard money costs that are avoided when employees stay, but top-line revenue growth is also gained when hired and trained employees remain at the firm long enough to be sufficiently productive. To make the cash flow impact breakdown tangible, here’s an example of what we’ve modeled at a real company. The chart at right shows results from one of our case- studies. It lays out the percentage of employee turnover reduction (x-axis) against actual EBITDA impact (y- axis). The top (blue) bars map out Cost Savings, or the hard- costs of hiring and training saved as turnover is reduced. The lower (orange) bars show Productivity Gains, or hidden impact in top-line revenue due to higher employee productivity as turnover is 1 While recent media has focused on turnover of tenured employees -- for good reason due to things like promotion biases, work/life balance, and pay differentials -- companies who get the early employee pipeline right should also see a positive impact on retention.
  • 2. PROPRIETARY INFORMATION – USE ONLY WITH PERMISSION TalenTeck LLC White Paper alen eck TM Smart data. Superior talent. reduced. Each full bar represents the total Bottom-Line impact, the addition of the Cost Savings plus Productivity Gains, to the firm at each level of turnover reduction, from existing levels. In this particular example, if there was no turnover at the company, i.e., an absence of turnover or 100% turnover reduction, the y-axis shows the company could add $173 million annually to the bottom-line (far right bar). Those benefits are split: approximately 60% / 40%; where the 60% come from additional employee productivity of $100 million, and the 40% are due to hiring and training savings of $73 million annually. In fact, the estimated total $173 million turnover gains left the table far exceeds the actual EBITDA of this case-study company! Why wouldn’t senior executives want to capture at least a part of that value? Of course, saving all labor turnover costs by entirely eliminating employee turnover is unrealistic. Turnover will never be zero, but even a small reduction yields big benefits. Returning to this example, let’s look at what their executives believed was a more reasonable reduction in turnover. This company’s actual turnover hovers around 75%. A 10% reduction in turnover, from the 75.0% existing turnover to a 67.5%, adds a total of $40 million of the total potential $173 million projected gains. That $40 million is divided into $19 million gained in hiring and training, and $21 million in top-line revenue growth due to higher productivity. The kicker is – the $40 million gain represents more than a 31% increase in EBITDA. Your firm doesn’t have to reduce turnover very far to see enormous benefits. With the right tools, the breakdown of the advantages is elementary. So we have to ask, why wouldn’t a senior executive want to quantify labor turnover to begin reaping these huge gains? To find our more about your company’s labor turnover costs, contact us at www.talenteck.com