Performance Performance Dashboard
•
0 gostou•634 visualizações

This document provides an overview of a presentation on navigating value-based reimbursement. The presentation covers MACRA regulations, readiness for MACRA, the significance of MACRA, leveraging technology, promoting interoperability, provider performance dashboards, additional dashboard benefits, healthcare and technology, and a wrap up. Key points include how MACRA replaced previous Medicare reimbursement with pay for performance, its two participation paths of MIPS and APMs, and how technology will be important for population health and meeting MACRA requirements through tools like provider performance dashboards.

Recomendados
Recomendados
Mais conteúdo relacionado
Mais procurados
Mais procurados (20)
Semelhante a Performance Performance Dashboard
Semelhante a Performance Performance Dashboard (20)
Mais de Citrin Cooperman
Mais de Citrin Cooperman (20)
Último
Último (20)
Performance Performance Dashboard
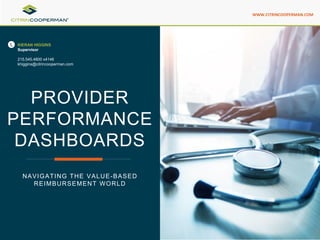
- 1. NAVIGATING THE VALUE-BASED REIMBURSEMENT WORLD WWW.CITRINCOOPERMAN.COM PROVIDER PERFORMANCE DASHBOARDS KIERAN HIGGINS Supervisor 215.545.4800 x4146 khiggins@citrincooperman.com
- 2. MEETING AGENDA SECTION 1 SECTION 2 SECTION 3 SECTION 4 SECTION 5 SECTION 6 MACRA Overview MACRA Readiness MACRA Significance Leveraging Technology for Practice Enhancement Promoting Interoperability Provider Performance Dashboard SECTION 7 SECTION 8 SECTION 9 Additional Dashboards and Benefits Healthcare and Technology Wrap Up
- 3. The Medicare Access & CHIP Reauthorization Act of 2015 MACRA Overview • Replaced the previous Medicare reimbursement schedule with a new pay-for- performance program • Focused on quality and accountability in patient care • January 1, 2017, eligible Medicare Part B providers entered into a new payment framework called the Quality Payment Program (QPP) • QPP has two paths for participation • Merit-based Incentive Payment System (MIPS) • Alternative Payment Models (APMs) • Advanced Alternative Payment Models
- 4. How would you rank your current understanding of MACRA? A. Never heard of it…. B. Low C. Good Enough… D. Expert POLLING QUESTION
- 5. MACRA Readiness Advanced APM Examples • Bundled Payments for Care Improvement Advanced Model (BPCI Advanced) • Comprehensive Primary Care Plus (CPC+) • Medicare Accountable Care Organization (ACO) Track 1+ Model • Next Generation ACO Model • Medicare Shared Savings Program - Track 2 • Medicare Shared Savings Program - Track 3 MIPS Year 1 and Year 2 Key Differences Year 1 Year 2 Reporting Requirements Offered a Pick Your Pace Option Test the Quality Payment Program Submit data for one quality measure or one improvement activity or all promoting interoperability base score measures, for one patient, once. Avoid a negative payment adjustment on 2019 claims. Participate for a Partial Year Submit data in all three categories with at least 50% data completeness for 90 or more consecutive days. Become eligible for a small positive adjustment on 2019 claims. Participate for a Full Year Submit data in all three categories with at least 50% data completeness for a full calendar year. Become eligible for a moderate positive adjustment on 2019 claims. Must report for a full calendar year Quality Report on 6 measures, with at least one outcome measure Promoting Interoperability Report all 4 Base measures and choose from 7 Performance measures Improvement Activities Report up to 4 measures Cost (new category) No data to report. Calculated based on Medicare Spending per Beneficiary and total per capita cost measures
- 6. MACRA Significance • Reimbursement will be paid based on the outcome of the care provided • Organizations (Providers) need to know what is happening across the continuum of care for every patient • Shifting the landscape from volume based to value based • Providers will be reliant on fast and accurate data to effectively manage patient care • Triple Aim 1. Improving the patient experience of care (Quality- Satisfaction) 2. Improving the health of populations 3. Reducing the per capita cost of health care What does this all mean?
- 7. • MIPS is designed to tie payments to quality and cost efficient care, drive improvement in care processes and health outcomes, increase the use of healthcare information, and reduce the cost of care • APMs are designed as a payment approach that gives added incentive payments to provide high-quality and cost-efficient care. APMs can apply to a specific clinical condition, a care episode, or a population • The best way to be successful in MACRA or other value based programs is to use technology to your advantage • Technology will be the main driver of Population Health and MACRA adherence Leveraging technology for practice enhancement
- 8. Goals of the Promoting Interoperability Category • Promote Patient Engagement • Promote the electronic exchange of health information using Certified Electronic Health Record Technology (CEHRT) Promoting Interoperability Base Score Performance Score Bonus Score Promoting Interoperability Performance Category Score
- 9. Is Your Current Technology Supporting Your Goals? • Are you using Certified EHR Technology (CEHRT)? • Is your CEHRT certified to the 2014 or 2015 edition? • This impacts the choice of measure set • Is your EHR vendor working with your practice to implement necessary changes to workflow? • Does your EHR accurately capture what you are doing to care for your patients related to these measures? • Does your EHR make it easy to access the information you need to meet the requirements? • Do you have the necessary patient engagement tools in place? Promoting Interoperability
- 10. Navigating the Value- Based Reimbursement World Provider Performance Dashboard
- 11. Does your organization (or your clients) have a current process in place to track quality and productivity? A. Of course! B. Sort of C. Not Really D. None at all POLLING QUESTION
- 12. CONTINUED • Customized performance dashboard circulated to each provider on a monthly basis • wRVU target tied to contract requirements • Estimated number of visits needed to meet monthly wRVU target • Average wRVU per patient visit • Provider patient visits compared against entire practice and CMS average Provider Performance Dashboard Jan 2018 Feb 12 2018
- 13. CONTINUED • Note locking tied to predetermined quality standard which could be tied to contract (drive better RCM) • Select quality metrics annually which correlate with MIPs or other value-based incentive program standards • Quality metric performance is tied to EMR registry or preexisting vendor reports Provider Performance Dashboard Jan 2018
- 14. CONTINUED Provider Performance Dashboard • Detailed report on all patient visits during current month and year to date • Provider has a high level view of the type of visits and procedures they have conducted on a month to month basis to drive productivity Jan 2018
- 15. Additional Dashboards Other examples of dashboards we assisted our clients with. • Admissions and readmissions • Days of Service Outstanding • Aging Buckets • Daily cash balance and cash collections • Daily census • Payment Lag • Gross revenue and payer mix of revenue • HCAHPs • Length of stay by service line • Maximum debt service coverage ratio • Observation stays • Occupancy by service line • Operating margin • Patient populations that drive costs the most • Staff overtime • Surgeries • Unrestricted days cash on hand
- 16. Benefits of a Dashboard Operational Efficiency • Dashboards can be designed to be flexible and configurable for the unique needs of any healthcare organization and can be adapted to include the monitoring of specific time-limited priorities • By highlighting areas in which the organization is underperforming, dashboards let managers monitor labor productivity, drill down into details to identify root causes of poor performance and support performance improvement initiatives • Dashboards facilitate the consolidation of data into a central location, thereby promoting data interaction and shortening the data capturing, provisioning and analyzing processes for future initiatives • Healthcare dashboards provide the capability to access more detailed information about key performance indicators and other key measures while identifying common variables from that data to draw new and previously unseen connections • Dashboards ensure greater transparency, highlight benefits of change initiatives and allow us to identify common variables from the data to draw new and previously unseen connections
- 17. We understand your challenges and are focused on meeting your needs. Our team is well-equipped to support your growth and vision. Common Health care Scenarios: • Your practice has outgrown its current IT system or IT solution provider • Your practice is moving into a new facility • Your practice is merging and facing IT integration issues • Your practice is having trouble adapting to recent regulatory changes (like MIPS) that require enhanced IT capabilities • Your practice is having difficulty implementing and benefiting from the software that it purchased • Your revenue is not what you expect • Your practice lacks an objective way to evaluate provider performance Our Approach: • Develop a comprehensive understanding of the practice’s culture, environment, personnel and needs • Identify appropriate technology solutions to meet the practice’s unique qualities and requirements • Maintain and communicate awareness of “hot topics” that practices need to be aware of • Facilitate positive and productive communication between the practice and outside vendors • Support the technology and take great care of the practice to ensure that the practice runs well and efficiently Healthcare and Technology
- 18. How is your practice or client currently performing? • Depending on the current Electronic Medical Record (EMR) it could be really hard to gauge. • Do you have a formal way of tracking your quality performance? • Do you track any important financial metrics? If so, how? • What tools are you giving your providers for success? • How do you hold providers accountable or incentivize performance? • How can Citrin Cooperman help? Wrap Up
- 20. THANK YOU! KIERAN HIGGINS Supervisor Citrin Cooperman khiggins@citrincooperman.com 215.545.4800 x4146 HELPING YOU FOCUS ON WHAT COUNTS Kieran has significant experience in financial projections, pro formas, budgeting, strategic operations and revenue cycle quality assurance. With a formal education in political science and economics Kieran has worked throughout his career to drive performance improvement using his understanding of public policy and applying it to strategic health care financial operations. Prior to joining Citrin Cooperman Kieran worked for a regional hospital system as a Senior Financial Operations Manager for the employed physician group and ambulatory operations team. He directed all of the value based performance collaborations and managed care negotiations. Kieran was the project manager lead for the 300+ provider group monitoring all financial performance, operational improvement, quality metrics, bonus structure and strategic alignment decision making. During Kieran’s tenure he worked through the onboarding of over 15 new physician groups and helped double the amount of primary and specialty care providers. He also co-directed RCM with the director of finance to oversee all charge capture, billing and collections. During his tenure Kieran oversaw the highest average daily cash collection rate in company history in addition to the least amount of insurance denials through operational improvements. WWW.CITRINCOOPERMAN.COM LORRAINE S. VALLE, LMSW, CPPM Manager Citrin Cooperman lvalle@citrincooperman.com 914.693.7000 ext. 122 Lorraine is a Manager in Citrin Cooperman’s Technology and Risk Advisory Consulting Practice (TRAC), with a focus on healthcare. A Certified Physician Practice Manager (CPPM®), Lorraine works closely with medical practices providing consulting services across a wide array of topics. As an outsourced practice administrator, she has managed all aspects of practices including EHR selection and implementation, MIPS measure management and attestation, vendor coordination, oversight of the billing department, staff management and bookkeeping. Lorraine is a licensed social worker and applies her training in all work with clients.