Recomendados

Recomendados
Mais conteúdo relacionado
Mais procurados
Mais procurados (20)
Destaque
Semelhante a 2015_SETAC_Chuan_10262015
Semelhante a 2015_SETAC_Chuan_10262015 (20)
2015_SETAC_Chuan_10262015
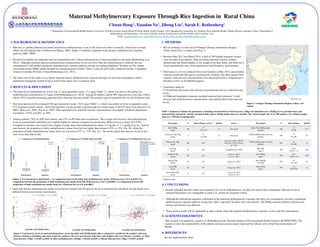
- 1. Maternal Methylmercury Exposure Through Rice Ingestion in Rural China 1 1Department of Environmental Health Sciences, University of South Carolina Arnold School of Public Health, South Carolina, USA; Shanghai Key Laboratory for Children's Environmental Health, Xinhua Hospital, Shanghai, China; 3Department of Epidemiology and Biostatistics, University of South Carolina Arnold School of Public Health, South Carolina, USA Email: chuan@email.sc.edu, xdyu1108@163.com, jliu@msilbox.sc.edu, rothenbs@mailbox.sc.edu • Mercury is a global pollutant and potent neurotoxin; methylmercury is one of the most toxic form of mercury, which most severely afflicts the developing fetus (Clarkson and Magos, 2003). Intake of seafood is regarded as the primary methylmercury exposure pathway (NRC, 2000). • Flooded rice paddies are important mercury methylation sites, where methylmercury is bioaccumulated in rice grain (Rothenberg et al., 2014). Although currently reported methylmercury concentrations in rice are lower than the concentrations in seafood, the rice consumption is still another significant methylmercury exposure pathway among rice-eating population. Yet there are few studies concerning dietary MeHg inkake through rice among pregnant women. There is only one pilot study conducted among 17 pregnant women in Guizhou Province, China (Rothenberg et al., 2013). • The major aim of this study is to evaluate maternal dietary methylmercury exposure through rice and fish consumption within a population of pregnant women living in rural China where rice is a primary food. Chuan Hong1, Xiaodan Yu2, Jihong Liu3, Sarah E. Rothenberg1 1. BACKGROUND & SIGNIFICANCE 3. RESULTS & DISCUSSION 4. CONCLUSIONS • We are working in a rural area of Guangxi Zhuang Autonomous Region, China, where rice is a staple food (Fig. 1). • Between May 2013 and March 2014, a total of 398 healthy pregnant women were recruited at parturition. After providing informed consent, mothers donated hair and blood samples, a rice sample from their home, and filled out a 4-part questionnaire and a semi-quantitative food frequency questionnaire. • Fish tissue (n=13) was collected from local markets in May 2014, and included common freshwater fish species consumed by residents. For other aquatic food varieties, total mercury concentrations were determined from a comprehensive literature review (n=8 published papers). • Laboratory analyses: (1) Freshwater fish tissue total mercury concentrations and rice methylmercury levels. (2) Maternal biomarkers measures included maternal hair (trimester 3) total mercury and methylmercury concentrations, and maternal blood total mercury levels. 2. METHODS Figure 1. Guangxi Zhuang Autonomous Region, China ( red region) Table 1. Summary statistics for parameters, including concentrations of total mercury (THg) and methylmercury (MeHg) in rice and fish tissue, and maternal hair and blood, and the calculated daily dietary MeHg intake from rice and fish. The cohort sample size (N) is 398 mothers. For column sample sizes are < 398 due to missing data. Parameters N Mean (Range) or N(%) Median Source Parameters N Mean (Range) Median Rice MeHg (ng/g) 398 2.7 (0.32-15) 2.2 This study Daily Total MeHg intake (ug/day) 398 1.2 (0-20) 0.77 Freshwater fish THg (ng/g) 13 31 (1.5-98) 23 This study %Daily MeHg intake from rice (ug/day) 396 71 (0-100) 87 Marine fish THg (ng/g) 838 64* Liu et al., 2014a, 2014b; Pan et al., 2014; Chen et al., 2013 %Daily MeHg intake from fish (ug/day) 396 29 (0-100) 13 Eel THg (ng/g) 21 50* Yamashita et al. 2006 Hair THg (μg/g ) 398 0.48 (0.077-1.7) 0.40 Shellfish THg (ng/g) 96 24* Lei et al., 2013; Li et al., 2013 Hair MeHg (μg/g ) 398 0.32 (0.011-1.4) 0.28 Shrimp THg (ng/g) 10 10* Tong et al., 2015 Hair %MeHg (of THg) 398 67 (14-110) 67 Crab THg (ng/g) 10 74* Tong et al., 2015 Blood THg (ug/L) 397 1.5 (0.29-8.6) 1.2 Spiral Shell THg (ng/g) 11 28* Tong et al., 2015; Lei et al., 2013 DailyTotalMeHgintake (µg/day) Non-farmers Figure 2. For non-farmers and farmers, (a) comparison between the daily total methylmercury intake (Wilcoxon test, z=3.3, p<0.01); (b) comparison between the proportion of daily methylmercury intake from fish (Wilcoxon test, z=4.7, p<0.0001); (c) comparison between the proportion of daily methylmercury intake from rice (Wilcoxon test, z=-4.9, p<0.0001) Figure 3. Log mercury levels in maternal biomarkers versus log daily total MeHg intake plus a categorical variable for the mother’s job (non- farmers / farmers), including regression trends for mothers who were non-farmers (blue line) and mothers who were farmers (red line). (a) Hair total mercury (THg): r2=0.039, p<0.01 (b) Hair methylmercury (MeHg): r2=0.032, p<0.01 (c) Blood total mercury (THg): r2=0.037, p<0.01 • Results indicated that this cohort was exposed to low-level methylmercury via daily rice and/or fish consumption. Mercury levels in maternal biomarkers was comparable to some U.S. cohorts for pregnant women. • Although the fish/shrimp ingestion contributed to the maternal methylmercury exposure, the daily rice consumption was also a significant methylmercury exposure pathway among this cohort, especially for those who were farmers. The MeHg exposure pathway between non- farmers and farmers was different. • These present results will be applicable to other cohorts where the prenatal methylmercury exposure via rice and fish consumption. • The mean of rice methylmercury levels was 2.7 ng/g (geometric mean = 2.1 ng/g) (Table 1.), which was close to the global rice methylmercury concentration (2.5 ng/g, from Rothenberg et al., 2014). Among all mothers, nearly 90% ingested rice every day, while a subset (58%) reported consuming ingested fish at least one time per month. The primary type of consumed fish was the freshwater fish. • Hair total mercury levels averaged 0.48 ug/g (geometric mean = 0.41 ug/g) (Table 1.), which was similar or lower compared to some U.S. pregnant women cohorts, where fish ingestion was the primary exposure pathway (mean range: 0.29-0.55 ug/g, from Stewart et al., 2003; Oken et al., 2005; Xue et al., 2007). Hair methylmercury and total mercury concentrations were highly correlated (Spearman’s correlation: r=0.92, p<0.001, n=398). • Among mothers, 78% (n=309) were famers, and 23% (n=89) held other occupations. The average total mercury and methylmercury levels in maternal hair and blood were slightly highly for farmers compared to non-farmers (Wilcoxon test, p range: 012-0.29). Compared to farmers, non-farmers had a higher average daily total methylmercury intake (1.5 ug/day vs. 1.1 ug/day, Fig. 2a). And for non-farmers, the proportion of daily methylmercury intake from fish was higher than farmers (43% vs. 25%, Fig. 2b), while the proportion of daily methylmercury intake from rice was lower (57% vs. 75%, Fig. 2c). The results reflect that mercury levels in rice were lower than that in fish. • Daily total dietary methylmercury intake was positively related with all mercury levels in maternal hair and blood, but the trends were different between non-farmers and farmers. Log Daily Total MeHg Intake 5. ACKNOWLEDGEMENTS This research was funded by a grant to S. Rothenberg by the National Institute of Environmental Health Sciences (R15ES022409). The content is solely the responsibility of the authors and does not necessarily represent the official views of the National Institutes of Health. Farmers Non-farmersNon-farmers FarmersFarmers %DailyTotalMeHgintake fromfish %DailyTotalMeHgintake fromrice a. Comparison of Total MeHg intake LogBloodTHg LogHairTHg LogHairMeHg Log Daily Total MeHg IntakeLog Daily Total MeHg Intake The study site * Weighted mean a. b. c. 6. REFERENCES See the supplementary sheet. c. Comparison of %MeHg intake from riceb. Comparison of %MeHg intake from fish Wilcoxon P<0.01 Wilcoxon P<0.0001 Wilcoxon P<0.0001