
Recomendados
Mais conteúdo relacionado
Mais procurados
Mais procurados (18)
Destaque
Destaque (17)
Semelhante a MEA
Semelhante a MEA (20)
MEA
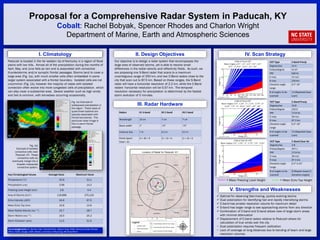
- 1. Proposal for a Comprehensive Radar System in Paducah, KY Cobalt: Rachel Bobyak, Spencer Rhodes and Charlon Wright Department of Marine, Earth and Atmospheric Sciences I. Climatology Paducah is located in the far western tip of Kentucky in a region of flood plains with low hills. Almost all of the precipitation during the months of April, May, and June falls as rain and is associated with convective thunderstorms and/or synoptic frontal passages. Storms tend to cover a large area (Fig. 1a), with much smaller cells often embedded in some larger system associated with a frontal boundary. Isolated cells are not uncommon (Fig. 1b), however the majority of cases with isolated convection often evolve into more congested cells of precipitation, which can also cover a substantial area. Severe weather such as high winds and hail is common, with tornadoes occurring occasionally. II. Design Objectives III. Radar Hardware IV. Scan Strategy Fig. 1a) Example of widespread precipitation in the region. These types of quasi-linear systems are typically associated with frontal boundaries. This particular radar image is from a warm frontal passage. Fig. 1b) Example of isolated convective cells near Paducah, KY. These convective cells do eventually merge into a broader mesoscale convective system. Optimal for observing fast-moving, quickly evolving storms Dual polarization for identifying hail and rapidly intensifying storms C-band has smaller resolution volume for maximum detail S-band has larger range to see approaching storms from any direction Combination of C-band and S-band allows view of large storm areas with minimal attenuation Displacement of C-band radars relative to Paducah allows for calculation of true winds over the city − Dual polarization requires frequent calibration − Lack of coverage at long distances due to bending of beam and large resolution volumes V. Strengths and Weaknesses Our objective is to design a radar system that encompasses the large area of observed storms, yet is able to resolve small differences in the radial velocity and reflectivity fields. As such, we are proposing one S-Band radar that scans to a maximum unambiguous range of 250 km, and two C-Band radars close to the city that scan out to 87.5 km. Based on these ranges, the S-Band radar will have a horizontal resolution of 2.2 km, while the C-Band radars’ horizontal resolution will be 0.57 km. The temporal resolution necessary for precipitation is determined by the fastest storm evolution of 5 minutes. Radars #1 S-band #2 C-band #3 C-band Wavelength 10 cm 7 cm 7 cm Beam width 1° .75° .75° Antenna Size 7 m 6.5 m 6.5 m Points Spent Total = 21 (1 + 8) = 9 (1 + 5) = 6 (1 + 5) = 6 VCP Type S-Band Precip Degrees/sec 14.4 Pulses/degree 41.67 PRF 600 Hz V max 15 m/s R max 250 km Elevation angle range 0.5°-16° # of angles to be scanned 12 (Repeated base scan) VCP Type C-Band Precip Degrees/sec 16.8 Pulses/degree 102.0 PRF 1714 Hz V max 30 m/s R max 87.5 km Elevation angle range 0.5°-18° # of angles to be scanned 14 (Repeated base scan) VCP Type C-Band Clear Air Degrees/sec 4.8 Pulses/degree 357.1 PRF 1714 Hz V max 30 m/s R max 87.5 km Elevation angle range 0.5°-4.25° # of angles to be scanned 8 (Repeat lowest 2 elevation angles)Key Climatological Values Average Value Maximum Value Temperature (°𝐶) 20.9 31.1 Precipitation (𝑐𝑚) 3.99 14.2 Freezing Level Height (𝑘𝑚) 3.8 4.4 Area of Storms (𝑘𝑚2) 119,886 274,133 Echo Intensity (𝑑𝐵𝑍) 34.6 67.0 Mean Echo Top (𝑘𝑚) 10.6 14.6 Mean Radial Velocity (𝑚𝑠−1 ) 10.7 28.7 Storm Motion (𝑚𝑠−1) 16.0 25.2 Storm Evolution (𝑚𝑖𝑛) 11.5 21.0 = Mean Freezing Level Height = Mean Echo Top Height Acknowledgements: Dr. Sandra Yuter, Nicole Corbin, Jessica King, NOAA, Kentucky State Climate Office, NCDC, Google, ESRI, Matlab, University of Wyoming, MS PowerPoint