
Recomendados
Recomendados
Mais conteúdo relacionado
Mais procurados
Mais procurados (20)
Destaque
Destaque (14)
Semelhante a Towers-Watson-Insider-Workers-Still-Uneasy-About-Financial
Semelhante a Towers-Watson-Insider-Workers-Still-Uneasy-About-Financial (20)
Towers-Watson-Insider-Workers-Still-Uneasy-About-Financial
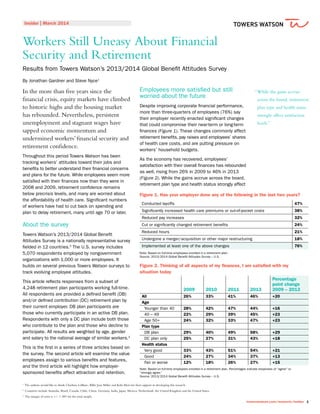
- 1. Insider | March 2014 towerswatson.com/research/insider 1 Workers Still Uneasy About Financial Security and Retirement Results from Towers Watson’s 2013/2014 Global Benefit Attitudes Survey By Jonathan Gardner and Steve Nyce1 In the more than five years since the financial crisis, equity markets have climbed to historic highs and the housing market has rebounded. Nevertheless, persistent unemployment and stagnant wages have sapped economic momentum and undermined workers’ financial security and retirement confidence. Throughout this period Towers Watson has been tracking workers’ attitudes toward their jobs and benefits to better understand their financial concerns and plans for the future. While employees seem more satisfied with their finances now than they were in 2008 and 2009, retirement confidence remains below precrisis levels, and many are worried about the affordability of health care. Significant numbers of workers have had to cut back on spending and plan to delay retirement, many until age 70 or later. About the survey Towers Watson’s 2013/2014 Global Benefit Attitudes Survey is a nationally representative survey fielded in 12 countries.2 The U.S. survey includes 5,070 respondents employed by nongovernment organizations with 1,000 or more employees. It builds on several previous Towers Watson surveys to track evolving employee attitudes. This article reflects responses from a subset of 4,248 retirement plan participants working full-time. All respondents are provided a defined benefit (DB) and/or defined contribution (DC) retirement plan by their current employer. DB plan participants are those who currently participate in an active DB plan. Respondents with only a DC plan include both those who contribute to the plan and those who decline to participate. All results are weighted by age, gender and salary to the national average of similar workers.3 This is the first in a series of three articles based on the survey. The second article will examine the value employees assign to various benefits and features, and the third article will highlight how employer- sponsored benefits affect attraction and retention. Employees more satisfied but still worried about the future Despite improving corporate financial performance, more than three-quarters of employees (76%) say their employer recently enacted significant changes that could compromise their near-term or long-term finances (Figure 1). These changes commonly affect retirement benefits, pay raises and employees’ shares of health care costs, and are putting pressure on workers’ household budgets. As the economy has recovered, employees’ satisfaction with their overall finances has rebounded as well, rising from 26% in 2009 to 46% in 2013 (Figure 2). While the gains accrue across the board, retirement plan type and health status strongly affect 1 The authors would like to thank Charlene LeBlanc, Billie Jean Miller and Koki Mori for their support in developing this research. 2 Countries include Australia, Brazil, Canada, Chile, China, Germany, India, Japan, Mexico, Netherlands, the United Kingdom and the United States. 3 The margin of error is +/- 1.38% for the total sample. Figure 1. Has your employer done any of the following in the last two years? Conducted layoffs 47% Significantly increased health care premiums or out-of-pocket costs 38% Reduced pay increases 32% Cut or significantly changed retirement benefits 24% Reduced hours 21% Undergone a merger/acquisition or other major restructuring 18% Implemented at least one of the above changes 76% Note: Based on full-time employees enrolled in a retirement plan. Source: 2013/2014 Global Benefit Attitudes Survey – U.S. Figure 2. Thinking of all aspects of my finances, I am satisfied with my situation today 2009 2010 2011 2013 Percentage point change 2009 – 2013 All 26% 33% 41% 46% +20 Age Younger than 40 28% 42% 47% 44% +16 40 – 49 22% 29% 39% 45% +23 Age 50+ 24% 32% 33% 47% +23 Plan type DB plan 29% 40% 49% 58% +29 DC plan only 25% 27% 31% 43% +18 Health status Very good 33% 43% 51% 54% +21 Good 24% 27% 34% 37% +13 Fair or worse 12% 18% 26% 27% +15 Note: Based on full-time employees enrolled in a retirement plan. Percentages indicate responses of “agree” or “strongly agree.” Source: 2013/2014 Global Benefit Attitudes Survey – U.S. ““While the gains accrue across the board, retirement plan type and health status strongly affect satisfaction levels.”
- 2. 2 towerswatson.com/research/insider Insider | March 2014 satisfaction levels. Participants in DB plans are 35% more likely to be satisfied with their finances than those with only a DC plan, and healthy workers are twice as likely to be content as those in poor health. Roughly half of employees remain unsatisfied with their finances and almost three in five are worried about their financial future (Figure 3). Workers who are less healthy and those who lack DB plans are both less satisfied with their current finances and more worried about the future. This might reflect both adverse changes in the workplace and broader economic uncertainties. Retirement confidence still trails precrisis levels Retirement confidence climbed between 2009 and 2013, and nearly one-quarter of employees are now “very confident” of having enough income for the first 15 years of retirement (Figure 4). This reflects improving financial conditions over the past four years as employees have rebuilt their savings. When asked to assess their prospects 25 years after retiring, however, only 8% remain confident of a financially comfortable retirement. The impact of the shift from DB to DC plans might be feeding through to financial worries about the future as employees prepare to bear more risk. Given increasing longevity, this gives cause for concern. Just as DB plan participants are more confident of their financial futures, they are also considerably more secure about their retirement income adequacy than DC-only employees in both the short and long term. Employees nearing the end of their careers are less optimistic about retirement and might have more realistic expectations than workers overall. The financial crisis hit this group particularly hard, with the stock market fall putting a huge dent in their retirement savings. Since the start of the financial crisis, confidence levels for workers age 50 and older have declined by 10 percentage points (Figure 5). In 2007, 34% were very confident of their ability to afford the first 15 years of retirement, compared with only 24% in 2013. Figure 3. I often worry about my current (or future) financial state 0% 10% 20% 30% 40% 50% 60% 70% 80% Fair or worse Good Very good Health status DC plan only DB plan Plan type Age 50+ Age 40 – 49 Younger than 40 Age All respondents 4747 5858 4343 5454 5252 6060 4646 5858 3838 5151 4949 5959 4242 5252 5252 6363 6666 7272 I Current finanical state I Future financial state Note: Based on full-time employees enrolled in a retirement plan. Percentages indicate responses of “agree” or “strongly agree.” Source: 2013/2014 Global Benefit Attitudes Survey – U.S. Figure 4. Confidence by retirement plan type, 15 and 25 years into retirement Years into retirement Plan type 2009 2010 2011 2013 Percentage point change 2009 – 2013 15 years Overall 18% 21% 25% 23% +5 DB plan 26% 29% 39% 35% +9 DC plan only 14% 17% 18% 20% +6 25 years Overall 8% 9% 14% 8% 0 DB plan 9% 14% 23% 11% +2 DC plan only 7% 6% 9% 7% 0 Note: Based on full-time employees enrolled in a retirement plan. Percentages indicate responses of “very confident.” Source: 2013/2014 Global Benefit Attitudes Survey – U.S. Figure 5. Older workers’ (age 50+) confidence in having enough resources 15 years into retirement 2007 2009 2010 2011 2013 Percentage point change 2007 – 2013 Not at all confident 9% 15% 12% 10% 13% +4 Not too confident 15% 21% 24% 23% 19% +4 Somewhat confident 42% 46% 40% 41% 43% +1 Very confident 34% 18% 24% 27% 24% –10 Note: Based on full-time employees enrolled in a retirement plan. Numbers for 2007 based on T. Hill (2008), Watson Wyatt’s 2007 U.S. Surveys of Older Employees’ and Retirees’ Attitudes Toward Lump-Sum and Annuity Distributions From Retirement Plans. Source: 2013/2014 Global Benefit Attitudes Survey – U.S. ““DB plan participants are considerably more secure about their retirement income adequacy than DC-only employees.”
- 3. towerswatson.com/research/insider 3 Insider | March 2014 Pessimistic outlook on public programs and medical costs has workers worried Economic progress seems to have fallen off course, and only 34% of employees expect to be better off in retirement than their parents. In addition to curtailments to workers’ private retirement plans, the public safety nets their parents and grandparents relied on are looking more precarious as well. Eighty-three percent of employees believe Social Security will be less valuable in the future and 88% have similar fears about Medicare. The pessimistic outlook for Social Security and Medicare likely reflects heightened concerns about government gridlock and the national debt. Employees know that weaker public finances and less generous employer benefits will impose a far greater retirement burden on individuals. Workers also worry about both current and long-term health care costs. Only two in five employees believe they can afford any medical expenses that might arise in the next 12 months. These concerns are more pronounced for midcareer and older employees and those in poor health. Additionally, 70% of employees fear higher out-of-pocket medical costs lie ahead. Escalating health care costs are already claiming larger shares of paychecks, and confidence in the affordability of health care further erodes when workers look ahead to retirement. Roughly half of all employees expect to be able to afford the health care they will need after retiring (Figure 6). Again, older workers, those in poor health and under-savers are particularly worried, and 80% of those who characterize themselves as “highly stressed” are apprehensive about future medical costs. Although DB plan participants look forward to a more financially secure retirement, they are not immune from these worries (Figure 6). While this group is moderately more confident of their ability to afford their medical expenses in retirement, roughly half of DB plan participants (45%) are afraid their retirement plan might be cut and about one-third (36%) fear having to bear more investment risk in the future (not reflected in Figure 6). And for DB plan participants who have recently undergone a cut to their retirement program, 70% fear more curtailments are on the horizon. Figure 6. I am concerned I will not be able to afford my medical expenses when I retire 0% 10% 20% 30% 40% 50% 60% 70% 80% Fair or worse Good Very good Health status $100K+ $50K to $100K Less than $50K Income Under-saving (less than 10%) Under-saving (more than 10%) On target High-savers Saving behavior DC plan only DB plan Plan type Age 50+ Age 40 – 49 Younger than 40 Age 2013 5353 5858 4747 5656 4848 5454 4646 5959 7272 5858 5252 4747 3333 3333 5454 6363 Note: Based on full-time employees enrolled in a retirement plan. Percentages indicate responses of “agree” or “strongly agree.” Source: 2013/2014 Global Benefit Attitudes Survey – U.S. ““Only two in five employees believe they can afford any medical expenses that might arise in the next 12 months.”
- 4. 4 towerswatson.com/research/insider Insider | March 2014 Employees continue to spend less and pay down debt In the aftermath of the financial crisis, many workers made it a priority to pay off debt, save for retirement and otherwise exercise more control over their household budgets. Reducing debt has become particularly important to workers over the last few years. In Towers Watson’s 2010 and 2011 surveys, eliminating debt was the action most frequently taken after the financial crisis, followed closely by reassessing retirement savings and reducing daily spending. More employees are spending less and postponing big purchases, up from 49% in 2011 to 56% in 2013 (Figure 7). More employees are reviewing their retirement savings frequently Since 2010, employees have become more involved and interested in retirement planning. Slightly more than half of all employees review their retirement plans frequently (Figure 8). Sixty-three percent of DB plan participants track their savings carefully compared with 48% of DC-plan-only participants. Older and midcareer workers report greater engagement with retirement than younger workers and saving for retirement is their number one financial priority (Figure 9, next page). While many employees worry about future health care expenses, two in five do not consider how these costs could reduce their retirement income. Low- income employees, those in poor health and under-savers are less likely than others to consider health care costs in their retirement planning. Internet and mobile apps have become popular ways for workers of all ages to track their finances. Older Figure 7. I have simplified my lifestyle over the last few years by spending less and delaying major expenditures 0% 10% 20% 30% 40% 50% 60% 70% 80% Fair or worse Good Very good Health status $100K+ $50K to $100K Less than $50K Income Under-saving (less than 10%) Under-saving (more than 10%) On target High-savers Saving behavior No plan DB plan Plan type Age 50+ Age 40 – 49 Younger than 40 Age 2013 5656 6060 5555 5454 5252 DC plan only 5757 6363 5454 5858 6565 6868 5555 4242 3838 4040 5959 6363 2011 4949 Note: Based on full-time employees enrolled in a retirement plan. “No plan” (n=452) is based on full-time employees. Percentages indicate responses of “agree” or “strongly agree.” Source: 2013/2014 Global Benefit Attitudes Survey – U.S. Figure 8. I have reviewed my retirement savings in a lot of detail over the last year 2010 2011 2013 Percentage point change 2010 – 2013 All 41% 47% 51% +10 Age Younger than 40 34% 48% 42% +8 40 – 49 36% 44% 50% +14 50+ 47% 48% 61% +14 Plan type DB plan 45% 54% 63% +18 DC plan only 37% 38% 48% +11 Note: Based on full-time employees enrolled in a retirement plan. Percentages indicate responses of “agree” or “strongly agree.” Source: 2013/2014 Global Benefit Attitudes Survey – U.S. ““While many employees worry about future health care expenses, two in five do not consider how these costs could reduce their retirement income.”
- 5. towerswatson.com/research/insider 5 Insider | March 2014 employees tend to use technology to review retirement plans, while younger ones use it to track household budgets and everyday spending (Figure 10). Overall, 62% of responding workers use mobile apps to manage their finances and 75% say they are effective tools. Could employees save more? As employees spend more time reviewing their finances, they have become more aware of gaps between their savings goals and reality. Sixty percent of survey respondents acknowledge that they need to save more if they hope to retire comfortably. This development has been consistent across all demographic groups over the last few years. Most employees — 83% — know their savings fall short of target amounts, with a 10% gap between what they should save and what they have managed to put away (Figure 11). All groups believe they should save 18% of income, but fewer than one in six are there. Unfortunately, a third of employees do not consider saving more to be a viable option, and time is running out for workers nearing retirement. Of the options available to those who haven’t saved enough — work longer, save more or live on less in retirement — 60% of older employees say they would work longer (Figure 12). Younger employees are slightly more likely to choose saving more, which could be an overestimation of their savings capacity. However, almost half of younger workers consider delaying retirement to be their best option. Figure 9. What would you say are currently your top financial priorities? Younger than 40 Age 40 – 49 Age 50+ 1 Housing (60%) Saving for retirement (56%) Saving for retirement (68%) 2 Pay off debts (55%) Pay off debts (49%) Pay off debts (47%) 3 General household costs (54%) Housing (45%) General household costs (44%) 4 General saving (for a “rainy day”) (36%) General household costs (45%) Housing (34%) 5 Saving for retirement (32%) General saving (for a “rainy day”) (37%) General saving (for a “rainy day”) (33%) 6 Leisure and other nonessential spending (19%) To fund children’s expenses (28%) Paying for medical expenses (23%) Note: Based on full-time employees enrolled in a retirement plan. Source: 2013/2014 Global Benefit Attitudes Survey – U.S. Figure 10. Do you use the Internet or mobile apps for any of the following reasons? Younger than 40 Age 40 – 49 Age 50+ Track my retirement savings 60% 76% 81% Compare prices of products to find the best deal 63% 63% 66% Track my financial investments 55% 65% 66% Monitor my household spending and budget 65% 48% 40% Research new investments 32% 39% 38% Get guidance to improve my financial situation 33% 31% 32% Note: Based on full-time employees enrolled in a retirement plan who use the Internet or mobile apps to manage their finances or retirement plans. Source: 2013/2014 Global Benefit Attitudes Survey – U.S. Figure 11. Considering all your savings (in total, including any retirement savings), how much of your income do you think you saved last year? Percentage income saved last year 0% 5% 10% 15% 20% 25% 30% Below targetOn targetAbove target Percentage of full-time employees All groups agree 18% is the ideal savings rate2525 4%4% 13%13% 83%83% 1818 88 Note: Based on full-time employees enrolled in a retirement plan. Source: 2013/2014 Global Benefit Attitudes Survey – U.S. Figure 12. If someone told you that your income in retirement wouldn’t be as much as you wanted, which action do you think you would be most likely to take? 0% 20% 40% 60% 80% 100% Younger than 40 Age 50+ Overall 2113453 60 20 17 3 46 45 7 2 I Work longer I Save more I Accept lower income in retirement I Do nothing and hope for the best Note: Based on full-time employees enrolled in a retirement plan. Source: 2013/2014 Global Benefit Attitudes Survey – U.S. ““All groups believe they should save 18% of income, but fewer than one in six are there.”
- 6. 6 towerswatson.com/research/insider Insider | March 2014 Delaying retirement is becoming more common Many workers expect to fall short on their retirement savings, and nearly four in 10 plan on working longer (Figure 13). The number of workers planning to extend their careers has increased nine percentage points since 2009. A large majority of these employees expect to delay retirement by three or more years, and 44% plan on a delay of five years or more (Figure 14). The profile of those delaying retirement tends toward the disengaged, less healthy and more stressed (Figure 13). In fact, more than half (57%) of workers in poor health and 59% of those reporting high stress levels have decided to delay retirement. These results suggest a higher average retirement age in the future. In 2009, 31% of workers planned on retiring before age 65 and 41% planned on retiring after 65 (Figure 15). In 2013, only 25% of workers planned on retiring before 65 and half expected to retire after 65. One in three employees either expects to retire after age 70 or not at all. Moreover, nearly half (46%) of the workers planning to retire at 70 or older are in poor health, which suggests “hidden pensioners” — older workers who continue working because they cannot afford to retire — on employers’ payrolls in the future with a possible decline in productivity.4 Conclusion Employees might be on a firmer financial footing now than they were in 2009, but many remain unsettled about their finances and their retirement prospects. Uncertainty around health care costs and erosion in the generosity of Social Security and Medicare are major roadblocks to retirement confidence. Older workers particularly have yet to regain their former confidence in their financial futures. Workers without DB plans and those in ill health are consistently the most worried about their finances and retirement. DB plan participants are moderately more secure and more engaged in reviewing their savings, but they continue to worry about possible changes to their plans and cuts to public programs. Employees are taking steps to address their lingering worries: spending less, paying down debt and trying to save more. Internet and mobile apps have emerged as popular tools to help employees manage their 4 Birchard Wyatt, one of the founders of The Wyatt Company, argued that a worker’s marginal contribution eventually reaches a peak and then begins declining, eventually dropping below the compensation cost of keeping him or her on the payroll. He termed such workers “hidden pensioners.” See Birchard E. Wyatt, “Private Retirement Plans,” Ph.D. dissertation (Columbia University, New York, 1936), 38. Figure 13. Has the age at which you plan to retire from full-time employment changed over the last three years? 0% 20% 40% 60% 80% 100% 2011 2010 2009 36334 40 54 5 39 56 5 2013 43 45 12 I Later I No change I Earlier +9 Employees who plan to retire later: Disengaged Low savers Fair/worse health High stress levels 49%49% 51%51% 57%57% 59%59% Note: Based on full-time employees enrolled in a retirement plan. Responses of “Don’t know” were removed. Source: 2013/2014 Global Benefit Attitudes Survey – U.S. Figure 14. Approximately how much later do you expect to work? 2009 2010 2011 2013 Percentage point change: 2009 – 2013 Less than 1 year 0% 1% 1% 0% 0 1 year to less than 2 years 8% 8% 10% 5% –3 2 years to less than 3 years 17% 23% 23% 18% +1 3 years to less than 5 years 22% 27% 24% 27% +5 5 years or more 41% 34% 36% 44% +3 Don’t know 11% 7% 7% 5% -6 Note: Based on full-time employees enrolled in a retirement plan who plan to delay retirement. Source: 2013/2014 Global Benefit Attitudes Survey – U.S. Figure 15. At what age do you expect to retire from all full-time employment? 2009 2010 2011 2013 Before age 65 31% 33% 37% 25% Before 55 4% 2% 3% 1% 55 – 59 9% 9% 11% 6% 60 – 61 7% 8% 10% 9% 62 – 64 11% 14% 12% 9% Age 65 17% 17% 20% 23% After age 65 41% 40% 34% 50% 66 – 69 22% 27% 22% 19% 70+ 14% 10% 10% 24% Never retire 5% 3% 2% 7% Don’t know 12% 9% 9% 2% Note: Based on full-time employees enrolled in a retirement plan. Source: 2013/2014 Global Benefit Attitudes Survey – U.S.
- 7. Insider | March 2014 Towers Watson is a leading global professional services company that helps organizations improve performance through effective people, risk and financial management. With more than 14,000 associates around the world, we offer consulting, technology and solutions in the areas of benefits, talent management, rewards, and risk and capital management. ““Many employees, especially older ones, plan to delay retirement by five or more years.” Copyright © 2014 Towers Watson. All rights reserved. towerswatson.com household budgets and their financial situations. Many workers believe they should save more for retirement and admit they are behind their targets. However, saving more money is difficult given the broader economic pressures they face. As a result, many employees, especially older ones, plan to delay retirement by five or more years. The heightened concerns around financial security represent an opportunity for employers. Specifically, today’s workforce constitutes a more receptive audience for employers seeking to educate their workers about health care costs and reinforce the value of their retirement programs. The proliferation of mobile apps also represents an opportunity for employers to offer retirement planning tools that can help employees better manage their current finances and put them on a savings path to a more secure retirement. America’s workforce is aging, with older workers becoming a larger share of the labor market. Many of these workers have no choice but to delay retirement, and a significant number are more stressed, less healthy and less engaged than other workers, thus posing the risk of hidden pensioners on payrolls. Employers might want to act to keep older workers more engaged and to ensure that their retirement programs are aligned with their workforce. For comments or questions, contact Jonathan Gardner at + 44 1737 274097, jonathan.gardner@towerswatson.com; or Steve Nyce at + 1 703 258 7573, steven.nyce@towerswatson.com.