SlideShare uma empresa Scribd logo
1 de 3
Baixar para ler offline
Population: 342,000
                THE BAHAMAS                                                                                                      Area: 13,939 sq km (5,382 sq miles)


                                                                    MAIN ECONOMIC INDICATORS
                                                           2000          2001        2002                    2003      2004    2005     2006      2007      2008       2009     2010
              GDP ($US, billion)                            5.65          5.76        6.08                    6.19     6.19     6.80     7.28     7.50       7.56       7.34     7.42

               GDP (% change)                               3.7           -0.3        2.6                     -0.9     -0.8     5.7      4.3       0.7       -1.7       -5.0     -0.5

            GDP per capita ($US)                           18,658        18,741      19,487                  19,560   19,302   20,917   22,094   22,449     22,359     21,529   21,539

Current account balance ($US, billion)                     -0.63         -0.59       -0.42                   -0.32     -0.17   -0.65    -1.37     -1.32     -1.17      -0.83    -1.07

Current account balance (% of GDP)                         -11.2         -10.3        -7.0                    -5.2     -2.8     -9.6    -18.9     -17.5     -15.4      -11.4    -14.4

             Inflation (% change)                           1.7           2.0         2.2                     3.0       1.0     2.2      1.8       2.5        4.5       2.1      1.7

            Unemployment+ (%)                                -             7           9                      11        10      10        8         8          -         -        -

                        GDP (% change)            Inflation (% change)                                                          GDP        Current account balance

                                                                                                               8.00
     6.5
                                                                                                               7.00
     4.5                                                                                                       6.00
                                                                                                               5.00
     2.5


                                                                                              $US Billions
                                                                                                               4.00
 %   0.5                                                                                                       3.00
                                                                                                               2.00
     -1.5    2000 2001 2002 2003 2004 2005 2006 2007 2008 2009 2010
                                                                                                               1.00
                                                                                                               0.00
     -3.5
                                                                                                              -1.00   2000 2001 2002 2003 2004 2005 2006 2007 2008 2009 2010
     -5.5                                                                                                     -2.00
                                                                     Source: IMF World Economic Outlook April 2010
 +
  Source: The World Bank - http://databank.worldbank.org
 *Numbers in italics represent estimates
Population: 342,000
             THE BAHAMAS                                                                                              Area: 13,939 sq km (5,382 sq miles)


                                                     MAIN TRADE INDICATORS – GOODS
                                                                            2004                   2005                   2006             2007                 2008
            Trade Balance ($US thousands)                                -1,574,828             -2,295,828             -2,474,890        -2,432,625         -2,528,440
         Total Exported Value ($US thousands)                              401,311               270,849                509,420           669,977              701,529
         Total Imported Value ($US thousands)                             1,976,139             2,566,677              2,984,310         3,102,602          3,229,969

            Top 10 Markets by % of Total Exported Value (2008)                                    Top 10 Markets by % of Total Imported Value (2008)

United States of America                                                70%           United States of America                                                    87%
                  Canada        5%                                                                  Venezuela            5%
                Germany         4%                                                         Netherland Antilles         2%
                   France      4%                                                         Trinidad and Tobago         1%
            Netherlands        3%                                                                         Japan       1%
                  Nigeria     2%                                                               United Kingdom         0.4%
  Turks & Caicos Islands      2%                                                                        Canada        0.4%
                  Mexico     1%                                                                    Switzerland        0.4%
        United Kingdom       1%                                                                          France       0.3%
               Argentina     1%                                                                            Cuba       0.3%


             Top 5 Exports by % of Total Exported Value (2008) Salt, sulphur,        Works of art, Top 5 Imports by % of Total Imported Value (2008)
                                                                  earth, stone,       collectors
                                                                  plaster, lime       pieces and                                     Vehicles other
         Plastics and                                                                                                                 than railway,
                                                                  and cement,        antiques, 4%
       articles thereof,                                                                                                              tramway, 5%
                                                       Organic         6%
              22%
                                                    chemicals, 11%
                                                                                                                                                 Electrical,
                                                                                                 Mineral fuels,                                 electronic
                                                        Fish,                                    oils, distillation                           equipment, 5%
                                                    crustaceans,                                  products, etc,
                                                                                                                                             Nuclear
                                                      molluscs,                                         26%
         Mineral fuels,                                                                                                                     reactors,
        oils, distillation                             aquatic                                                                               boilers,
        products, etc,                             invertebrates                                                                          machinery, etc,
               20%                                    nes, 12%                                                                                 8%
                                                        Source: International Trade Centre – www.trademap.org
Population: 342,000
             THE BAHAMAS                                                                                        Area: 13,939 sq km (5,382 sq miles)


                                                  MAIN TRADE INDICATORS – SERVICES
                                                                         2004                  2005                 2006                2007            2008
            Trade Balance ($US thousands)                             1,012,780              1,224,490             825,210            1,019,730       1,190,625
         Total Exported Value ($US thousands)                         2,244,080              2,510,900           2,436,080            2,599,350       2,543,322
         Total Imported Value ($US thousands)                         1,231,300              1,286,410           1,610,870            1,579,620       1,352,697

              Top Exports by % of Total Exported Value (2008)                                   Top Imports by % of Total Imported Value (2008)

                                                                                                   Other business services                                     33%
                 Travel                                            85%
                                                                                                            Transportation                              26%

                                                                                                                     Travel                           23%
Other business services        12%                                                                       Insurance services            8%

                                                                                                      Government services              7%

        Transportation    2%                                                                          Construction services     2%

                                                                                                 Royalties and license fees     1%

                                                                                  Personal, cultural & recreational services   0.1%
  Government services     2%
                                                                                                 Communications services       0.1%

                                                      Source: International Trade Centre – www.trademap.org

Mais conteúdo relacionado

Mais procurados

Roberto Coronado, Outlook for the El Paso-Juarez Region, Federal Reserve Bank...
Roberto Coronado, Outlook for the El Paso-Juarez Region, Federal Reserve Bank...Roberto Coronado, Outlook for the El Paso-Juarez Region, Federal Reserve Bank...
Roberto Coronado, Outlook for the El Paso-Juarez Region, Federal Reserve Bank...The Paso del Norte Group
 
Presentation jbs fixed income
Presentation jbs fixed incomePresentation jbs fixed income
Presentation jbs fixed incomeJBS RI
 
045 Presentacion%20 Colombia%20 December%202009%20(Ingles)
045 Presentacion%20 Colombia%20 December%202009%20(Ingles)045 Presentacion%20 Colombia%20 December%202009%20(Ingles)
045 Presentacion%20 Colombia%20 December%202009%20(Ingles)amigueldiaz
 
Moz public invst-agriculture
Moz public invst-agricultureMoz public invst-agriculture
Moz public invst-agricultureIFPRI-Maputo
 
Lesson 8 presentation
Lesson 8 presentationLesson 8 presentation
Lesson 8 presentationrhernande128
 
Statistical profile
Statistical profileStatistical profile
Statistical profilecarrieriddle
 
terex KeyBanc060508
terex KeyBanc060508terex KeyBanc060508
terex KeyBanc060508finance42
 
100804 apresentação de resultados 2 t10-inglês_sem script [modo de compatib...
100804   apresentação de resultados 2 t10-inglês_sem script [modo de compatib...100804   apresentação de resultados 2 t10-inglês_sem script [modo de compatib...
100804 apresentação de resultados 2 t10-inglês_sem script [modo de compatib...Multiplus
 
enterpriseSeattle Forecast 2012 - Ken Goldstein
enterpriseSeattle Forecast 2012 - Ken GoldsteinenterpriseSeattle Forecast 2012 - Ken Goldstein
enterpriseSeattle Forecast 2012 - Ken GoldsteinenterpriseSeattle
 
Residential Movement in the Greater Washington DC Area
Residential Movement in the Greater Washington DC AreaResidential Movement in the Greater Washington DC Area
Residential Movement in the Greater Washington DC AreaNar Res
 
BC Leading Housing Market - March 2011
BC Leading Housing Market -  March 2011BC Leading Housing Market -  March 2011
BC Leading Housing Market - March 2011Matt Collinge
 
Google student survey p4
Google student survey p4Google student survey p4
Google student survey p4liana1995
 

Mais procurados (18)

Trinidad & Tobago - Trade Profile [UWI's Shridath Ramphal Centre]
Trinidad & Tobago - Trade Profile [UWI's Shridath Ramphal Centre]Trinidad & Tobago - Trade Profile [UWI's Shridath Ramphal Centre]
Trinidad & Tobago - Trade Profile [UWI's Shridath Ramphal Centre]
 
St. Kitts & Nevis - Trade Profile [UWI's Shridath Ramphal Centre]
St. Kitts & Nevis -  Trade Profile [UWI's Shridath Ramphal Centre]St. Kitts & Nevis -  Trade Profile [UWI's Shridath Ramphal Centre]
St. Kitts & Nevis - Trade Profile [UWI's Shridath Ramphal Centre]
 
St. Lucia - Trade Profile [UWI's Shridath Ramphal Centre]
St. Lucia - Trade Profile [UWI's Shridath Ramphal Centre]St. Lucia - Trade Profile [UWI's Shridath Ramphal Centre]
St. Lucia - Trade Profile [UWI's Shridath Ramphal Centre]
 
Jamaica - Trade Profile [UWI's Shridath Ramphal Centre]
Jamaica -  Trade Profile [UWI's Shridath Ramphal Centre]Jamaica -  Trade Profile [UWI's Shridath Ramphal Centre]
Jamaica - Trade Profile [UWI's Shridath Ramphal Centre]
 
Suriname - Trade Profile [UWI's Shridath Ramphal Centre]
Suriname -  Trade Profile [UWI's Shridath Ramphal Centre]Suriname -  Trade Profile [UWI's Shridath Ramphal Centre]
Suriname - Trade Profile [UWI's Shridath Ramphal Centre]
 
Roberto Coronado, Outlook for the El Paso-Juarez Region, Federal Reserve Bank...
Roberto Coronado, Outlook for the El Paso-Juarez Region, Federal Reserve Bank...Roberto Coronado, Outlook for the El Paso-Juarez Region, Federal Reserve Bank...
Roberto Coronado, Outlook for the El Paso-Juarez Region, Federal Reserve Bank...
 
Presentation jbs fixed income
Presentation jbs fixed incomePresentation jbs fixed income
Presentation jbs fixed income
 
045 Presentacion%20 Colombia%20 December%202009%20(Ingles)
045 Presentacion%20 Colombia%20 December%202009%20(Ingles)045 Presentacion%20 Colombia%20 December%202009%20(Ingles)
045 Presentacion%20 Colombia%20 December%202009%20(Ingles)
 
Moz public invst-agriculture
Moz public invst-agricultureMoz public invst-agriculture
Moz public invst-agriculture
 
Lesson 8 presentation
Lesson 8 presentationLesson 8 presentation
Lesson 8 presentation
 
Statistical profile
Statistical profileStatistical profile
Statistical profile
 
Pilar Ramirez, Microcredit and Job Creation
Pilar Ramirez, Microcredit and Job CreationPilar Ramirez, Microcredit and Job Creation
Pilar Ramirez, Microcredit and Job Creation
 
terex KeyBanc060508
terex KeyBanc060508terex KeyBanc060508
terex KeyBanc060508
 
100804 apresentação de resultados 2 t10-inglês_sem script [modo de compatib...
100804   apresentação de resultados 2 t10-inglês_sem script [modo de compatib...100804   apresentação de resultados 2 t10-inglês_sem script [modo de compatib...
100804 apresentação de resultados 2 t10-inglês_sem script [modo de compatib...
 
enterpriseSeattle Forecast 2012 - Ken Goldstein
enterpriseSeattle Forecast 2012 - Ken GoldsteinenterpriseSeattle Forecast 2012 - Ken Goldstein
enterpriseSeattle Forecast 2012 - Ken Goldstein
 
Residential Movement in the Greater Washington DC Area
Residential Movement in the Greater Washington DC AreaResidential Movement in the Greater Washington DC Area
Residential Movement in the Greater Washington DC Area
 
BC Leading Housing Market - March 2011
BC Leading Housing Market -  March 2011BC Leading Housing Market -  March 2011
BC Leading Housing Market - March 2011
 
Google student survey p4
Google student survey p4Google student survey p4
Google student survey p4
 

Destaque

Destaque (8)

Jtc200 worm gear screw lifter,20000kg rotating screw jack,20ton travelling nu...
Jtc200 worm gear screw lifter,20000kg rotating screw jack,20ton travelling nu...Jtc200 worm gear screw lifter,20000kg rotating screw jack,20ton travelling nu...
Jtc200 worm gear screw lifter,20000kg rotating screw jack,20ton travelling nu...
 
Fashion
FashionFashion
Fashion
 
Catalogo3 junio
Catalogo3 junioCatalogo3 junio
Catalogo3 junio
 
美国五金展 4.25截止报名!
美国五金展 4.25截止报名!美国五金展 4.25截止报名!
美国五金展 4.25截止报名!
 
Jamaica's Country Economic Memorandum - Unlocking Growth [World Bank]
Jamaica's Country Economic Memorandum - Unlocking Growth [World Bank]Jamaica's Country Economic Memorandum - Unlocking Growth [World Bank]
Jamaica's Country Economic Memorandum - Unlocking Growth [World Bank]
 
Caribbean Export - CARICOM-Canada Trade Development Forum
Caribbean Export - CARICOM-Canada Trade Development ForumCaribbean Export - CARICOM-Canada Trade Development Forum
Caribbean Export - CARICOM-Canada Trade Development Forum
 
Jtc10 worm gear screw lifter,1t self locking worm gear jack,1 ton worm drive ...
Jtc10 worm gear screw lifter,1t self locking worm gear jack,1 ton worm drive ...Jtc10 worm gear screw lifter,1t self locking worm gear jack,1 ton worm drive ...
Jtc10 worm gear screw lifter,1t self locking worm gear jack,1 ton worm drive ...
 
Catalogo2 junio
Catalogo2 junioCatalogo2 junio
Catalogo2 junio
 

Semelhante a The Bahamas - Trade Profile UWI's Shridath Ramphal Centre

Sectoral Economic Development Strategy
Sectoral Economic Development StrategySectoral Economic Development Strategy
Sectoral Economic Development Strategyedunetwork
 
1Q09 Results Presentation
1Q09 Results Presentation1Q09 Results Presentation
1Q09 Results PresentationJBS RI
 
Grendene - 15th Annual Latin America Conference - Citigroup
Grendene - 15th Annual Latin America Conference - CitigroupGrendene - 15th Annual Latin America Conference - Citigroup
Grendene - 15th Annual Latin America Conference - CitigroupGrendene
 
omnicom group Q4 2008 Investor Presentation
omnicom group  Q4 2008 Investor Presentationomnicom group  Q4 2008 Investor Presentation
omnicom group Q4 2008 Investor Presentationfinance22
 
Economy of USA- An Current overview
Economy of USA- An Current overviewEconomy of USA- An Current overview
Economy of USA- An Current overviewRaj Kumar Singh
 
2005 - 5th Us Analyst And Investor Meeting Financials
2005 - 5th Us Analyst And Investor Meeting   Financials2005 - 5th Us Analyst And Investor Meeting   Financials
2005 - 5th Us Analyst And Investor Meeting FinancialsEmbraer RI
 
oe E. Harlan Executive Vice President, Electro and Communications Business
oe E. Harlan Executive Vice President, Electro and Communications Businessoe E. Harlan Executive Vice President, Electro and Communications Business
oe E. Harlan Executive Vice President, Electro and Communications Businessfinance10
 
2007 - 7th Analysts And Investors Meeting Results & Performance
2007 - 7th Analysts And Investors Meeting   Results & Performance2007 - 7th Analysts And Investors Meeting   Results & Performance
2007 - 7th Analysts And Investors Meeting Results & PerformanceEmbraer RI
 
2010 City Of Bethlehem Finance And Budget Presentation
2010 City Of Bethlehem Finance And Budget Presentation2010 City Of Bethlehem Finance And Budget Presentation
2010 City Of Bethlehem Finance And Budget PresentationNachman Shelef
 
Honeywell Gabelli & Company 12th Annual Aircraft Supplier Symposium Presentation
Honeywell Gabelli & Company 12th Annual Aircraft Supplier Symposium PresentationHoneywell Gabelli & Company 12th Annual Aircraft Supplier Symposium Presentation
Honeywell Gabelli & Company 12th Annual Aircraft Supplier Symposium Presentationfinance8
 
yahoo 3Q08EarningsPreso
yahoo 3Q08EarningsPresoyahoo 3Q08EarningsPreso
yahoo 3Q08EarningsPresofinance32
 
Understanding the Federal Budget and Implications for Adult Education
Understanding the Federal Budget and Implications for Adult EducationUnderstanding the Federal Budget and Implications for Adult Education
Understanding the Federal Budget and Implications for Adult EducationMarcie Foster
 
arnings Release 2Q07 Presentation
arnings Release 2Q07 Presentationarnings Release 2Q07 Presentation
arnings Release 2Q07 PresentationProfarma
 
Earnings Release 2 Q07
Earnings Release 2 Q07Earnings Release 2 Q07
Earnings Release 2 Q07Profarma
 

Semelhante a The Bahamas - Trade Profile UWI's Shridath Ramphal Centre (20)

Israel Economy
Israel EconomyIsrael Economy
Israel Economy
 
Federal
Federal Federal
Federal
 
Sectoral Economic Development Strategy
Sectoral Economic Development StrategySectoral Economic Development Strategy
Sectoral Economic Development Strategy
 
1Q09 Results Presentation
1Q09 Results Presentation1Q09 Results Presentation
1Q09 Results Presentation
 
Grendene - 15th Annual Latin America Conference - Citigroup
Grendene - 15th Annual Latin America Conference - CitigroupGrendene - 15th Annual Latin America Conference - Citigroup
Grendene - 15th Annual Latin America Conference - Citigroup
 
omnicom group Q4 2008 Investor Presentation
omnicom group  Q4 2008 Investor Presentationomnicom group  Q4 2008 Investor Presentation
omnicom group Q4 2008 Investor Presentation
 
Economy of USA- An Current overview
Economy of USA- An Current overviewEconomy of USA- An Current overview
Economy of USA- An Current overview
 
2005 - 5th Us Analyst And Investor Meeting Financials
2005 - 5th Us Analyst And Investor Meeting   Financials2005 - 5th Us Analyst And Investor Meeting   Financials
2005 - 5th Us Analyst And Investor Meeting Financials
 
oe E. Harlan Executive Vice President, Electro and Communications Business
oe E. Harlan Executive Vice President, Electro and Communications Businessoe E. Harlan Executive Vice President, Electro and Communications Business
oe E. Harlan Executive Vice President, Electro and Communications Business
 
2007 - 7th Analysts And Investors Meeting Results & Performance
2007 - 7th Analysts And Investors Meeting   Results & Performance2007 - 7th Analysts And Investors Meeting   Results & Performance
2007 - 7th Analysts And Investors Meeting Results & Performance
 
2010 City Of Bethlehem Finance And Budget Presentation
2010 City Of Bethlehem Finance And Budget Presentation2010 City Of Bethlehem Finance And Budget Presentation
2010 City Of Bethlehem Finance And Budget Presentation
 
Honeywell Gabelli & Company 12th Annual Aircraft Supplier Symposium Presentation
Honeywell Gabelli & Company 12th Annual Aircraft Supplier Symposium PresentationHoneywell Gabelli & Company 12th Annual Aircraft Supplier Symposium Presentation
Honeywell Gabelli & Company 12th Annual Aircraft Supplier Symposium Presentation
 
ApresentaçãO 4 T07 Eng
ApresentaçãO 4 T07 EngApresentaçãO 4 T07 Eng
ApresentaçãO 4 T07 Eng
 
Slides from Conference Call
Slides from Conference CallSlides from Conference Call
Slides from Conference Call
 
Slides from Conference Call
Slides from Conference CallSlides from Conference Call
Slides from Conference Call
 
Read the Earnings Release
Read the Earnings ReleaseRead the Earnings Release
Read the Earnings Release
 
yahoo 3Q08EarningsPreso
yahoo 3Q08EarningsPresoyahoo 3Q08EarningsPreso
yahoo 3Q08EarningsPreso
 
Understanding the Federal Budget and Implications for Adult Education
Understanding the Federal Budget and Implications for Adult EducationUnderstanding the Federal Budget and Implications for Adult Education
Understanding the Federal Budget and Implications for Adult Education
 
arnings Release 2Q07 Presentation
arnings Release 2Q07 Presentationarnings Release 2Q07 Presentation
arnings Release 2Q07 Presentation
 
Earnings Release 2 Q07
Earnings Release 2 Q07Earnings Release 2 Q07
Earnings Release 2 Q07
 

Mais de Office of Trade Negotiations (OTN), CARICOM Secretariat

Mais de Office of Trade Negotiations (OTN), CARICOM Secretariat (20)

WEF Global Competitiveness Report 2014-15
WEF Global Competitiveness Report 2014-15WEF Global Competitiveness Report 2014-15
WEF Global Competitiveness Report 2014-15
 
2014 Annual Report - World Trade Organization (WTO)
2014 Annual Report - World Trade Organization (WTO)2014 Annual Report - World Trade Organization (WTO)
2014 Annual Report - World Trade Organization (WTO)
 
the Association of Caribbean States (ACS): 1994-2014 - 20 Years Promoting Coo...
the Association of Caribbean States (ACS): 1994-2014 - 20 Years Promoting Coo...the Association of Caribbean States (ACS): 1994-2014 - 20 Years Promoting Coo...
the Association of Caribbean States (ACS): 1994-2014 - 20 Years Promoting Coo...
 
TTIP: The Economic Analysis Explained
TTIP: The Economic Analysis ExplainedTTIP: The Economic Analysis Explained
TTIP: The Economic Analysis Explained
 
2014 National Trade Estimate Report on Foreign Trade Barriers
2014 National Trade Estimate Report on Foreign Trade Barriers2014 National Trade Estimate Report on Foreign Trade Barriers
2014 National Trade Estimate Report on Foreign Trade Barriers
 
OTN - Private Sector Trade Note - Vol 2 2014 - CARICOM-Ghana Trade
OTN - Private Sector Trade Note - Vol 2 2014 - CARICOM-Ghana TradeOTN - Private Sector Trade Note - Vol 2 2014 - CARICOM-Ghana Trade
OTN - Private Sector Trade Note - Vol 2 2014 - CARICOM-Ghana Trade
 
2014-03-03 OTN Special Update (The Focus of the WTO MC9)
2014-03-03 OTN Special Update (The Focus of the WTO MC9)2014-03-03 OTN Special Update (The Focus of the WTO MC9)
2014-03-03 OTN Special Update (The Focus of the WTO MC9)
 
OTN Special Update - Economic and Trade Policies Related to Diet and Obesity ...
OTN Special Update - Economic and Trade Policies Related to Diet and Obesity ...OTN Special Update - Economic and Trade Policies Related to Diet and Obesity ...
OTN Special Update - Economic and Trade Policies Related to Diet and Obesity ...
 
WTO Trade Facilitation Agreement - A Business Guide for Developing Countries ...
WTO Trade Facilitation Agreement - A Business Guide for Developing Countries ...WTO Trade Facilitation Agreement - A Business Guide for Developing Countries ...
WTO Trade Facilitation Agreement - A Business Guide for Developing Countries ...
 
OTN - Private Sector Trade Note - vol 4 2013
OTN - Private Sector Trade Note - vol 4 2013OTN - Private Sector Trade Note - vol 4 2013
OTN - Private Sector Trade Note - vol 4 2013
 
The CARICOM Common External Tariff (CET) – The Tariff Structure
The CARICOM Common External Tariff (CET) – The Tariff StructureThe CARICOM Common External Tariff (CET) – The Tariff Structure
The CARICOM Common External Tariff (CET) – The Tariff Structure
 
Innovation for Economic Performance the Case of Latin American Firms
Innovation for Economic Performance the Case of Latin American FirmsInnovation for Economic Performance the Case of Latin American Firms
Innovation for Economic Performance the Case of Latin American Firms
 
Caribbean Community Regional Aid for Trade Strategy 2013–2015 Caribbean Commu...
Caribbean Community Regional Aid for Trade Strategy 2013–2015 Caribbean Commu...Caribbean Community Regional Aid for Trade Strategy 2013–2015 Caribbean Commu...
Caribbean Community Regional Aid for Trade Strategy 2013–2015 Caribbean Commu...
 
CARIFESTA XI -Travel Guide
CARIFESTA XI -Travel GuideCARIFESTA XI -Travel Guide
CARIFESTA XI -Travel Guide
 
Details of the Post Technical Advisor Investment and Private Sector Office of...
Details of the Post Technical Advisor Investment and Private Sector Office of...Details of the Post Technical Advisor Investment and Private Sector Office of...
Details of the Post Technical Advisor Investment and Private Sector Office of...
 
CARICOM View: 40 years of integration, come celebrate with us
CARICOM View:     40 years of integration, come celebrate with usCARICOM View:     40 years of integration, come celebrate with us
CARICOM View: 40 years of integration, come celebrate with us
 
OTN - Private Sector Trade Note - Vol 3 2013
OTN - Private Sector Trade Note - Vol 3 2013OTN - Private Sector Trade Note - Vol 3 2013
OTN - Private Sector Trade Note - Vol 3 2013
 
Aid for Trade: Case Study - Caribbean Aid for Trade (AfT) and Regional Integr...
Aid for Trade: Case Study - Caribbean Aid for Trade (AfT) and Regional Integr...Aid for Trade: Case Study - Caribbean Aid for Trade (AfT) and Regional Integr...
Aid for Trade: Case Study - Caribbean Aid for Trade (AfT) and Regional Integr...
 
OTN Special Update - Innovation - A New Frontier in Trade Multilateralism [20...
OTN Special Update - Innovation - A New Frontier in Trade Multilateralism [20...OTN Special Update - Innovation - A New Frontier in Trade Multilateralism [20...
OTN Special Update - Innovation - A New Frontier in Trade Multilateralism [20...
 
WTO Report - The Future of Trade: The Challenges of Convergence
WTO Report - The Future of Trade: The Challenges of ConvergenceWTO Report - The Future of Trade: The Challenges of Convergence
WTO Report - The Future of Trade: The Challenges of Convergence
 

The Bahamas - Trade Profile UWI's Shridath Ramphal Centre

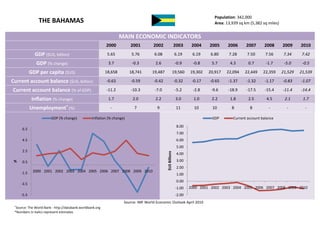
  • 1. Population: 342,000 THE BAHAMAS Area: 13,939 sq km (5,382 sq miles) MAIN ECONOMIC INDICATORS 2000 2001 2002 2003 2004 2005 2006 2007 2008 2009 2010 GDP ($US, billion) 5.65 5.76 6.08 6.19 6.19 6.80 7.28 7.50 7.56 7.34 7.42 GDP (% change) 3.7 -0.3 2.6 -0.9 -0.8 5.7 4.3 0.7 -1.7 -5.0 -0.5 GDP per capita ($US) 18,658 18,741 19,487 19,560 19,302 20,917 22,094 22,449 22,359 21,529 21,539 Current account balance ($US, billion) -0.63 -0.59 -0.42 -0.32 -0.17 -0.65 -1.37 -1.32 -1.17 -0.83 -1.07 Current account balance (% of GDP) -11.2 -10.3 -7.0 -5.2 -2.8 -9.6 -18.9 -17.5 -15.4 -11.4 -14.4 Inflation (% change) 1.7 2.0 2.2 3.0 1.0 2.2 1.8 2.5 4.5 2.1 1.7 Unemployment+ (%) - 7 9 11 10 10 8 8 - - - GDP (% change) Inflation (% change) GDP Current account balance 8.00 6.5 7.00 4.5 6.00 5.00 2.5 $US Billions 4.00 % 0.5 3.00 2.00 -1.5 2000 2001 2002 2003 2004 2005 2006 2007 2008 2009 2010 1.00 0.00 -3.5 -1.00 2000 2001 2002 2003 2004 2005 2006 2007 2008 2009 2010 -5.5 -2.00 Source: IMF World Economic Outlook April 2010 + Source: The World Bank - http://databank.worldbank.org *Numbers in italics represent estimates
  • 2. Population: 342,000 THE BAHAMAS Area: 13,939 sq km (5,382 sq miles) MAIN TRADE INDICATORS – GOODS 2004 2005 2006 2007 2008 Trade Balance ($US thousands) -1,574,828 -2,295,828 -2,474,890 -2,432,625 -2,528,440 Total Exported Value ($US thousands) 401,311 270,849 509,420 669,977 701,529 Total Imported Value ($US thousands) 1,976,139 2,566,677 2,984,310 3,102,602 3,229,969 Top 10 Markets by % of Total Exported Value (2008) Top 10 Markets by % of Total Imported Value (2008) United States of America 70% United States of America 87% Canada 5% Venezuela 5% Germany 4% Netherland Antilles 2% France 4% Trinidad and Tobago 1% Netherlands 3% Japan 1% Nigeria 2% United Kingdom 0.4% Turks & Caicos Islands 2% Canada 0.4% Mexico 1% Switzerland 0.4% United Kingdom 1% France 0.3% Argentina 1% Cuba 0.3% Top 5 Exports by % of Total Exported Value (2008) Salt, sulphur, Works of art, Top 5 Imports by % of Total Imported Value (2008) earth, stone, collectors plaster, lime pieces and Vehicles other Plastics and than railway, and cement, antiques, 4% articles thereof, tramway, 5% Organic 6% 22% chemicals, 11% Electrical, Mineral fuels, electronic Fish, oils, distillation equipment, 5% crustaceans, products, etc, Nuclear molluscs, 26% Mineral fuels, reactors, oils, distillation aquatic boilers, products, etc, invertebrates machinery, etc, 20% nes, 12% 8% Source: International Trade Centre – www.trademap.org
  • 3. Population: 342,000 THE BAHAMAS Area: 13,939 sq km (5,382 sq miles) MAIN TRADE INDICATORS – SERVICES 2004 2005 2006 2007 2008 Trade Balance ($US thousands) 1,012,780 1,224,490 825,210 1,019,730 1,190,625 Total Exported Value ($US thousands) 2,244,080 2,510,900 2,436,080 2,599,350 2,543,322 Total Imported Value ($US thousands) 1,231,300 1,286,410 1,610,870 1,579,620 1,352,697 Top Exports by % of Total Exported Value (2008) Top Imports by % of Total Imported Value (2008) Other business services 33% Travel 85% Transportation 26% Travel 23% Other business services 12% Insurance services 8% Government services 7% Transportation 2% Construction services 2% Royalties and license fees 1% Personal, cultural & recreational services 0.1% Government services 2% Communications services 0.1% Source: International Trade Centre – www.trademap.org