Barbados -Trade Profile UWI's Shridath Ramphal Centre
•
0 gostou•409 visualizações


Recomendados
Recomendados
Mais conteúdo relacionado
Mais procurados
Mais procurados (19)
Semelhante a Barbados -Trade Profile UWI's Shridath Ramphal Centre
Semelhante a Barbados -Trade Profile UWI's Shridath Ramphal Centre (20)
Mais de Office of Trade Negotiations (OTN), CARICOM Secretariat
Mais de Office of Trade Negotiations (OTN), CARICOM Secretariat (20)
Barbados -Trade Profile UWI's Shridath Ramphal Centre
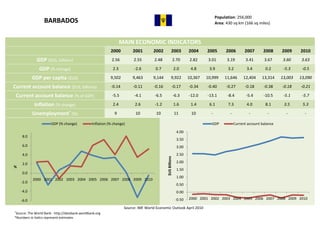
- 1. Population: 256,000 BARBADOS Area: 430 sq km (166 sq miles) MAIN ECONOMIC INDICATORS 2000 2001 2002 2003 2004 2005 2006 2007 2008 2009 2010 GDP ($US, billions) 2.56 2.55 2.48 2.70 2.82 3.01 3.19 3.41 3.67 3.60 3.63 GDP (% change) 2.3 -2.6 0.7 2.0 4.8 3.9 3.2 3.4 0.2 -5.3 -0.5 GDP per capita ($US) 9,502 9,463 9,144 9,922 10,367 10,999 11,646 12,404 13,314 13,003 13,090 Current account balance ($US, billions) -0.14 -0.11 -0.16 -0.17 -0.34 -0.40 -0.27 -0.18 -0.38 -0.18 -0.21 Current account balance (% of GDP) -5.5 -4.1 -6.5 -6.3 -12.0 -13.1 -8.4 -5.4 -10.5 -5.1 -5.7 Inflation (% change) 2.4 2.6 -1.2 1.6 1.4 6.1 7.3 4.0 8.1 3.5 5.3 Unemployment+ (%) 9 10 10 11 10 - - - - - - GDP (% change) Inflation (% change) GDP Current account balance 4.00 8.0 3.50 6.0 3.00 4.0 2.50 $US Billions 2.0 2.00 % 1.50 0.0 1.00 2000 2001 2002 2003 2004 2005 2006 2007 2008 2009 2010 -2.0 0.50 -4.0 0.00 -6.0 -0.50 2000 2001 2002 2003 2004 2005 2006 2007 2008 2009 2010 Source: IMF World Economic Outlook April 2010 + Source: The World Bank - http://databank.worldbank.org *Numbers in italics represent estimates
- 2. Population: 256,000 BARBADOS Area: 430 sq km (166 sq miles) MAIN TRADE INDICATORS – GOODS 2004 2005 2006 2007 2008 Trade Balance ($US, thousands) -898,715 -1,310,622 -1,187,341 -984,427 -1,290,068 Total Exported Value ($US, thousands) 195,039 361,242 441,214 314,230 454,195 Total Imported Value ($US, thousands) 1,093,754 1,671,864 1,628,555 1,298,657 1,744,263 Top 10 Markets by % of Total Exported Value (2008) Top 10 Markets by % of Total Imported Value (2008) United States of America 21% United States of America 37% Trinidad and Tobago 9% Trinidad and Tobago 20% United Kingdom 9% United Kingdom 5% Saint Lucia 5% Japan 4% Jamaica 4% China 4% Netherland Antilles 3% Canada 3% St Vincent & the Grenadines 3% Suriname 3% Guyana 3% Germany 2% Grenada 2% France 2% Antigua and Barbuda 2% New Zealand 1% Clocks Top 5 Exports by % of Total Exported Value (2008) Top 5 Imports by % of Total Imported Value (2008) and Pharmaceutical Sugars and Vehicles other watches products, 4% sugar than railway, and confectionery, tramway, 6% parts, 5% 5% Mineral fuels, oils, distillation Mineral fuels, products, etc, oils, distillation 18% Pharmaceutical Electrical, products, 26% products, 9% electronic equipment, 7% Nuclear Beverages, reactors, spirits and boilers, vinegar, 10% machinery, 9% Source: International Trade Centre – www.trademap.org
- 3. Population: 256,000 BARBADOS Area: 430 sq km (166 sq miles) MAIN TRADE INDICATORS – SERVICES 2003 2004 2005 2006 2007 Trade Balance ($US, thousands) 241,880 224,500 220,800 328,940 383,060 Total Exported Value ($US, thousands) 757,830 775,330 897,240 1,056,770 1,199,090 Total Imported Value ($US, thousands) 515,950 550,830 676,440 727,830 816,030 Top Exports by % of Total Exported Value (2007) Top Imports by % of Total Imported Value (2007) Travel 73% Transportation 31% Other business services 8% Insurance services 28% Insurance services 8% Travel 12% Financial services 5% Other business services 12% Transportation 2% Government services 8% Government services 2% Royalties and license fees 3% Communications services 1% Communications services 2% Construction services 1% Financial services 2% Computer & information services 1% Construction services 2% Personal, cultural & recreational services 0.05% Computer & information services 1% Royalties and license fees 0.02% Personal, cultural & recreational services 0.1% Source: International Trade Centre – www.trademap.org