

Recomendados
Mais conteúdo relacionado
Mais procurados
Mais procurados (10)
Destaque
Semelhante a Cleveland Plus Quarterly Economic Indicators
Semelhante a Cleveland Plus Quarterly Economic Indicators (20)
Mais de Team NEO
Mais de Team NEO (20)
Cleveland Plus Quarterly Economic Indicators
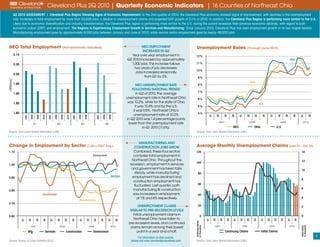
- 1. Cleveland Plus 2Q 2010 | Quarterly Economic Indicators | 16 Counties of Northeast Ohio Q2 2010 Assessment | Cleveland Plus Region showing signs of economic Improvement: In the 2nd quarter of 2010, the Cleveland Plus economy showed signs of improvement, with declines in the unemployment rate, increases in total employment by more than 55,000 jobs, a decline in unemployment claims and projected GRP growth of 3.1% in 2010. In addition, the Cleveland Plus Region is performing more similar to the U.s.: Likely due to economic diversification and industry transformation, the Cleveland Plus region is performing more similar to the U.S. during the current recession than previous economic declines, with regard to both economic output (GRP) and employment. the Regions is experiencing employment Growth in services and manufacturing: Since January 2010, Cleveland Plus has seen employment growth in its two largest sectors. Manufacturing employment grew by approximately 8,000 jobs between January and June of 2010, while service sector employment grew by nearly 48,000 jobs. NEO Total Employment (Not seasonally adjusted) NEO EMPLOYMENT Unemployment Rates (Through June 2010) INCREASES IN Q2 Year over year employment in Q2 2010 increased by approximately Ohio 1,000 jobs. This increase follows two years of job decreases. Jobs increased seasonally from Q1 by 3%. neO NEO UNEMPLOYMENT RATE FOLLOWING NATIONAL TRENDS In Q2 of 2010, the average unemployment rate in Northeast Ohio was 10.2%, while for the state of Ohio U.s. it was 10.4% and for the U.S. it was 9.5%. Northeast Ohio’s unemployment rate of 10.2% in Q2 2010 was 1.4 percentage points lower than the unemployment rate in Q1 2010 (11.6%). neO Ohio U.s. Source: Ohio Labor Market Information (LMI) Source: Ohio Labor Market Information (LMI) MANUFACTURING AND Change in Employment by Sector (1.00 = 2007 Avg.) CONSTRUCTION JOBS GROW Average Monthly Unemployment Claims (Jan 07 - Jun 10) Combined, these four sectors Government comprise total employment in Northeast Ohio. Throughout the recession, employment in services and government has been fairly steady, while manufacturing services employment has declined and construction employment has fluctuated. Last quarter, both manufacturing & construction Construction saw increases in employment, at 1% and 8% respectively. manufacturing UNEMPLOYMENT CLAIMS SIMILAR TO PRE-RECESSION LEVELS Initial unemployment claims in Northeast Ohio have fallen to pre-recession levels, and continued claims remain among their lowest point in a year and a half. For information on data sources, 1 Source: Bureau of Labor Statistics (BLS) please visit www.clevelandplusbusiness.com Source: Ohio Labor Market Information (LMI)
- 2. Cleveland Plus 2Q 2010 | Quarterly Economic Indicators | 16 Counties of Northeast Ohio NEO GRP PROJECTED TO INCREASE Northeast Ohio: Real GRP (in billions) GRP Comparison Recession Northeast Ohio’s Gross Regional Product (GRP) is projected to increase 0.6%(-.7%) 0.5% by 3.1% in 2010, according to 2.4% Moody’s economy.com. Since 1995, (-1.8%) 1.8% GRP has increased at an average 1.2% 0.3% 1.2% 2.6% (-1.9%) 3.1% annual rate of 1.5%. 7.0% 4.8% Difference (-6.4%) GRP TRACKING CLOSER TO U.S. Through 11 quarters of the 1981 2.8% 3.0% Difference recession, NEO’s GRP was 7.0% lower 3.8% than the U.S.; 11 quarters into the 2007 recession, however, Cleveland Plus is only 2.8% lower compared to the national GRP. Northeast Ohio’s more diversified economy, with growth sectors such as biomedical, aerospace-related products, and the cleantech supply Average Annual Growth = 1.5% Real GRP chain is helping the region perform Source: Economy.com more like the U.S. as a whole. Source: Economy.com MANUFACTURING HOURS Average Monthly Manufacturing Hours Worked Northeast Ohio Occupied Industrial Space WORKED NORMALIZING (Jan 07 - May 10) (NEO vs. Ohio) In Q2 2010, manufacturing hours worked averaged 39.4 hours for Northeast Ohio, which showed no overall change from the Northeast Ohio total for Q1 2010 (also 39.4 hours). The state of Ohio averaged 40.4 hours worked in Q2 2010. INDUSTRIAL SPACE REMAINS RELATIVELY STABLE For the third consecutive quarter, occupied industrial space was slightly lower and the industrial vacancy rate was marginally higher in Cleveland Plus, with more than 400 million square feet of space still occupied, and vacancy rates at 8.6%. Source: Bureau of Labor Statistics (BLS) Source: CoStar For information on data sources, please visit www.clevelandplusbusiness.com 2
- 3. Cleveland Plus 2Q 2010 | Quarterly Economic Indicators | 16 Counties of Northeast Ohio Cleveland Plus 16-County Region DATA SOURCES: Team NEO also uses data from federal and state sources as part Team Northeast Ohio uses a number of data sources for the of the report. We rely heavily on data from the U.S. Bureau of Ashtabula Regional Economic Review. One of the primary sources is the Labor Statistics (www.bls.gov) and Ohio’s Labor Market Information Lake Moody’s Economy.com (www.economy.com) Northeast Ohio (www.lmi.state.oh.us) for information on wages, unemployment and Cleveland Geauga modeling system. both general and industry-specific employment. Cuyahoga Lorain Trumbull Moody’s Economy.com county level output, employment and Industrial real estate data for this edition was derived from the CoStar Summit Portage payroll historical data are estimated from several publicly available Group. Due to market limits within the CoStar database, historic trend Medina Akron Youngstown Mahoning sources and are summarized into the Team NEO regional footprint. data for the Team NEO region is defined as 10 of the 16 counties forming It is important to understand data provided by Economy.com are the regional footprint. These counties include Ashtabula, Cuyahoga, Ashland Wayne Canton Columbiana estimates of economic activity. Geauga, Lake, Lorain, Medina, Portage, Richland, Stark and Summit. Richland Stark Carroll 737 Bolivar Road, Suite 2000, Cleveland, Ohio 44115 888.NEO.1411 • www.clevelandplusbusiness.com