SlideShare uma empresa Scribd logo
1 de 2
Baixar para ler offline
Historical Vacancy Rates 
Retail Market Overview 
Salt Lake County 
Overall Market Information 3Q 2014 
Active Retail Tenants 
Market Forecast 
While the market continues to grow exponentially, there are 
still signs of uncertainty. Big and mid-box tenants remain 
hesitant to expand, with the few grocery exceptions that 
continue to attempt to increase market share. 
Most current activity and expansions are a result of aggressive 
acquisitions by QSR’s, fast food and discounters. Tenants like these, 
are driving rising market rates. Class A properties are seeing high 
absorption as demand out paces supply. Indicators suggest this 
trend will remain constant in the Salt Lake County market for the 
foreseeable future. 
Overall vacancy rates across the valley dropped by 1.25 percentage 
points from the last quarter, with these rate improvements being 
fairly consistent in each submarket. Despite a slight 1% decrease 
in average asking rents, they still exceed last year’s averages. 
Notwithstanding marginally sluggish rent gains, the decrease in 
concessions provided has transitioned the market to a more landlord 
friendly climate. 
Expect to see continued growth throughout the remainder of the year. With 
steady economic improvements, consumer and retail developers’ confidence 
will continue to grow in the Utah market. 
16% 
12% 
8% 
4% 
0% OVERALL VACANCY RATE 
TOTAL NEIGHBORHOOD COMMUNITY REGIONAL 
RETAIL 
2009 
9.69% 
2010 
8.58% 
2011 
9.56% 
2013 
9.49% 
3Q-2014 
8.56% 
“MOST CURRENT EXPANSION IS THE RESULT OF AGGRESSIVE 
AQUISITIONS BY QSR’S, FAST FOOD AND DISCOUNTERS.” 
TENANT LOCATION COUNTY 
Container Store Fashion Place Mall Salt Lake 
Nordstrom Rack University Crossing Utah 
PizzaRev Wasatch Front All 
Harmons Traverse Mountain Utah 
Even Stevens Wasatch Front Salt Lake 
Smiths Wasatch Front All 
Malawis Pizza Wasatch Front All 
Corner Bakery Wasatch Front All 
CVS Pharmacy Wasatch Front All 
Average Vacancy Rates 
8.56% 
Average Lease Rates 
$16.26 
Net Absorption 
376K SF 
YTD Under Construction 
313K SF 
ANCHORLESS 
2012 
8.41% 
Under Construction 
CENTER TYPE PROPERTY SIZE SF SUBMARKET 
Neighborhood Sugar House Crossing 52,705 NE 
Anchorless Highland Crossroads 12,000 NE 
Community 
Oquirrh Mtn. Market-place 
100,000 SW 
CURRENT UNDER 
CONSTRUCTION 
BY TYPE 
164,705 SF 
Neighborhood (50,001-100K SF) 
Community (100,001-350K SF) 
Regional (350K SF or greater) 
Anchorless (0-50K SF) 
100,000 9,955 
YTD overall numbers compared to Year-End 2013 
52,705
With vacancy rates continuing to decrease, land is becoming 
a need, after having been dormant for much of the last few 
years. Expect developers to start to purchase retail land in 
ideal locations for the future anticipation of growth by both local and 
national retail tenants. Expansion are also starting to occur more 
frequently by existing retailers in the market as Utah continues to be 
recognized nationally for it’s dynamic economy. According to Mike 
Gorrell of the Salt Lake Tribune, Utahns were more confident than ever 
in recent months in the state of the economy. Zions Bank’s Consumer 
Attitude Index increased 2.5 points from August to September, the 
109.3 reading representing a gain of 16.7 points over the past year. 
Zions Bank President and CEO Scott Anderson attributed Utah’s steadily 
increasing confidence level to a “solid” labor market. The state had an 
August unemployment rate of 3.6 percent (compared to 6.1 percent 
nationally). As we continue to see economic conditions improve the 
retail market will continue to benefit from these positive changes. 
Market Statistics 
Information contained herein, including projections, has been 
obtained from sources believed to be reliable. While we do not 
doubt its accuracy we have not verified it and make no guarantee, 
warranty or representation about it. It is your responsibility to 
confirm independently its accuracy and completeness. Each Office 
Independently Owned and Operated. © 2014. 
6550 South Millrock Drive, Suite 200 
Salt Lake City, UT 84121 | (801) 947.8300 
www.coldwellutah.com 
Follow Us On Twitter 
Salt Lake County Map 
$40 
$30 
$20 
$10 
$0 
PRICE PER SQUARE FEET 
NEIGHBORHOOD COMMUNITY REGIONAL Lease Rates by Property Type 
NE CE SE CW SW 
ANCHORLESS 
NW 
NORTH EAST INVENTORY AVAILABLE SF VACANCY ASKING RATE 
Anchorless 1,170,899 85,274 7.18% $17.68 
Neighborhood 403,332 15,599 3.87% $21.13 
Community 1,519,180 264,499 17.41% $14.01 
Regional 1,202,227 175,938 14.63% $22.68 
TOTAL 3,162,864 541,310 6.48% $21.76 
CENTRAL EAST INVENTORY AVAILABLE SF VACANCY ASKING RATE 
Anchorless 1,272,028 73,384 5.77% $12.95 
Neighborhood 1,419,001 83,514 5.89% $21.13 
Community 2,016,314 133,792 6.56% $14.01 
Regional 1,236,191 100,471 8.13% $22.68 
TOTAL 5,943,534 391,161 6.55% $17.05 
SOUTH EAST INVENTORY AVAILABLE SF VACANCY ASKING RATE 
Anchorless 1,042,871 155,325 14.89% $12.64 
Neighborhood 1,578,921 187,304 11.86% $14.67 
Community 3,580,717 310,685 8.68% $12.57 
Regional 804,319 46,326 5.76% $22.68 
TOTAL 7,006,828 699,640 9.56% $13.80 
NORTH WEST INVENTORY AVAILABLE SF VACANCY ASKING RATE 
Anchorless 340,062 21,813 6.41% $13.20 
Neighborhood 390,726 19,870 5.09% $16.00 
Community 471,357 126,968 26.94% $28.33 
Regional - - - - 
TOTAL 575,972 168,651 9.48% $26.25 
CENTRAL WEST INVENTORY AVAILABLE SF VACANCY ASKING RATE 
Anchorless 976,995 92,650 9.48% $12.95 
Neighborhood 1,096,889 72,946 6.65% $21.13 
Community 3,984,860 462,543 10.20% $10.40 
Regional 813,164 53,213 6.54% $10.28 
TOTAL 6,871,908 681,352 9.10% $11.25 
SOUTH WEST INVENTORY AVAILABLE SF VACANCY ASKING RATE 
Anchorless 999,747 113,735 11.38% $17.62 
Neighborhood 1,386,925 223,625 16.12% $13.65 
Community 2,616,188 127,791 4.88% $20.37 
Regional 4,899,525 154,783 3.16% $25.47 
TOTAL 9,902,385 619,934 6.26% $18.55 
OVERALL INVENTORY AVAILABLE SF VACANCY ASKING RATE 
Anchorless 5,802,602 542,181 9.32% $15.32 
Neighborhood 6,275,794 602,858 9.58% $15.00 
Community 14,188,616 1,426,278 9.45% $14.35 
Regional 8,955,426 530,731 5.93% $24.16 
TOTAL 35,222,438 3,102,048 8.56% $16.26

Mais conteúdo relacionado

Mais procurados

Cotatii indicative titluri de stat 24.10 - 28.10
Cotatii indicative titluri de stat 24.10 - 28.10Cotatii indicative titluri de stat 24.10 - 28.10
Cotatii indicative titluri de stat 24.10 - 28.10PrivateBanker.ro
 
October 2015 Vancouver Real Estate Board Statistics Package Mike Stewart Realtor
October 2015 Vancouver Real Estate Board Statistics Package Mike Stewart RealtorOctober 2015 Vancouver Real Estate Board Statistics Package Mike Stewart Realtor
October 2015 Vancouver Real Estate Board Statistics Package Mike Stewart RealtorMike Stewart
 
September 2015 rebgv statistics package mike stewart
September 2015 rebgv statistics package mike stewartSeptember 2015 rebgv statistics package mike stewart
September 2015 rebgv statistics package mike stewartMike Stewart
 
July 2015 rebgv stats package mike stewart
July 2015 rebgv stats package mike stewartJuly 2015 rebgv stats package mike stewart
July 2015 rebgv stats package mike stewartMike Stewart
 
Annie Williams Real Estate Report - January 2020
Annie Williams Real Estate Report - January 2020Annie Williams Real Estate Report - January 2020
Annie Williams Real Estate Report - January 2020Jon Weaver
 
June 2015 rebgv stats package mike stewart
June 2015 rebgv stats package mike stewartJune 2015 rebgv stats package mike stewart
June 2015 rebgv stats package mike stewartMike Stewart
 
Annie Williams Real Estate Report - November 2021
Annie Williams Real Estate Report - November 2021Annie Williams Real Estate Report - November 2021
Annie Williams Real Estate Report - November 2021Annie Williams
 
January 2016 The Woodlands market report
January 2016 The Woodlands market reportJanuary 2016 The Woodlands market report
January 2016 The Woodlands market reportDebra Wymore
 
VisitEngland Domestic Trends 2020 Report introduced by Paul Flatters, Trajectory
VisitEngland Domestic Trends 2020 Report introduced by Paul Flatters, TrajectoryVisitEngland Domestic Trends 2020 Report introduced by Paul Flatters, Trajectory
VisitEngland Domestic Trends 2020 Report introduced by Paul Flatters, TrajectoryBruce Martin
 
Q1 2017 - Chicago Suburbs Office Reports
Q1 2017 - Chicago Suburbs Office ReportsQ1 2017 - Chicago Suburbs Office Reports
Q1 2017 - Chicago Suburbs Office ReportsHailey Harrington
 
Annie Williams Real Estate Report - August 2019
Annie Williams Real Estate Report - August 2019Annie Williams Real Estate Report - August 2019
Annie Williams Real Estate Report - August 2019Jon Weaver
 
Annie Williams Real Estate Report - Sept 2018
Annie Williams Real Estate Report - Sept 2018Annie Williams Real Estate Report - Sept 2018
Annie Williams Real Estate Report - Sept 2018Jon Weaver
 
Peter gallagher djib fashion highlights
Peter gallagher djib fashion highlightsPeter gallagher djib fashion highlights
Peter gallagher djib fashion highlightsPeter Gallagher
 
April 2016 The Woodlands market report
April 2016 The Woodlands market reportApril 2016 The Woodlands market report
April 2016 The Woodlands market reportDebra Wymore
 
Bond portfolio presentation.
Bond portfolio presentation.Bond portfolio presentation.
Bond portfolio presentation.Sylvia Zhang, CFA
 

Mais procurados (17)

Cotatii indicative titluri de stat 24.10 - 28.10
Cotatii indicative titluri de stat 24.10 - 28.10Cotatii indicative titluri de stat 24.10 - 28.10
Cotatii indicative titluri de stat 24.10 - 28.10
 
October 2015 Vancouver Real Estate Board Statistics Package Mike Stewart Realtor
October 2015 Vancouver Real Estate Board Statistics Package Mike Stewart RealtorOctober 2015 Vancouver Real Estate Board Statistics Package Mike Stewart Realtor
October 2015 Vancouver Real Estate Board Statistics Package Mike Stewart Realtor
 
September 2015 rebgv statistics package mike stewart
September 2015 rebgv statistics package mike stewartSeptember 2015 rebgv statistics package mike stewart
September 2015 rebgv statistics package mike stewart
 
July 2015 rebgv stats package mike stewart
July 2015 rebgv stats package mike stewartJuly 2015 rebgv stats package mike stewart
July 2015 rebgv stats package mike stewart
 
Annie Williams Real Estate Report - January 2020
Annie Williams Real Estate Report - January 2020Annie Williams Real Estate Report - January 2020
Annie Williams Real Estate Report - January 2020
 
June 2015 rebgv stats package mike stewart
June 2015 rebgv stats package mike stewartJune 2015 rebgv stats package mike stewart
June 2015 rebgv stats package mike stewart
 
May 2020 Realtor Report
May 2020 Realtor ReportMay 2020 Realtor Report
May 2020 Realtor Report
 
Annie Williams Real Estate Report - November 2021
Annie Williams Real Estate Report - November 2021Annie Williams Real Estate Report - November 2021
Annie Williams Real Estate Report - November 2021
 
January 2016 The Woodlands market report
January 2016 The Woodlands market reportJanuary 2016 The Woodlands market report
January 2016 The Woodlands market report
 
VisitEngland Domestic Trends 2020 Report introduced by Paul Flatters, Trajectory
VisitEngland Domestic Trends 2020 Report introduced by Paul Flatters, TrajectoryVisitEngland Domestic Trends 2020 Report introduced by Paul Flatters, Trajectory
VisitEngland Domestic Trends 2020 Report introduced by Paul Flatters, Trajectory
 
Q1 2017 - Chicago Suburbs Office Reports
Q1 2017 - Chicago Suburbs Office ReportsQ1 2017 - Chicago Suburbs Office Reports
Q1 2017 - Chicago Suburbs Office Reports
 
August 2018 Realtor Report for Southwest California
August 2018 Realtor Report for Southwest CaliforniaAugust 2018 Realtor Report for Southwest California
August 2018 Realtor Report for Southwest California
 
Annie Williams Real Estate Report - August 2019
Annie Williams Real Estate Report - August 2019Annie Williams Real Estate Report - August 2019
Annie Williams Real Estate Report - August 2019
 
Annie Williams Real Estate Report - Sept 2018
Annie Williams Real Estate Report - Sept 2018Annie Williams Real Estate Report - Sept 2018
Annie Williams Real Estate Report - Sept 2018
 
Peter gallagher djib fashion highlights
Peter gallagher djib fashion highlightsPeter gallagher djib fashion highlights
Peter gallagher djib fashion highlights
 
April 2016 The Woodlands market report
April 2016 The Woodlands market reportApril 2016 The Woodlands market report
April 2016 The Woodlands market report
 
Bond portfolio presentation.
Bond portfolio presentation.Bond portfolio presentation.
Bond portfolio presentation.
 

Semelhante a 2014 Q3 Retail Market Overview

February 2010 Princeton Market Seminar
February 2010 Princeton Market SeminarFebruary 2010 Princeton Market Seminar
February 2010 Princeton Market SeminarWeichert Realtors
 
December 2011 Market Seminar
December 2011 Market SeminarDecember 2011 Market Seminar
December 2011 Market SeminarWeichert Realtors
 
Mary Kealey - Q3 farm check-in
Mary Kealey - Q3 farm check-inMary Kealey - Q3 farm check-in
Mary Kealey - Q3 farm check-in8zmarketing
 
JLL Louisville Office Outlook - Q1 2017
JLL Louisville Office Outlook - Q1 2017JLL Louisville Office Outlook - Q1 2017
JLL Louisville Office Outlook - Q1 2017Ross Bratcher
 
Annie Williams Real Estate Report - November 2019
Annie Williams Real Estate Report - November 2019Annie Williams Real Estate Report - November 2019
Annie Williams Real Estate Report - November 2019Jon Weaver
 
January 2011 Princeton Area Market Update
January 2011 Princeton Area Market UpdateJanuary 2011 Princeton Area Market Update
January 2011 Princeton Area Market UpdateWeichert Realtors
 
2017 Housing Market Forecast - Leslie Appleton Young
2017 Housing Market Forecast - Leslie Appleton Young2017 Housing Market Forecast - Leslie Appleton Young
2017 Housing Market Forecast - Leslie Appleton YoungInman News
 
May 2010 market update presetation
May  2010 market update presetationMay  2010 market update presetation
May 2010 market update presetationWeichert Realtors
 
Vancouver real estate stats package, August 2013
Vancouver real estate stats package, August 2013Vancouver real estate stats package, August 2013
Vancouver real estate stats package, August 2013Matt Collinge
 
Commerce Real Estate Solutions 3rd Qtr 2010 Retail Report
Commerce Real Estate Solutions 3rd Qtr 2010 Retail ReportCommerce Real Estate Solutions 3rd Qtr 2010 Retail Report
Commerce Real Estate Solutions 3rd Qtr 2010 Retail ReportJessica Parrish
 
Annie Williams Real Estate Report-September 2023-9.pdf
Annie Williams Real Estate Report-September 2023-9.pdfAnnie Williams Real Estate Report-September 2023-9.pdf
Annie Williams Real Estate Report-September 2023-9.pdfAnnie Williams
 
Annie Williams Real Estate Report - October 2021
Annie Williams Real Estate Report - October 2021Annie Williams Real Estate Report - October 2021
Annie Williams Real Estate Report - October 2021Annie Williams
 
Annie Williams Real Estate Report Aug-Sept 2016
Annie Williams Real Estate Report Aug-Sept 2016Annie Williams Real Estate Report Aug-Sept 2016
Annie Williams Real Estate Report Aug-Sept 2016Jon Weaver
 
Foreclosures in California
Foreclosures in CaliforniaForeclosures in California
Foreclosures in Californiamartiangrape
 
September 2010 Market Seminar
September 2010 Market SeminarSeptember 2010 Market Seminar
September 2010 Market SeminarLinda Twining
 
Annie Williams Market Trends Sept-Oct 2014
Annie Williams Market Trends Sept-Oct 2014Annie Williams Market Trends Sept-Oct 2014
Annie Williams Market Trends Sept-Oct 2014Jon Weaver
 

Semelhante a 2014 Q3 Retail Market Overview (20)

February 2010 Princeton Market Seminar
February 2010 Princeton Market SeminarFebruary 2010 Princeton Market Seminar
February 2010 Princeton Market Seminar
 
October 2011
October 2011October 2011
October 2011
 
December 2011 Market Seminar
December 2011 Market SeminarDecember 2011 Market Seminar
December 2011 Market Seminar
 
Mary Kealey - Q3 farm check-in
Mary Kealey - Q3 farm check-inMary Kealey - Q3 farm check-in
Mary Kealey - Q3 farm check-in
 
City of Swift Current BRE Economic Systems Analysis
City of Swift Current BRE Economic Systems AnalysisCity of Swift Current BRE Economic Systems Analysis
City of Swift Current BRE Economic Systems Analysis
 
JLL Louisville Office Outlook - Q1 2017
JLL Louisville Office Outlook - Q1 2017JLL Louisville Office Outlook - Q1 2017
JLL Louisville Office Outlook - Q1 2017
 
Annie Williams Real Estate Report - November 2019
Annie Williams Real Estate Report - November 2019Annie Williams Real Estate Report - November 2019
Annie Williams Real Estate Report - November 2019
 
January 2011 Princeton Area Market Update
January 2011 Princeton Area Market UpdateJanuary 2011 Princeton Area Market Update
January 2011 Princeton Area Market Update
 
2017 Housing Market Forecast - Leslie Appleton Young
2017 Housing Market Forecast - Leslie Appleton Young2017 Housing Market Forecast - Leslie Appleton Young
2017 Housing Market Forecast - Leslie Appleton Young
 
May 2010 market update presetation
May  2010 market update presetationMay  2010 market update presetation
May 2010 market update presetation
 
Vancouver real estate stats package, August 2013
Vancouver real estate stats package, August 2013Vancouver real estate stats package, August 2013
Vancouver real estate stats package, August 2013
 
Commerce Real Estate Solutions 3rd Qtr 2010 Retail Report
Commerce Real Estate Solutions 3rd Qtr 2010 Retail ReportCommerce Real Estate Solutions 3rd Qtr 2010 Retail Report
Commerce Real Estate Solutions 3rd Qtr 2010 Retail Report
 
Annie Williams Real Estate Report-September 2023-9.pdf
Annie Williams Real Estate Report-September 2023-9.pdfAnnie Williams Real Estate Report-September 2023-9.pdf
Annie Williams Real Estate Report-September 2023-9.pdf
 
Annie Williams Real Estate Report - October 2021
Annie Williams Real Estate Report - October 2021Annie Williams Real Estate Report - October 2021
Annie Williams Real Estate Report - October 2021
 
Annie Williams Real Estate Report Aug-Sept 2016
Annie Williams Real Estate Report Aug-Sept 2016Annie Williams Real Estate Report Aug-Sept 2016
Annie Williams Real Estate Report Aug-Sept 2016
 
Foreclosures in California
Foreclosures in CaliforniaForeclosures in California
Foreclosures in California
 
September market seminar
September market seminarSeptember market seminar
September market seminar
 
September 2010 Market Seminar
September 2010 Market SeminarSeptember 2010 Market Seminar
September 2010 Market Seminar
 
Annie Williams Market Trends Sept-Oct 2014
Annie Williams Market Trends Sept-Oct 2014Annie Williams Market Trends Sept-Oct 2014
Annie Williams Market Trends Sept-Oct 2014
 
March 2010 market seminar
March 2010 market seminarMarch 2010 market seminar
March 2010 market seminar
 

Último

Indian Call Girl In Dubai #$# O5634O3O18 #$# Dubai Call Girl
Indian Call Girl In Dubai #$# O5634O3O18 #$# Dubai Call GirlIndian Call Girl In Dubai #$# O5634O3O18 #$# Dubai Call Girl
Indian Call Girl In Dubai #$# O5634O3O18 #$# Dubai Call GirlAroojKhan71
 
call Now 9811711561 Cash Payment乂 Call Girls in Dwarka
call Now 9811711561 Cash Payment乂 Call Girls in Dwarkacall Now 9811711561 Cash Payment乂 Call Girls in Dwarka
call Now 9811711561 Cash Payment乂 Call Girls in Dwarkavikas rana
 
Top Rated Pune Call Girls Talegaon Dabhade ⟟ 6297143586 ⟟ Call Me For Genuin...
Top Rated  Pune Call Girls Talegaon Dabhade ⟟ 6297143586 ⟟ Call Me For Genuin...Top Rated  Pune Call Girls Talegaon Dabhade ⟟ 6297143586 ⟟ Call Me For Genuin...
Top Rated Pune Call Girls Talegaon Dabhade ⟟ 6297143586 ⟟ Call Me For Genuin...Call Girls in Nagpur High Profile
 
The 15 Minute Breakdown: 2024 Beauty Marketing Study
The 15 Minute Breakdown: 2024 Beauty Marketing StudyThe 15 Minute Breakdown: 2024 Beauty Marketing Study
The 15 Minute Breakdown: 2024 Beauty Marketing StudyTinuiti
 
Film= Dubai Call Girls O525547819 Call Girls Dubai Whsatapp
Film= Dubai Call Girls O525547819 Call Girls Dubai WhsatappFilm= Dubai Call Girls O525547819 Call Girls Dubai Whsatapp
Film= Dubai Call Girls O525547819 Call Girls Dubai Whsatappkojalkojal131
 
Call Girls In Dev kunj Delhi 9654467111 Short 1500 Night 6000
Call Girls In Dev kunj Delhi 9654467111 Short 1500 Night 6000Call Girls In Dev kunj Delhi 9654467111 Short 1500 Night 6000
Call Girls In Dev kunj Delhi 9654467111 Short 1500 Night 6000Sapana Sha
 
Best VIP Call Girls Noida Sector 51 Call Me: 8448380779
Best VIP Call Girls Noida Sector 51 Call Me: 8448380779Best VIP Call Girls Noida Sector 51 Call Me: 8448380779
Best VIP Call Girls Noida Sector 51 Call Me: 8448380779Delhi Call girls
 
Best VIP Call Girls Noida Sector 50 Call Me: 8448380779
Best VIP Call Girls Noida Sector 50 Call Me: 8448380779Best VIP Call Girls Noida Sector 50 Call Me: 8448380779
Best VIP Call Girls Noida Sector 50 Call Me: 8448380779Delhi Call girls
 
The 15 Minute Breakdown: 2024 Beauty Marketing Study
The 15 Minute Breakdown: 2024 Beauty Marketing StudyThe 15 Minute Breakdown: 2024 Beauty Marketing Study
The 15 Minute Breakdown: 2024 Beauty Marketing StudyKatherineBishop4
 
Best VIP Call Girls Noida Sector 55 Call Me: 8448380779
Best VIP Call Girls Noida Sector 55 Call Me: 8448380779Best VIP Call Girls Noida Sector 55 Call Me: 8448380779
Best VIP Call Girls Noida Sector 55 Call Me: 8448380779Delhi Call girls
 
Dubai Call Girls O525547&19 (Asii) Call Girls Dubai
Dubai Call Girls O525547&19 (Asii) Call Girls DubaiDubai Call Girls O525547&19 (Asii) Call Girls Dubai
Dubai Call Girls O525547&19 (Asii) Call Girls Dubaikojalkojal131
 

Último (11)

Indian Call Girl In Dubai #$# O5634O3O18 #$# Dubai Call Girl
Indian Call Girl In Dubai #$# O5634O3O18 #$# Dubai Call GirlIndian Call Girl In Dubai #$# O5634O3O18 #$# Dubai Call Girl
Indian Call Girl In Dubai #$# O5634O3O18 #$# Dubai Call Girl
 
call Now 9811711561 Cash Payment乂 Call Girls in Dwarka
call Now 9811711561 Cash Payment乂 Call Girls in Dwarkacall Now 9811711561 Cash Payment乂 Call Girls in Dwarka
call Now 9811711561 Cash Payment乂 Call Girls in Dwarka
 
Top Rated Pune Call Girls Talegaon Dabhade ⟟ 6297143586 ⟟ Call Me For Genuin...
Top Rated  Pune Call Girls Talegaon Dabhade ⟟ 6297143586 ⟟ Call Me For Genuin...Top Rated  Pune Call Girls Talegaon Dabhade ⟟ 6297143586 ⟟ Call Me For Genuin...
Top Rated Pune Call Girls Talegaon Dabhade ⟟ 6297143586 ⟟ Call Me For Genuin...
 
The 15 Minute Breakdown: 2024 Beauty Marketing Study
The 15 Minute Breakdown: 2024 Beauty Marketing StudyThe 15 Minute Breakdown: 2024 Beauty Marketing Study
The 15 Minute Breakdown: 2024 Beauty Marketing Study
 
Film= Dubai Call Girls O525547819 Call Girls Dubai Whsatapp
Film= Dubai Call Girls O525547819 Call Girls Dubai WhsatappFilm= Dubai Call Girls O525547819 Call Girls Dubai Whsatapp
Film= Dubai Call Girls O525547819 Call Girls Dubai Whsatapp
 
Call Girls In Dev kunj Delhi 9654467111 Short 1500 Night 6000
Call Girls In Dev kunj Delhi 9654467111 Short 1500 Night 6000Call Girls In Dev kunj Delhi 9654467111 Short 1500 Night 6000
Call Girls In Dev kunj Delhi 9654467111 Short 1500 Night 6000
 
Best VIP Call Girls Noida Sector 51 Call Me: 8448380779
Best VIP Call Girls Noida Sector 51 Call Me: 8448380779Best VIP Call Girls Noida Sector 51 Call Me: 8448380779
Best VIP Call Girls Noida Sector 51 Call Me: 8448380779
 
Best VIP Call Girls Noida Sector 50 Call Me: 8448380779
Best VIP Call Girls Noida Sector 50 Call Me: 8448380779Best VIP Call Girls Noida Sector 50 Call Me: 8448380779
Best VIP Call Girls Noida Sector 50 Call Me: 8448380779
 
The 15 Minute Breakdown: 2024 Beauty Marketing Study
The 15 Minute Breakdown: 2024 Beauty Marketing StudyThe 15 Minute Breakdown: 2024 Beauty Marketing Study
The 15 Minute Breakdown: 2024 Beauty Marketing Study
 
Best VIP Call Girls Noida Sector 55 Call Me: 8448380779
Best VIP Call Girls Noida Sector 55 Call Me: 8448380779Best VIP Call Girls Noida Sector 55 Call Me: 8448380779
Best VIP Call Girls Noida Sector 55 Call Me: 8448380779
 
Dubai Call Girls O525547&19 (Asii) Call Girls Dubai
Dubai Call Girls O525547&19 (Asii) Call Girls DubaiDubai Call Girls O525547&19 (Asii) Call Girls Dubai
Dubai Call Girls O525547&19 (Asii) Call Girls Dubai
 

2014 Q3 Retail Market Overview

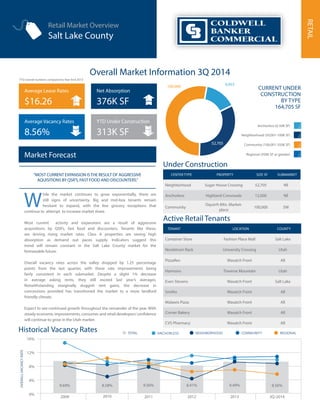
  • 1. Historical Vacancy Rates Retail Market Overview Salt Lake County Overall Market Information 3Q 2014 Active Retail Tenants Market Forecast While the market continues to grow exponentially, there are still signs of uncertainty. Big and mid-box tenants remain hesitant to expand, with the few grocery exceptions that continue to attempt to increase market share. Most current activity and expansions are a result of aggressive acquisitions by QSR’s, fast food and discounters. Tenants like these, are driving rising market rates. Class A properties are seeing high absorption as demand out paces supply. Indicators suggest this trend will remain constant in the Salt Lake County market for the foreseeable future. Overall vacancy rates across the valley dropped by 1.25 percentage points from the last quarter, with these rate improvements being fairly consistent in each submarket. Despite a slight 1% decrease in average asking rents, they still exceed last year’s averages. Notwithstanding marginally sluggish rent gains, the decrease in concessions provided has transitioned the market to a more landlord friendly climate. Expect to see continued growth throughout the remainder of the year. With steady economic improvements, consumer and retail developers’ confidence will continue to grow in the Utah market. 16% 12% 8% 4% 0% OVERALL VACANCY RATE TOTAL NEIGHBORHOOD COMMUNITY REGIONAL RETAIL 2009 9.69% 2010 8.58% 2011 9.56% 2013 9.49% 3Q-2014 8.56% “MOST CURRENT EXPANSION IS THE RESULT OF AGGRESSIVE AQUISITIONS BY QSR’S, FAST FOOD AND DISCOUNTERS.” TENANT LOCATION COUNTY Container Store Fashion Place Mall Salt Lake Nordstrom Rack University Crossing Utah PizzaRev Wasatch Front All Harmons Traverse Mountain Utah Even Stevens Wasatch Front Salt Lake Smiths Wasatch Front All Malawis Pizza Wasatch Front All Corner Bakery Wasatch Front All CVS Pharmacy Wasatch Front All Average Vacancy Rates 8.56% Average Lease Rates $16.26 Net Absorption 376K SF YTD Under Construction 313K SF ANCHORLESS 2012 8.41% Under Construction CENTER TYPE PROPERTY SIZE SF SUBMARKET Neighborhood Sugar House Crossing 52,705 NE Anchorless Highland Crossroads 12,000 NE Community Oquirrh Mtn. Market-place 100,000 SW CURRENT UNDER CONSTRUCTION BY TYPE 164,705 SF Neighborhood (50,001-100K SF) Community (100,001-350K SF) Regional (350K SF or greater) Anchorless (0-50K SF) 100,000 9,955 YTD overall numbers compared to Year-End 2013 52,705
  • 2. With vacancy rates continuing to decrease, land is becoming a need, after having been dormant for much of the last few years. Expect developers to start to purchase retail land in ideal locations for the future anticipation of growth by both local and national retail tenants. Expansion are also starting to occur more frequently by existing retailers in the market as Utah continues to be recognized nationally for it’s dynamic economy. According to Mike Gorrell of the Salt Lake Tribune, Utahns were more confident than ever in recent months in the state of the economy. Zions Bank’s Consumer Attitude Index increased 2.5 points from August to September, the 109.3 reading representing a gain of 16.7 points over the past year. Zions Bank President and CEO Scott Anderson attributed Utah’s steadily increasing confidence level to a “solid” labor market. The state had an August unemployment rate of 3.6 percent (compared to 6.1 percent nationally). As we continue to see economic conditions improve the retail market will continue to benefit from these positive changes. Market Statistics Information contained herein, including projections, has been obtained from sources believed to be reliable. While we do not doubt its accuracy we have not verified it and make no guarantee, warranty or representation about it. It is your responsibility to confirm independently its accuracy and completeness. Each Office Independently Owned and Operated. © 2014. 6550 South Millrock Drive, Suite 200 Salt Lake City, UT 84121 | (801) 947.8300 www.coldwellutah.com Follow Us On Twitter Salt Lake County Map $40 $30 $20 $10 $0 PRICE PER SQUARE FEET NEIGHBORHOOD COMMUNITY REGIONAL Lease Rates by Property Type NE CE SE CW SW ANCHORLESS NW NORTH EAST INVENTORY AVAILABLE SF VACANCY ASKING RATE Anchorless 1,170,899 85,274 7.18% $17.68 Neighborhood 403,332 15,599 3.87% $21.13 Community 1,519,180 264,499 17.41% $14.01 Regional 1,202,227 175,938 14.63% $22.68 TOTAL 3,162,864 541,310 6.48% $21.76 CENTRAL EAST INVENTORY AVAILABLE SF VACANCY ASKING RATE Anchorless 1,272,028 73,384 5.77% $12.95 Neighborhood 1,419,001 83,514 5.89% $21.13 Community 2,016,314 133,792 6.56% $14.01 Regional 1,236,191 100,471 8.13% $22.68 TOTAL 5,943,534 391,161 6.55% $17.05 SOUTH EAST INVENTORY AVAILABLE SF VACANCY ASKING RATE Anchorless 1,042,871 155,325 14.89% $12.64 Neighborhood 1,578,921 187,304 11.86% $14.67 Community 3,580,717 310,685 8.68% $12.57 Regional 804,319 46,326 5.76% $22.68 TOTAL 7,006,828 699,640 9.56% $13.80 NORTH WEST INVENTORY AVAILABLE SF VACANCY ASKING RATE Anchorless 340,062 21,813 6.41% $13.20 Neighborhood 390,726 19,870 5.09% $16.00 Community 471,357 126,968 26.94% $28.33 Regional - - - - TOTAL 575,972 168,651 9.48% $26.25 CENTRAL WEST INVENTORY AVAILABLE SF VACANCY ASKING RATE Anchorless 976,995 92,650 9.48% $12.95 Neighborhood 1,096,889 72,946 6.65% $21.13 Community 3,984,860 462,543 10.20% $10.40 Regional 813,164 53,213 6.54% $10.28 TOTAL 6,871,908 681,352 9.10% $11.25 SOUTH WEST INVENTORY AVAILABLE SF VACANCY ASKING RATE Anchorless 999,747 113,735 11.38% $17.62 Neighborhood 1,386,925 223,625 16.12% $13.65 Community 2,616,188 127,791 4.88% $20.37 Regional 4,899,525 154,783 3.16% $25.47 TOTAL 9,902,385 619,934 6.26% $18.55 OVERALL INVENTORY AVAILABLE SF VACANCY ASKING RATE Anchorless 5,802,602 542,181 9.32% $15.32 Neighborhood 6,275,794 602,858 9.58% $15.00 Community 14,188,616 1,426,278 9.45% $14.35 Regional 8,955,426 530,731 5.93% $24.16 TOTAL 35,222,438 3,102,048 8.56% $16.26