SEO & PPC Strategy for UnBranded Search - BESegal Web Analytics

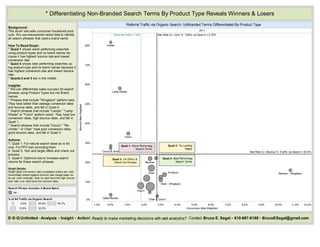
Background: This ecom site sells consumer household products. We use sessionized visitor data. How To Read Graph: * Quad 1 shows worst performing searches using product-types and no brand names because it has highest bounce rate and lowest conversion rate. * Quad 4 shows best performing searches using product-type and no brand names because it has highest conversion rate and lowest bounce rate. * Quads 2 and 3 are in the middle. Insights: * We can differentiate sales success for search phrases using Product Types but not Brand names. * Phrases that include "Wingback" perform best. They have better than average conversion rates and bounce rates, and fall in Quad 4. * Search phrases that include "Lamps," "Lamp Shade" or "Futon" perform worst. They have low conversion rates, high bounce rates, and fall in Quad 1. * Search phrases that include "Couch," "Reclinder," or Chair" have poor conversion rates, good bounce rates, and fall in Quad 3. Actions: 1. Quad 1: For natural search leave as is for now. For PPC test excluding them. 2. Quad 3: Test and target offers and check out process. 3. Quad 4: Optimize site to increase search volume for these search phrases. Graph Details: Graph plots conversion rate (completed orders per visit) horizontally bottom against bounce rate (single page visits per visit) vertically. Dots on right have the high conversion rate. Low dots have low bounce rates.