
Recomendados
Mais conteúdo relacionado
Semelhante a Visualizing data
Semelhante a Visualizing data (20)
Último
Último (20)
Visualizing data
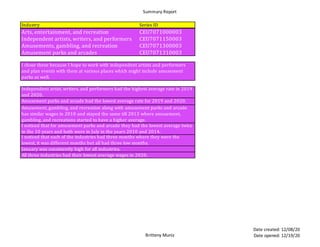
- 1. Summary Report Britteny Muniz Date created: 12/08/20 Date opened: 12/19/20 Industry Series ID Arts, entertainment, and recreation CEU7071000003 Independent artists, writers, and performers CEU7071150003 Amusements, gambling, and recreation CEU7071300003 Amusement parks and arcades CEU7071310003 Amusement parks and arcade had the lowest average rate for 2019 and 2020. January was consistently high for all industries. All three industries had their lowest average wages in 2020. I chose these because I hope to work with independent artists and performers and plan events with them at various places which might include amusement parks as well. Independent artist, writers, and performers had the highest average rate in 2019 and 2020. Amusement, gambling, and recreation along with amusement parks and arcade has similar wages in 2010 and stayed the same till 2013 where amusement, gambling, and recreations started to have a higher average. I noticed that for amusement parks and arcade they had the lowest average twice in the 10 years and both were in July in the years 2010 and 2014. I noticed that each of the industries had three months where they were the lowest, it was different months but all had three low months.
- 2. Pivot Tables Britteny Muniz Date created: 12/19/20 Date opened: 12/19/20 Row Labels Average of Arts, entertainment, and recreation Average of Independent artists, writers, and performers Average of Amusements, gambling, and recreation Jan $21.03 $33.86 $17.38 Feb $21.02 $33.68 $17.40 Mar $20.80 $33.23 $17.26 Apr $21.02 $33.10 $17.36 May $20.52 $32.77 $17.02 Jun $19.20 $32.92 $15.91 Jul $18.84 $33.36 $15.62 Aug $19.17 $33.44 $15.88 Sep $20.60 $34.02 $16.98 Oct $20.58 $33.20 $16.92 Nov $21.03 $33.72 $17.31 Dec $21.22 $33.56 $17.50 Grand Total $20.41 $33.40 $16.87 Row Labels Average of Arts, entertainment, and recreation Average of Independent artists, writers, and performers Average of Amusements, gambling, and recreation 2010 $18.29 $33.09 $15.22 2011 $18.87 $33.95 $15.57 2012 $19.13 $30.82 $15.95 2013 $18.97 $28.41 $15.85 2014 $19.52 $28.78 $15.94 2015 $19.88 $31.21 $16.29 2016 $20.62 $30.18 $17.09 2017 $21.57 $33.89 $17.66 2018 $21.97 $36.29 $18.03 2019 $22.72 $39.70 $18.83 2020 $23.78 $43.66 $19.92 Grand Total $20.41 $33.40 $16.87
- 3. Main Data Britteny Muniz Date created: 12/19/20 Date opened: 12/19/20 Year Month Arts, entertainment, and recreation Independent artists, writers, and performers Amusements, gambling, and recreation Amusement parks and arcades 2010 Jan $19.13 $33.96 $15.83 $14.02 2010 Feb $19.15 $33.48 $15.90 $13.92 2010 Mar $18.94 $33.57 $15.77 $13.52 2010 Apr $18.45 $33.52 $15.42 $12.19 2010 May $18.16 $32.90 $15.20 $11.64 2010 Jun $17.03 $32.53 $14.22 $10.10 2010 Jul $16.57 $32.26 $13.88 $9.73 2010 Aug $16.95 $32.17 $14.11 $10.04 2010 Sep $18.14 $32.32 $15.04 $11.71 2010 Oct $18.66 $32.72 $15.44 $12.44 2010 Nov $19.02 $33.60 $15.82 $13.49 2010 Dec $19.29 $34.01 $15.96 $12.62 2011 Jan $19.40 $34.29 $15.96 $13.40 2011 Feb $19.47 $34.28 $16.00 $13.49 2011 Mar $19.12 $33.58 $15.89 $13.25 2011 Apr $18.87 $32.97 $15.64 $12.56 2011 May $18.84 $33.18 $15.43 $12.05 2011 Jun $17.49 $32.59 $14.48 $10.35 2011 Jul $17.13 $32.46 $14.26 $10.01 2011 Aug $17.39 $33.33 $14.55 $11.18 2011 Sep $18.80 $34.20 $15.62 $14.02 2011 Oct $19.47 $36.58 $15.86 $13.80 2011 Nov $20.15 $35.43 $16.57 $16.84 2011 Dec $20.32 $34.50 $16.61 $15.51 2012 Jan $20.19 $33.92 $16.62 $16.03 2012 Feb $20.15 $32.63 $16.72 $16.25 2012 Mar $19.78 $32.08 $16.40 $14.75 2012 Apr $19.44 $31.66 $16.20 $14.25 2012 May $18.85 $31.01 $15.95 $13.46 2012 Jun $17.75 $30.44 $14.92 $11.52 2012 Jul $17.65 $31.35 $14.71 $11.24 2012 Aug $17.81 $29.91 $14.80 $11.35 2012 Sep $19.13 $29.89 $15.95 $14.17 2012 Oct $19.27 $28.90 $16.05 $14.41 2012 Nov $19.76 $28.99 $16.53 $16.58 2012 Dec $19.78 $29.11 $16.50 $15.73 2013 Jan $19.69 $29.29 $16.49 $15.78 2013 Feb $19.62 $29.33 $16.44 $15.55 2013 Mar $19.33 $28.86 $16.18 $14.12 2013 Apr $19.24 $28.70 $16.13 $13.82 2013 May $18.81 $28.54 $15.79 $13.16 2013 Jun $17.75 $28.91 $14.87 $11.37 2013 Jul $17.49 $28.90 $14.65 $10.94 2013 Aug $17.77 $28.57 $14.87 $11.24 2013 Sep $19.12 $27.33 $15.86 $13.29 2013 Oct $19.13 $27.16 $16.01 $13.55 2013 Nov $19.69 $27.62 $16.37 $14.40 2013 Dec $19.97 $27.68 $16.59 $14.84 2014 Jan $19.94 $28.51 $16.45 $14.30 2014 Feb $20.06 $28.47 $16.41 $14.37 2014 Mar $19.66 $28.23 $16.14 $12.94 2014 Apr $19.65 $28.19 $16.01 $12.73 2014 May $19.23 $28.12 $15.77 $11.70 2014 Jun $18.40 $28.41 $15.01 $10.21 2014 Jul $18.03 $28.13 $14.75 $9.97 2014 Aug $18.25 $28.66 $14.94 $10.42 2014 Sep $19.74 $28.80 $16.04 $13.18 2014 Oct $20.12 $29.41 $16.31 $13.57 2014 Nov $20.62 $30.53 $16.67 $14.25 2014 Dec $20.54 $29.91 $16.73 $14.26 2015 Jan $20.62 $30.97 $16.85 $15.38 2015 Feb $20.69 $31.78 $16.81 $15.23 2015 Mar $20.21 $30.88 $16.58 $13.56 2015 Apr $20.25 $31.39 $16.44 $13.58 2015 May $19.78 $31.48 $16.07 $12.55
- 4. Main Data Britteny Muniz Date created: 12/19/20 Date opened: 12/19/20 Year Month Arts, entertainment, and recreation Independent artists, writers, and performers Amusements, gambling, and recreation Amusement parks and arcades 2015 Jun $18.66 $31.08 $15.24 $11.73 2015 Jul $18.28 $30.57 $15.07 $11.29 2015 Aug $18.69 $31.31 $15.36 $11.55 2015 Sep $19.79 $30.95 $16.34 $13.49 2015 Oct $20.19 $31.10 $16.55 $13.54 2015 Nov $20.59 $31.62 $16.89 $14.45 2015 Dec $20.80 $31.43 $17.22 $14.77 2016 Jan $20.95 $31.10 $17.37 $15.83 2016 Feb $20.88 $30.67 $17.44 $15.92 2016 Mar $20.62 $30.06 $17.33 $15.03 2016 Apr $20.74 $29.98 $17.31 $14.75 2016 May $20.40 $29.56 $16.94 $13.72 2016 Jun $19.34 $29.68 $16.02 $12.31 2016 Jul $19.04 $28.83 $15.83 $11.73 2016 Aug $19.42 $29.34 $16.15 $12.27 2016 Sep $20.98 $29.96 $17.27 $14.24 2016 Oct $21.38 $30.86 $17.57 $14.60 2016 Nov $21.73 $31.31 $17.78 $15.49 2016 Dec $21.95 $30.86 $18.12 $15.77 2017 Jan $22.23 $31.71 $18.32 $16.42 2017 Feb $22.11 $31.41 $18.25 $16.46 2017 Mar $22.12 $31.03 $18.29 $15.76 2017 Apr $22.12 $31.96 $18.03 $15.29 2017 May $21.69 $31.87 $17.67 $14.22 2017 Jun $20.18 $32.38 $16.55 $12.47 2017 Jul $19.89 $33.67 $16.32 $11.99 2017 Aug $20.15 $34.36 $16.50 $12.42 2017 Sep $21.91 $35.62 $17.71 $14.81 2017 Oct $21.81 $36.22 $17.77 $15.00 2017 Nov $22.21 $38.51 $18.12 $16.10 2017 Dec $22.43 $37.96 $18.34 $16.22 2018 Jan $22.55 $38.69 $18.46 $16.71 2018 Feb $22.29 $36.94 $18.40 $17.06 2018 Mar $22.28 $36.94 $18.30 $16.45 2018 Apr $22.48 $34.99 $18.30 $15.99 2018 May $21.66 $34.87 $17.88 $15.38 2018 Jun $20.43 $35.36 $16.81 $13.24 2018 Jul $20.27 $35.13 $16.64 $12.90 2018 Aug $20.64 $34.81 $16.97 $13.31 2018 Sep $22.36 $36.76 $18.29 $16.13 2018 Oct $22.58 $36.45 $18.47 $17.22 2018 Nov $22.91 $36.88 $18.76 $17.85 2018 Dec $23.24 $37.69 $19.02 $17.74 2019 Jan $23.02 $37.62 $19.12 $18.06 2019 Feb $23.14 $38.27 $19.29 $18.28 2019 Mar $23.04 $38.03 $19.20 $17.83 2019 Apr $23.22 $38.44 $19.10 $17.40 2019 May $22.86 $37.71 $18.86 $16.34 2019 Jun $21.56 $38.24 $17.73 $13.52 2019 Jul $21.06 $39.40 $17.38 $13.22 2019 Aug $21.25 $38.72 $17.66 $14.02 2019 Sep $22.87 $42.21 $18.92 $17.17 2019 Oct $23.16 $42.57 $19.13 $17.55 2019 Nov $23.62 $42.74 $19.61 $18.63 2019 Dec $23.88 $42.49 $19.91 $19.18 2020 Jan $23.56 $42.41 $19.69 $18.19 2020 Feb $23.67 $43.19 $19.77 $18.20 2020 Mar $23.70 $42.32 $19.77 $18.21 2020 Apr $26.79 $42.25 $22.38 $21.28 2020 May $25.48 $41.20 $21.65 $20.84 2020 Jun $22.61 $42.54 $19.11 $15.20 2020 Jul $21.83 $46.23 $18.37 $14.20 2020 Aug $22.59 $46.66 $18.81 $15.16 2020 Sep $23.81 $46.15 $19.70 $17.48