Robert Wade Lecture 'Inequality and the West' - 16 July 2013
•Transferir como PPT, PDF•
1 gostou•2,557 visualizações

Inequality and the West: Capitalism at a Tipping Point Political economist Robert Wade talks about rising inequalities in the Western world, placing New Zealand in the context of international debates. He is a contributor to Inequality: A New Zealand Crisis.

Recomendados
Recomendados
Mais conteúdo relacionado
Mais procurados
Mais procurados (19)
Destaque
Semelhante a Robert Wade Lecture 'Inequality and the West' - 16 July 2013
Semelhante a Robert Wade Lecture 'Inequality and the West' - 16 July 2013 (20)
Último
Último (13)
Robert Wade Lecture 'Inequality and the West' - 16 July 2013
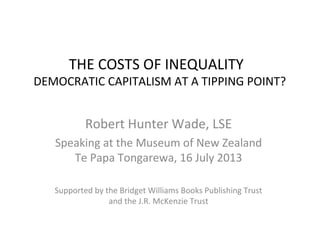
- 1. THE COSTS OF INEQUALITY DEMOCRATIC CAPITALISM AT A TIPPING POINT? Robert Hunter Wade, LSE Speaking at the Museum of New Zealand Te Papa Tongarewa, 16 July 2013 Supported by the Bridget Williams Books Publishing Trust and the J.R. McKenzie Trust
- 2. Trends in income inequality • Income inequality can be measured in several ways, which give substantially different results • Trends depend on which measures we choose. • Income concentration: share of top 1% in national income, & size of income gap b/w top 1% & others (eg median), are important measures especially for assessing political effects of inequality
- 3. Adapted from Bryan Perry, Household Incomes in NZ, Ministry of Social Development, 2012, p218 NZ trends
- 4. NZ income concentration • In 25 years from mid 80s to 2010, average (inflation- adjusted) income of top 1% doubled, from $150,000 to $300,000. These figures exclude capital gains & income held in trusts (so in reality higher); they are pre-tax. • Average (post-tax) income of middle decile and bottom decile remained almost stagnant throughout. • Income gap b/w top 1% & middle decile roughly doubled, from about $125,000 to $270,000. • Rogernomics?
- 5. Source: Derived from figures in the World Top Incomes Database, for New Zealand, 1921–2009, http://topincomes.gmond.parisschoolofeconomics.eu
- 6. NZ income concentration • In 25 years from mid 1980s to 2010 (pre-tax) income share of top 1% increased from about 5% to about 9% of national income. • 9% is much less than in US; but more than in NW Europe. • Top 1%’s rise from 5% to 9% means that everyone else now shares 91% of national income rather than 95% as before.
- 7. Scandinavia • Scandinavia -- also Germany, other NW European countries – show that rising (post- tax) income concentration since 1980s is not an “inevitability” of immutable forces of globalization, skill-biased technological change, etc. • They show that it is possible for a modern capitalist economy to be very prosperous with income concentration < US, UK, NZ et al.
- 8. Surge in income concentration is global • Surprisingly, rich are almost everywhere getting richer compared to everyone else, during post-2008 Second Great Depression. • # of HNWIs (High Net Worth Individuals, people with more than $1 million to invest) increased by > 9% in 2012 over 2011, to 12 million people; their wealth increased by 10% over previous year. • Within this rich group the super-rich (> $30mn, 111,000 people) doing best of all.
- 9. Inequality -- little political salience even as surged. Why? • Conservatives, social democrats, mainstream economists – focus on poverty, exclusion, failing families, gender, etc.; & distribution of “opportunities” (cf “incomes”) • Most accept mainstream economics argument: income inequality necessary for dynamic capitalism, necessary to generate resources to re-distribute to poor. Rogernomics.
- 10. Tony Blair, 2001 • “If you end up going after those people who are the most wealthy in society, what you actually end up doing is in fact not even helping those at the bottom end”.
- 11. Obama 2010 • “I, like most of the American people, don’t begrudge people’s success or wealth. That is part of the free-market system” (2010). • He was defending $17 million bonus awarded in 2009 to JPM CEO Dimon & $9 million to GS CEO Blankfein. J.Goldman & I.Katz, 2010, “Obama doesn’t ‘begrudge’ bonuses for Blankfein, Dimon”, Bloomberg News, July 10.
- 12. Center-left tactical choice • Even leaders of center-left parties who DO worry about inequality (not just poverty etc) make TACTICAL choice not to talk about inequality, especially not INCOME CONCENTRATION at the top. • Why? (1) Depend on Big Donors for party and individual finance; (2) middle-class electorate uncomfortable with talk of “redistribution”.
- 13. Mainstream economists • “Poverty bothers me. Inequality does not. I just don’t care [what anyone else gets]” (Willem Buiter, ex-professor of economics, LSE, now chief economist, CitiGroup) • Econ inequality (a) inevitable, (b) necessary for incentives. • World Bank has said almost nothing about inequality of income in past 20 years (as distinct from “poverty”)
- 14. What determines success in economics profession? • D. Colander, “The making of an economist redux”, J. Econ Perspectives 19 (1), 2005 • 231 grad students of econ, 7 top-ranked Econ Depts, early 2000s • “v impt”, “moderate impt”, “unimpt”, “don’t know” • “having a thorough knowledge of the economy”: “v impt” – 9%, “unimpt” – 51% • “V impt”: 1st & 2nd yr: 15%. 4th & 5th yr: < 1%
- 15. Summary: “inequality” invisible, as surged • focus has been on: poverty, exclusion, etc.; inequality of opportunities (not income) • to extent that inequality of income treated as “problem”, framed as: does X deserve his $9 million bonus? • This avoids focussing on society-wide effects
- 16. However, recent signs of change • 2012, Min Zhu, deputy MD IMF: “The increase in inequality is the most serious challenge for the world”. • I would not quite that far!
- 17. Costs of inequality (dev’ed c’ies) • (1) economic; • (2)social & health; • (3) political
- 18. (1) Inequality & economic performance • Q: Are more unequal economies more prosperous? Q: US is more unequal than NW Europe. Does it have better economic performance? • Yes, by GDP per person (#2 in OECD after Luxembourg, 2005; NZ = #21) • No, by GDP per hour worked (#8 after France, Norway, Netherlands, etc.; about equal to Germany; NZ = #22)
- 19. Long-run economic performance: inequality & heights • Average height can be used as non-income measure of long-run economic performance • Height depends on nutrition in youth, wh depends on household income, etc. • Q: Do more unequal countries have higher average heights?
- 20. Econ performance: inequality & crisis • Rising income inequality one of the causes of the financial crises of 1929 and 2007-8. • As inequality increased, incomes of middle & lower stagnated or fell; the wealthy lent their savings; govt increased credit available to middle & lower. • Plautus, 3rd century BC: “I am a rich man, as long as I do not have to repay my creditors”. • Housing & stock market bubbles
- 21. Hyper-financialization over 2000s • Financial transactions/world GDP: 1997 = 15; 2012 = almost 70 • Of 50 biggest firms in world by revenues, 49 are financial (2010).
- 22. (2) Inequality & social & health costs • Wilkinson & Pickett, The Spirit Level: Why More Equal Societies Almost Always Do Better (2009) • Core argument: More unequal (developed) countries and US states have higher average levels of social & health problems than less unequal countries and US states • Average levels of social & health problems NOT closely linked to GDP per person
- 23. Conclusion about social & health costs • Wilkinson & Pickett: “If you want to live the American dream, go to Denmark.”
- 24. (3) Inequality & political costs • Political costs of high inequality have received very little attention . • Argument: As income concentration increases, the political & business elites tend to transform themselves from “establishment” elites to “oligarchic” or “plutocratic” elites. • In countries with “oligarchic” elite, economic policy is made “by the top 1%, for the top 1%”.
- 25. US: economic policy “by 1%, for 1%” • Research by Martin Gilens shows that US national politicians respond mainly to wealthiest voters (not to median voter). “Inequality and democratic responsiveness”, Public Opinion Quarterly, 69, 5, 2005, 778-96.
- 26. US: preferences -- policy • “When Americans with different income levels differ in their policy preferences, actual policy outcomes strongly reflect the preferences of the most affluent but bear virtually no relationship to the prefcs of poor or middle-class Americans. The vast discrepancy … in govt responsiveness to citizens with different income levels stands in sharp contrast to the ideal of political equality that Americans hold dear….representational biases of this magnitude call into question the very democratic character of our society” (778)
- 27. US: economic policy “by 1%, for 1%” • Polling evidence for US shows that large majority of US “wealthy” agree: (1) top priority is to cut budget deficit, not raise employment; (2) deficit must be reduced by cutting public spending on health care & Social Security; (3) minimum wage must not be linked to cost of living. • Public at large has opposite preferences. • US economic policy reflects preferences of “wealthy”.
- 28. Inequality & economic policy • Why do elites in high-inequality developed countries tend to behave like oligarchies, making laws & policies in own interest? • It is more complicated than economists’ “everyone acts selfishly”. • Psychologists have found “money-empathy gap”. In more unequal societies, those living high on socioeconomic ladder tend to be more selfish, less empathetic, less moral; tend to see most others as aids or obstacles to their ambitions.
- 29. Money-empathy gap • Paul Piff (Berkeley): “The rich are way more likely to prioritize their own self-interests above the interests of other people”. • The rich develop social stereotypes, or prejudices about “the poor” which blame the poor for their poverty & unemployment. • Conservative political ideology tends to justify these prejudices.
- 30. Effects of money-empathy gap • To understand fallacies of conservative ideology, suppose that 100 dogs are ushered into a room in which 95 bones are hidden. • 5 dogs come out without a bone. • Compassionate conservatives say: these 5 dogs need to be sent to bone-hunting school, etc. • Normal conservatives say: the 5 dogs are lazy, cut their income support, force them to hunt harder, “get on your bike”.
- 31. US normal conservative money- empathy gap • Chair of House Budget Committee, 2013: • US national character is being sapped by social programs. • Social programs “turn the safety net into a hammock that lulls able-bodied people to lives of dependency & complacency”
- 32. NZ normal conservative money- empathy gap • NBR, 2011: “Prime Minister John Key today stood by his comment that some people needed to use foodbanks because they had made poor choices.” • “’Anyone on a benefit actually has a lifestyle choice. If one budgets properly, one can pay one's bills’, Mr Key said”. Source: National Business Review, 21 February 2011 http://www.nbr.co.nz/article/key-stands-some-poor-make-poor-choices-foodbank-comment-nn-86501
- 33. Why are rich so influential in economic policy? • Because political parties, political candidates have become so dependent on a wealthy minority (investors, speculators, lenders, hirers, firers) for donations & loans. Hence the wealthy’s money-empathy gap shapes economic policy. • NZ? Nicky Hager, The Hollow Men, chapter 14 & 15 on National Party financing
- 34. Summary: inequality & democracy • Evidence from polling, from relationship between money & empathy gap, & much else, suggests that high-inequality capitalism now working at cross-purposes with democracy • High-inequality capitalism is weakening substantive democracy (within framework of formal democracy)
- 35. A plutocrat celebrates loss of democracy • Bernard Arnault, 10th richest on earth: “Businesses, esp international ones, have ever greater resources, & in Europe they have acquired the ability to compete with states … Politicians’ real impact on the economic life of a country is more & more limited. Fortunately.” (2000, emphasis added) • Implies that private sector firms can best regulate themselves.
- 36. Summary: overall effects of inequality • Swimming pool with a “urinating section” and a “non-urinating section” • Non-urinators cannot insulate themselves from actions of urinators • High inequality (as US, UK levels) has high economy-wide, society-wide, polity-wide costs. • NZ?
- 37. A progressive agenda • (1) Insist that making capitalism work for everyone, not just plutocrats or oligarchs, one of our most pressing problems • (2) Accept that some inequality inevitable & necessary (eg Scandinavian levels). • (3) Challenge idea that inequality of incomes (at US/UK levels) necessary for dynamic economic performance • (4) Insist that income concentration at top intimately related to poverty, exclusion, etc. • (5) Emphasise far-reaching econ, soc, health, political costs of Anglo-levels of inequality
- 38. (6) More attention to pre-distribution • Center-left has focussed too much on re- distribution: tax policy and public spending policy (as though private sector is like a caged lion waiting to spring free of govt regulation) • Focus more on pre-distribution (how to make “market income” distribution, before “take home” income, less unequal)
- 39. Why progressives should focus more on pre-distribution • Most of the disparity of “take home” incomes is result of disparity of incomes before taxes & benefits. • Many laws, regulations, policies have the effect of sluicing income up towards the top. • We have a “conservative nanny state” (Dean Baker)
- 40. Income concentrating policies • Eg Quantitative easing (central bank buys govt bonds to increase liquidity), as distinct from lowering interest rates • Bank of England study (August 2012) showed that QE is a mechanism of crisis mitigation which strongly advances interests of wealthy. • QE in UK since 2008 has driven shares up by > 25% where wld otherwise be. • 40% of shares owned by richest 5%
- 41. Income concentrating pre-distribution measures • Corporate governance law • Trade union law/rights to organize • Intellectual property law • Exchange rate policy • Etc
- 42. (7) The entrepreneurial state • Stop talking down the state, stop framing the debate as “more market & less state, or more state & less market”. • See the potential for state as entrepreneurial complement to entrepreneurs in private sector. • Marianna Mazzucato, The Entrepreneurial State, 2013
- 43. (8) Limit role of Big Money in party financing • Big Donors can shape certain public policies to their liking, directly via grants/loans to parties & candidates, indirectly to interest groups.
- 44. Example of Big Donor influence: Dodd- Frank • Dodd-Frank is the main US financial reform law. • Sunlight Foundation: Wall St lobbyists met 1,298 times with govt officials to influence Dodd-Frank law. Public interest groups met with them 242 times (= one fifth). • Dodd-Frank now being eviscerated. • Eg US T announced (day before Thanksgiving 2012) that FX swaps & forwards are exempt from the regulations. This is dynamite.
- 45. Failed effort to limit Big Money in politics • UK Committee on Standards in Public Life 2011, “Political party financing: ending the Big Donor culture”, Nov. • Identified 3 routes: (1) Restrict amount any individual or organization (companies, TUs) can give or loan; (2) limit party & candidate (campaign) spending; (3) provide public funding. • Report died on day of publication. Nothing changed….
- 46. Big Donors in NZ politics • See Nicky Hager, The Hollow Men, 2006, chapters 14 & 15.
- 47. If western societies do not reduce income concentration… • We will continue to transit from “democratic market capitalism” towards “oligarchic impunity capitalism”, & experience high & rising economic, social, health and political costs. • So, surging income disparity is almost as serious a threat to future of democratic market capitalism as climate change & human aging. • Read Inequality: A NZ Crisis, as a start!
- 48. References • Robert H. Wade, 2012, “Why has income inequality remained on the side-lines of public policy for so long?”, Challenge, May-June, 21- 50. • Robert H. Wade, 2014, “Growth, inequality and poverty: arguments, evidence and economists”, in J. Ravenhill (ed), Global Political Economy, Oxford University Press, 4th edition. • Robert H. Wade, 2004, Governing the Market, Princeton University Press (Best Book in Political Economy prize, American Political Science Association) • RBC Wealth Management and Capgemini Financial Services, 2013, World Wealth Report, June. Quoted in Chrystia Freeland, 2013, “The problem with many millionaires”, IHT, 21 June, p.2 • Bernard Arnault, 2000, La Passion Creative, Plon, Paris. • A.B.Atkinson and J.E. Sogaard, 2013, “The long-run history of income inequality in Denmark: top incomes from 1870 to 2010”, EPRU Working Paper Series, 2013-01, Department of Economics, University of Copenhagen. • Thorvalder Gylfason, 2007, “Why Europe works less and grows taller”, Challenge, Jan/Feb. • Lisa Miller, 2012, “The money-empathy gap”, New York Magazine, 1 July. • Oren Levin-Waldman, 2012, “Income inequality and declining civic participation”, Challenge May-June, 51-70. • David Callahan & Mijin Cha, 2013, “Stacked deck: how the dominance of politics by the affluent and business undermines economic mobility in America”, Demos. • Kevin Gallagher, 2013, “The US as a global risk generator”, The Globalist, June 27. • J. Fisher & T. Eisenstadt, “Introduction: comparative party finance”, Party Politics, 10, 6, 2004, 619-26 • Albert Hunt, 2013, “A rare story of success in Congress”, IHT July 1, p.2.