SlideShare uma empresa Scribd logo
1 de 14
J.P. Morgan Prime Brokerage Global Hedge Fund Trends
1 
This material is provided by J.P. Morgan’s Prime Brokerage business for informational purposes only. It is not a product of J.P. Morgan’s Research Departments.
For Institutional Investors only. For the intended recipient only. The reference period for this publication is April 2013 unless otherwise stated.
May 13, 2013
Executive Summary
April was characterized by continued increases in the equity
markets along with a broad selloff in commodities. The HFRI
Global Hedge Fund Index increased +0.69% month-over-
month. In a notable trend reversal, global macro was among
the strongest performers of the major hedge fund strategies,
rising +1.00%. Relative value made a strong contribution,
increasing +0.99%. The HFRI Event Driven Index rose
+0.90% and the HFRI Equity Hedge Index was up +0.35%.
Leverage
For all accounts in the Prime Brokerage portfolio, gross
leverage1
rose from 1.88 to 1.89 (+0.5%) in April as market
participants increased risk appetite incrementally. Net
exposure2
rose from 0.69 to 0.75 (+7.9%) month-over-month
and net leverage increased from 0.63 to 0.68 (+7.4%).
Securities Lending
The U.S. Prime Brokerage portfolio was net covered for a
third consecutive month. Equities drove activity as investors
focused on first quarter earnings. Fixed income activity was
also skewed towards covering, while ETFs were net shorted.
In Europe, the Glencore/Xstrata merger was finalized,
resulting in downward pressure on borrow rates.
Institutional Investor Sentiment
In North America, a number of consultants are beginning to
consider emerging managers in an effort to differentiate
themselves. In Europe, there is some interest in differentiated
equity strategies such as activist managers with concentrated
portfolios.
Market Perspectives
Although certain data points emerged in April that potentially
bode well for the U.S. economy, growth remains tepid. U.S.
first quarter GDP was 2.5%, which exceeded the fourth
quarter’s anemic pace of 0.4%, but was nevertheless below
expectations. The government sector in the U.S. continues to
exert a drag, as federal spending contracted -4.1% during the
first quarter. It seems likely that the ongoing pullback in
federal outlays will continue to serve as a weight on the heels
of a still-muted recovery.
1
Gross leverage is the total market value of long and short positions divided by clients'
equity in J.P. Morgan’s Prime Brokerage portfolio.
2
Calculated for Equity Long Short and Market Neutral funds on J.P. Morgan’s Prime
Brokerage platform only. Net leverage is defined as the market value of long positions
(LMV) minus the market value of short positions (SMV), divided by clients’ equity (Eq).
Net exposure is defined as the ratio of LMV and SMV, minus one.
Figure 1: April 2013 performance
HFRI and Market Indices. Monthly Returns
Source: Bloomberg, Hedge Fund Research
Table 1: Performance of hedge fund strategies and asset classes
HFRI and Market Indices3
Apr-13 Year-to-Date
HF Index 0.69% 4.37%
Equity LS 0.35% 5.39%
Event Driven 0.90% 4.84%
Macro 1.00% 2.29%
Relative Value 0.99% 4.16%
S&P 500 1.93% 12.74%
Fixed Income 0.97% -1.86%
CMDTY -4.67% -3.42%
USD -1.48% 2.48%
Credit 1.81% 1.89%
Source: Bloomberg, Hedge Fund Research
Figure 2: Hedge fund beta to equities
Rolling 21-day beta of HFRX equal-weighted index returns to the S&P 500 Total Return
Index
Source: Bloomberg, Hedge Fund Research
3
Market indices from Bloomberg are as follows: S&P 500 (SPTR Index), Fixed Income
(JPMGGLBL Index), CMDTY (SPGSCI Index), USD (DXY Index), and Credit (JULIR
Index).
-2.0%
-1.0%
0.0%
1.0%
2.0%
3.0%
HF IndexEquity LS Event
Driven
Macro Rel Value S&P 500 Fixed
Income
CMDTY USD Credit
2,100
2,200
2,300
2,400
2,500
2,600
2,700
2,800
2,900
0.01
0.03
0.05
0.07
0.09
0.11
0.13
0.15
Mar-12 May-12 Jul-12 Sep-12 Nov-12 Jan-13 Mar-13
Equity Beta (LHS) S&P 500 Total Return Index (RHS)
Prime Brokerage Global Hedge Fund Trends – Performance, Leverage, and Risk Exposures
2 
This material is provided by J.P. Morgan’s Prime Brokerage business for informational purposes only. It is not a product of J.P. Morgan’s Research Departments.
For Institutional Investors only. For the intended recipient only. The reference period for this publication is April 2013 unless otherwise stated.
This section presents a summary of the changes that we have observed in leverage and sector exposures across the range of hedge funds that we
work with. The confidentiality of our clients’ positions is important to us and as such this information has been aggregated and displayed in an
anonymous manner in an effort to mitigate the risk of revealing or alluding to any one fund’s exposures. Information may be excluded due to the
perceived risk of revealing sensitive information. The information discussed is specific to activities on J.P. Morgan’s books, and may not represent
total client activity. These numbers should only be viewed as representative observations.
Market Overview
April was characterized by continued gains in the equity
markets, particularly in the U.S. and Japan, a broad selloff in
commodities and mixed economic data. The S&P 500 Total
Return Index increased +1.93% month-over-month and the
Nikkei rose +11.7%, posting its strongest April performance
since 1993 as the Bank of Japan (BoJ) proceeded with its
plans to reflate Japan’s economy. In terms of economic data,
the U.S. jobs report for April exceeded expectations, with
total nonfarm payrolls rising 165,000, causing the
unemployment rate to fall to 7.5%. By contrast, though,
manufacturing PMIs were down globally, March factory
orders slid -4.0%, and first quarter U.S. GDP was weaker
than expected at 2.5%. In part because of the mixed data, the
Federal Reserve is unlikely to reign in its bond buying
program in the foreseeable future. Credit should therefore
remain plentiful, in turn prolonging investors’ hunt for yield.
Hedge Fund Composite
The HFRI Global Hedge Fund Index climbed +0.69% in
April. Global macro and relative value strategies fueled most
of those gains, but all of the major hedge fund categories
returned positive performance, as was the case in March.
There was a noticeable increase in April in the beta of the
HFRX equal-weighted index returns to the S&P 500 Total
Return Index.
Global Macro
In a noticeable reversal of a months’-long trend, global macro
was the best performing strategy in April among the core
hedge fund categories. The HFRI Macro Index returned
+1.00% month-over-month. Trend followers navigated the
massive selloff in gold and other commodities. (Gold
suffered its largest two-day decline in April over the last 30
years.) Accordingly, the HFRI Macro Systematic Diversified
CTA Index rose +2.3%. Both systematic and discretionary
managers with short Yen and long Japanese equities
exposures also benefitted from the Bank of Japan’s onward
march with respect to monetary easing. Managers with long
exposure to U.S. equities benefitted from continued gains in
the S&P 500.
Figure 3: Gold spot daily performance year-to-date
Source: Bloomberg
Relative Value
As in prior months, relative value managers were among the
best performers within the main hedge fund strategies, with
the HFRI Relative Value Index rising +0.99% in April. As in
March, gains among relative value strategies were fueled
largely by multi-strategy and convertible arbitrage managers,
which posted increases of +1.5% and +1.1%, respectively.
April marked the eleventh consecutive monthly gain for the
HFRI Relative Value Index, which has delivered positive
performance in 45 of the 52 months since December 2008.
Event Driven
The HFRI Event Driven Index rose +0.90% in April. Gains
were helped by ongoing deal activity. Distressed transactions
added to the gains, with the HFRX Distressed Restructuring
Index up +0.85% month-over-month. Merger arbitrage
managers also contributed to April’s positive performance,
with the HFRX Merger Arbitrage Index increasing +0.72%
month-over-month.
Equity Hedge
The HFRI Equity Hedge Index increased +0.35% in April as
the S&P 500 continued its year-to-date climb. Equity-biased
managers benefitted from exposures to U.S. and Japanese
equities, which continued their ascent. Equity-focused funds
also benefitted from continued shareholder-friendly activity,
including dividend payments and share buybacks.
Throughout April, market participants were heavily focused
on corporate earnings. Of the companies that reported, 65%
-11.0%
-9.0%
-7.0%
-5.0%
-3.0%
-1.0%
1.0%
3.0%
Jan-13 Feb-13 Mar-13 Apr-13
GOLDLNPM Index
Prime Brokerage Global Hedge Fund Trends – Performance, Leverage, and Risk Exposures
3 
This material is provided by J.P. Morgan’s Prime Brokerage business for informational purposes only. It is not a product of J.P. Morgan’s Research Departments.
For Institutional Investors only. For the intended recipient only. The reference period for this publication is April 2013 unless otherwise stated. 
exceeded earnings per share expectations, which is in line
with trend. Energy and industrials sectors, which declined -
0.88% and -0.84%,4
respectively, offset gains in other
sectors, particularly telecommunications (+5.99%) and
utilities (+5.89%), which outperformed. Weakness in the
energy and industrials sectors may reflect slowing growth
rates, which were captured in the sagging manufacturing
PMIs.
Figure 4: Sector performance, April 2013
Source: Standard & Poor’s, Bloomberg
April seemed to mark a growing divergence between equity
markets on one hand, which continued their year-to-date
gains, and underlying economic data on the other hand,
which sent negative signals. In addition to declining output
PMIs in the U.S., the Euro zone and China, the global
manufacturing PMI is now in negative territory – a bearish
indicator for cyclical sectors. The continued rise in equity
markets is therefore not a reaction to positive signs regarding
economic growth. Instead, it appears that share buyback
activity is helping to support equity markets to a significant
extent. As Figure 5 shows, share buyback activity year-to-
date is comparable to the highs reached in the same periods
in 2007, 2007 and 2011.
4
Based on S&P 500 Energy Index and S&P 500 Industrials Index.
Figure 5: Global share announced buybacks in first four months
of the year ($billion)
Source: ThomsonOne, J.P. Morgan Global Markets Outlook and Strategy
5.99% 5.89%
2.93% 2.90%
2.79% 2.69%
0.83%
0.55%
-0.84% -0.88%
-1.0%
0.0%
1.0%
2.0%
3.0%
4.0%
5.0%
6.0%
7.0%
0
50
100
150
200
250
300
02 03 04 05 06 07 08 09 10 11 12 13
Prime Brokerage Global Hedge Fund Trends – Performance, Leverage, and Risk Exposures
4 
This material is provided by J.P. Morgan’s Prime Brokerage business for informational purposes only. It is not a product of J.P. Morgan’s Research Departments.
For Institutional Investors only. For the intended recipient only. The reference period for this publication is April 2013 unless otherwise stated.
Leverage and Risk Exposures
Gross Leverage
There was a modest uptick in risk appetite towards month-
end once volatility subsided after having notched up during
the middle of April. For all accounts in the Prime Brokerage
portfolio, gross leverage rose from 1.88 to 1.89 (+0.5%) (See
Figure 6). Gross leverage of levered accounts in the Prime
Brokerage portfolio fell from 2.57 to 2.49 (-2.9%) (See
Figure 7). The divergence in gross leverage between levered
accounts and all accounts is typical during risk-on
environments. During such periods, a greater number of
clients run leverage, including those that opportunistically do
so at lower levels, which causes the average among levered
accounts to be skewed lower.
Figure 6: Daily gross leverage and the S&P 500 Index
Source: Bloomberg, J.P. Morgan Prime Brokerage
Figure 7: Gross leverage (levered accounts) 5-day moving
average and the S&P 500 Index
Source: Bloomberg, J.P. Morgan Prime Brokerage
Figure 8: Z-score of gross leverage and the S&P 500 Index 
The Z-score measures how many standard deviations an observation is above or below
the mean
Source: Bloomberg, J.P. Morgan Prime Brokerage
Gross Leverage by Strategy
Gross leverage rose for Equity Long Short (+6.3%) in April
while Convertible Arbitrage and High Grade Fixed Income
fell -5.9% and -9.0%, respectively. An uptick in leverage for
equity-biased strategies is in line with the historical trend
alongside earnings season. As in March, all strategies are
running leverage at or above their 2-year averages except for
High Grade Fixed Income.
Figure 9: Gross leverage by strategy
Source: J.P. Morgan Prime Brokerage
1.75
1.80
1.85
1.90
1.95
1,250
1,300
1,350
1,400
1,450
1,500
1,550
1,600
May-12 Jul-12 Sep-12 Nov-12 Jan-13 Mar-13
S&P 500 Index (LHS) Gross Leverage (RHS)
2.4
2.5
2.6
2.7
1,250
1,300
1,350
1,400
1,450
1,500
1,550
1,600
May-12 Jul-12 Sep-12 Nov-12 Jan-13 Mar-13
S&P 500 Index (LHS) Gross Leverage (Levered Accounts - RHS)
-1.3
0.0
1.3
May-11 Sep-11 Jan-12 May-12 Sep-12 Jan-13
Difference between gross leverage and S&P 500 Index Z-scores
0
1
2
3
4
5
Market Neutral Equity Long
Short
Multi-Strategy Convertible
Arbitrage
High Grade
Fixed Income
High Yield
Fixed Income
Feb-13 Mar-13 Apr-13
Prime Brokerage Global Hedge Fund Trends – Performance, Leverage, and Risk Exposures
5 
This material is provided by J.P. Morgan’s Prime Brokerage business for informational purposes only. It is not a product of J.P. Morgan’s Research Departments.
For Institutional Investors only. For the intended recipient only. The reference period for this publication is April 2013 unless otherwise stated. 
Table 2: Gross leverage by strategy
Average and first quartile calculated for the period of April 2011 to April 2013
Source: J.P. Morgan Prime Brokerage
Net Exposure and Net Leverage
Net exposure for equity-biased funds rose from 0.69 to 0.75
(+7.9%) in April and net leverage increased from 0.63 to 0.68
(+7.4%). Higher exposures and net leverage are reflective of
an uptick in bullishness and risk appetite among equity-
centric managers.
Figure 10: Net exposure and net leverage
Equity Long Short and Market Neutral funds on the Prime Brokerage platform only.
LMV: Market value of long positions. SMV: Market value of short positions.
Eq: Equity in the clients’ accounts
Source: J.P. Morgan Prime Brokerage
Sector Exposures
There was a general increase in long exposures during April,
reflecting incremental bullishness. There were increases in
the long Prime Brokerage portfolio month-over-month in the
Financial (+0.6%), Consumer, Cyclical (+0.5%), and
Technology (+0.5%) sectors. The largest declines occurred in
the Non sector-specific ETF (-2.1%) and Basic Materials (-
0.4%) sectors.
The largest increases in the Prime Brokerage short portfolio
were in the Energy (+0.8%) and Technology (+0.6%) sectors.
The most substantial decreases in short exposure occurred
with respect to the Non sector-specific ETF (-0.7%) and
Industrial (-0.6%) sectors.
Month-over-month, changes in sector exposures may indicate
that the Prime Brokerage portfolio has become more bullish
on the Consumer, Non-cyclical, Financial and Industrial
sectors, for which there were noticeable increases in long
exposure and declines in short exposure.
Table 3: Long and short exposures by sector
Long (Short) exposure by sector as a percentage of total client long (short) exposure in
Prime Brokerage portfolio
Long exposure Short exposure
Apr-12 Mar-13 Apr-13 Apr-12 Mar-13 Apr-13
Basic Materials 5.6% 5.0% 4.6% 4.5% 5.5% 5.4%
Communications 11.9% 14.5% 14.4% 6.5% 7.0% 6.7%
Consumer, Cyclical 11.4% 10.9% 11.4% 8.6% 8.0% 8.2%
Consumer, Non-
cyclical
15.0% 15.2% 15.3% 10.0% 11.3% 11.1%
Diversified 0.3% 0.3% 0.3% 0.1% 0.0% 0.0%
Energy 9.3% 8.8% 9.1% 6.7% 6.3% 7.1%
Non sector-specific
ETF
3.1% 4.1% 2.0% 15.6% 16.1% 15.4%
Financial 19.0% 17.5% 18.1% 11.8% 11.0% 10.9%
Industrial 6.5% 6.1% 6.4% 5.8% 7.0% 6.4%
Technology 5.3% 4.2% 4.7% 5.4% 7.1% 7.7%
Utilities 1.6% 1.1% 1.2% 1.4% 1.9% 1.8%
Government 5.4% 6.8% 7.2% 15.3% 7.3% 7.2%
Other 5.6% 5.6% 5.4% 8.2% 11.5% 12.1%
Source: J.P. Morgan Prime Brokerage
Feb-13 Mar-13 Apr-13 Average
First
Quartile
% Change
Market Neutral 4.47 4.34 4.25 3.82 3.54 -2.1%
Equity Long Short 1.94 1.94 2.06 1.82 1.72 6.3%
Multi-Strategy 1.79 1.78 1.80 1.78 1.76 0.8%
Convertible Arbitrage 4.29 4.52 4.25 3.67 3.47 -5.9%
High Grade Fixed Income 2.06 2.24 2.04 2.59 2.38 -9.0%
High Yield Fixed Income 1.42 1.42 1.44 1.22 1.16 1.4%
PB Portfolio (Levered Accounts) 2.59 2.57 2.49 2.52 2.48 -2.9%
0.4
0.7
1.0
1.3
Apr-11 Aug-11 Dec-11 Apr-12 Aug-12 Dec-12 Apr-13
Net Exposure (LMV/SMV)-1 Net Leverage (LMV-SMV)/Eq
Prime Brokerage Global Hedge Fund Trends – Securities Lending
6 
This material is provided by J.P. Morgan’s Prime Brokerage business for informational purposes only. It is not a product of J.P. Morgan’s Research Departments.
For Institutional Investors only. For the intended recipient only. The reference period for this publication is April 2013 unless otherwise stated. 
North America Securities Lending
Equities
Market participants remained hesitant to add short exposures
in the face of the ongoing equities rally, which resulted in a
third consecutive month of net covering across the U.S. short
book. Equities drove activity in April as investors focused on
first quarter earnings. Fixed income activity was also skewed
towards covering, while ETFs bucked the trend with a solid
month of shorting. In a sign of higher overall engagement,
gross volume was up by more than 20% month-over-month.
From a sector perspective, the strongest covering occurred in
the Communications, Consumer Cyclical and Industrial
sectors, while Technology and Energy led short activity.
ETFs
As the lone asset class net shorted for the month, ETF short
activity was heavily index-focused on IWM (iShares Russell
2000 Index Fund) and MDY (SPDR S&P MidCap 400 ETF),
with one notable sector play in XLE (Energy Select Sector
SPDR). Covering in SPY (SPDR S&P 500) and QQQ
(PowerShares QQQ Trust, Series 1) ran contrary to the
overall trend, with further sector ETF covering across retail
and technology. Japanese and fixed income ETFs lead with
respect to creation inflows, while emerging markets ETFs
experienced the largest outflows.
Event Driven
Provident New York Bancorp (PBNY) and Sterling Bancorp
(STL) agreed to merge in a stock–for–stock transaction
announced in early April. Sterling shareholders will receive
1.2625 shares of Provident and will ultimately own
approximately 47% of the combined company. Provident
short interest is relatively unchanged since news of the
merger broke, while borrow is available at close to GC rates.
The transaction is expected to be completed by year-end.
General Electric (GE) agreed to acquire Lufkin Industries
(LUFK) in an all cash transaction totaling $3.3 billion.
Lufkin shareholders will receive $88.50 per share and the
transaction is expected to close by the end of 2013. Interest
in Lufkin borrow has been relatively light. Lufkin borrow
remains plentiful at GC levels.
Dish Network (DISH) announced an offer to acquire Sprint
Nextel Corp (S) for $7.00 per share, $4.76 of which will be
cash; the remainder will be in stock. Dish is now competing
with Softbank Corp’s (9984 JP) offer from October 2012.
Short interest in Sprint shares has been on the rise in recent
weeks but borrow is readily available at GC rates.
Fixed Income
The Prime Brokerage fixed income short book was net
covered for a third consecutive month. Only two sectors –
basic materials and energy – saw an increase in the net
market value of shorts. However, with Treasury yields
nearing their lowest levels of the past nine months, there was
a substantial increase in Treasury shorts with a heavy
concentration in the 10-year. J.P. Morgan is now forecasting
that yields on the 10-year will begin to rise towards 2%.
Accordingly, activity around Treasuries in the Prime
Brokerage book is likely to continue. Convertibles remain
active in event driven credits; Lam Research (LRCX),
Newmont Mining (NEM) and Priceline (PCLN) all continue
to see strong flows. In high yield, coal mining, basic
materials and energy names continue to garner strong
interest. Most of the Prime Brokerage flows with respect to
high grade have been concentrated in credits with exposure to
headline risk. Active names include Arch Coal Inc. (ACI),
AK Steel (AKS), Alpha Natural Resources (ANR), Dell Inc.
(DELL), Cliff Natural Resources Inc. (CLF), J.C. Penney
(JCP) and United States Steel Corp (X).
Prime Brokerage Global Hedge Fund Trends – Securities Lending
7 
This material is provided by J.P. Morgan’s Prime Brokerage business for informational purposes only. It is not a product of J.P. Morgan’s Research Departments.
For Institutional Investors only. For the intended recipient only. The reference period for this publication is April 2013 unless otherwise stated. 
Figure 11: Cumulative net activity
Market value change of activity across equities, ETFs, and fixed income
Source: J.P. Morgan Securities Lending
Figure 12: Rolling 1-month daily short flow
Daily Activity Relative to 30-Day Average (LHS) and S&P 500 Index (RHS)
Source: Bloomberg, J.P. Morgan Securities Lending
Table 4: U.S. securities lending trends by sector
For the month of April 2013
5 Day 30 Day 90 Day
Price
Change
Position
Change
(shares)
Price
Change
Position
Change
(shares)
Price
Change
Position
Change
(shares)
Consumer, Non-cyclical 0.3% -0.6% 2.3% -2.3% 9.7% -6.7%
Financial 2.0% 1.1% 2.0% -1.5% 7.8% -5.8%
Technology 4.5% -1.5% -1.9% 22.0% -1.3% 27.1%
Energy 2.7% -1.3% -2.4% -0.4% 1.5% 1.6%
Communications 0.6% -0.6% 2.0% -7.1% 6.3% 0.1%
Industrial 2.3% -1.0% -2.2% -6.8% 1.9% -2.2%
Consumer, Cyclical 3.1% -1.1% 4.6% -5.4% 10.6% -8.5%
Basic Materials 5.4% 0.4% -0.7% 6.0% -9.3% 14.6%
Utilities 1.3% -3.5% 5.2% -11.1% 13.4% -19.2%
Source: J.P. Morgan Securities Lending
Table 5: U.S. securities lending trends by ETFs
For the month of April 2013
5 Day 30 Day 90 Day
Price
Change
Position
Change
(shares)
Price
Change
Position
Change
(shares)
Price
Change
Position
Change
(shares)
SPDR S&P 500 ETF TRUST 1.2% -1.6% 1.9% -6.9% 7.0% 28.9%
ISHARES RUSSELL 2000 1.9% 7.8% -0.3% 23.5% 5.3% 10.0%
ENERGY SELECT SECTOR
SPDR
2.7% 0.0% -1.1% 30.4% 3.0% 18.2%
ISHARES MSCI EMERGING
MARKETS INDEX
3.2% 82.5% 1.0% 73.5% -1.4% 51.6%
ISHARES IBOXX H/Y CORP
BOND
1.0% -10.6% 1.8% -8.9% 0.8% -4.5%
FINANCIAL SELECT
SECTOR SPDR
1.6% 13.6% 2.6% 9.5% 7.6% 58.4%
INDUSTRIAL SELECT
SECTOR SPDR
1.8% -0.6% -0.9% -8.8% 3.1% 38.5%
MARKET VECTORS OIL
SERVICE
3.9% -10.9% -0.4% 106.8% 0.7% 303.7%
CONSUMER STAPLES
SPDR
-1.2% -4.1% 2.9% 10.5% 12.0% -15.8%
SPDR BARCLAYS HIGH
YIELD BOND
0.8% -11.2% 1.5% -4.4% 0.4% 83.8%
Source: J.P. Morgan Securities Lending
	
‐$10.0
‐$8.0
‐$6.0
‐$4.0
‐$2.0
$0.0
$2.0
$4.0
$6.0
$8.0
1-May 31-May 30-Jun 30-Jul 29-Aug 28-Sep 28-Oct 27-Nov 27-Dec 26-Jan 25-Feb 27-Mar 26-Apr
Equity ETF Fixed Income Net Activity
1,500
1,525
1,550
1,575
1,600
-300%
-200%
-100%
0%
100%
200%
300%
01-Apr 08-Apr 15-Apr 22-Apr 29-Apr
Net Cover Activity (LHS) Net Short Activity (LHS) S&P 500 Index (RHS)
Prime Brokerage Global Hedge Fund Trends – Securities Lending
8 
This material is provided by J.P. Morgan’s Prime Brokerage business for informational purposes only. It is not a product of J.P. Morgan’s Research Departments.
For Institutional Investors only. For the intended recipient only. The reference period for this publication is April 2013 unless otherwise stated. 
International Securities Lending
EMEA
As in prior months, capital raising events were the main
driver for borrow demand in April. There was significant
interest in Commerzbank AG (CBK GY), Koninklijke KPN
N.V. (KPN NA), Bankia SA (BKIA SM) and Meyer Burger
Technology AG (MBTN SW). The spread for the
Koninklijke rights arbitrage grew sufficiently wide to drive
borrow rates higher, with lenders looking for re-rates. There
has been significant recall activity for Bankia, an already
crowded borrow. Its stock price therefore spiked during the
rights trading period. The same is true for Meyer Burger for
which there have been heavy recalls and re-rates. That was
especially true once the stock began trading ex dividend
rights.
In April, Kier Group Plc (KIE LN) announced its proposed
acquisition of May Gurney Integrated Services Plc (MAYG
LN). Borrow for Kier Group subsequently spiked to 4%.
With respect to flows, there has been considerable interest in
Banca Monte dei Paschi di Siena (BMPS IM) for which
borrow tightened in April as lenders saw large sales and
subsequently recalled. There were also significant recalls for
BMPS in anticipation of the annual general meeting (AGM).
Interest also was heavy in Norsk Hydro ASA (NHY NO) as
local lenders recalled stock for the AGM, thus putting
upward pressure on the borrow rate. Hedge funds also sought
borrow in April to increase their short exposure and maintain
excess to protect existing shorts.
Finally, the Glencore/Xstrata merger is now complete.
Consequently, the Prime Brokerage book is seeing borrow at
GC rates.
Asia Pacific Ex-Japan
Korea
As in March, flows remained light in Korea. April saw
renewed demand for Apple-related names. There was an
uptick in short interest for LG Display Co. Ltd (034220 KS)
and Hynix Semiconductor Inc. (000660 KS). Both names
remain highly liquid.
Taiwan
Onshore recalls continued into April as a result of impending
AGM dates. Borrow for stocks with mid-March record dates
returned to the market, which freed up some liquidity. HTC
Corp. (2498 TW) remains a top short after having missed
earnings expectations. However, hedge funds sought to avoid
onshore supply given that it will be recalled again this year
for an impending dividend record date. As in Korea, there
was a focus on Apple-related plays, including heightened
demand for Largan Precision Co. Ltd. (3008 TW) and
Catcher Technology Co. Ltd. (2474 TW).
Singapore
Demand picked up in April after several months of lighter
activity. Fraser and Neave Ltd. (F99) generated significant
interest after the announcement that it would be removed
from the MSCI. Demand also picked up in the shipping
sector, with Sembcorp Marine Ltd. (SMM) leading the way.
While borrow for Sembcorp historically has been liquid,
heightened demand caused liquidity to tighten, with fees
moving north of 1%.
Hong Kong
ETFs again lead the way among short names. Sports apparel
makers lead the way among single names following a year-
long trend as hedge funds have been scouring the consumer
sector for underperformance. Li Ning Co. Ltd. (2331 HK),
which recently was deleted from the MSCI, and Anta Sports
(2020 HK) were the top locates. Investors also are looking at
shorts among Chinese financials. Along those lines, interest
in China Minsheng Bank (1988 HK) increased through April.
Japan
The Nikkei continued its strong rally in April, ending +11.7%
month-over-month. Clients continued to unwind short
positions owing to continued market strength. The Nikkei
plateaued in mid-April, which caused a number of hedge
funds to increase short positions opportunistically. For
example, there was strong interest in automobile names,
including Mazda Motor (7261 JP), Nissan (7201 JP) and
Suzuki (7267 JP). In the real estate sector, short interest rose
for Sekisui House (1928 JP) and Daiwa Office (8976 JP).
Among financials, there was heightened demand for
consumer finance-related names such as Aiful (8515 JP) and
Acom (8572 JP) along with banks such as Mitsubishi UJF
(8316 JP) and Sumitomo Mitsui Financial (8316JP). Finally,
demand was acute for smartphone game-related Gungho
(3765 JP) and Colopl (3668 JP).
Australia
A bearish outlook on rare earth materials prices caused an
uptick in demand for Lynas Corp. Ltd. (LYC AU) at the start
of April. Headlines out of China and Europe regarding
potential competitive threats put Cochlear (COH) in the
crosshairs of shortsellers. Weakness in gold prices drove
demand for Newcrest Mining Ltd. (NCM AU). Cutbacks in
Prime Brokerage Global Hedge Fund Trends – Securities Lending
9 
This material is provided by J.P. Morgan’s Prime Brokerage business for informational purposes only. It is not a product of J.P. Morgan’s Research Departments.
For Institutional Investors only. For the intended recipient only. The reference period for this publication is April 2013 unless otherwise stated. 
capex among mining companies drove increased interest for
ALS Ltd (ALQ AU), Ausdrill Ltd. (ASL AU) and Worley
Parsons Ltd. (WOR). Rio Tinto Ltd. (RIO AU) borrow was
taken down in substantial size as the spread between the AU
and LN listings diverged, providing opportunity for relative
value investors. Prices for thermal coal continued their slide
as a result of which demand for producer Whitehaven Coal
Ltd. (WHC AU) spiked because of mounting short interest.
Prime Brokerage Global Hedge Fund Trends – Institutional Investor Sentiment
10 
This material is provided by J.P. Morgan’s Prime Brokerage business for informational purposes only. It is not a product of J.P. Morgan’s Research Departments.
For Institutional Investors only. For the intended recipient only. The reference period for this publication is April 2013 unless otherwise stated.
Institutional Investor Sentiment
North America
In general, many investors seem to be on hold with respect to
new allocations, as they have done significant work over the
last 18 months and are now allowing their existing portfolios
to season. Correspondingly, the bar for investors to add new
allocations is currently very high. In April, the Capital
Introduction Group (CIG) held investor meetings in North
Carolina, Portland, Dallas and Los Angeles. In North
Carolina, investors are on hold with respect to new
allocations, as several groups are in the process of
concentrating their portfolios. Investors in Dallas were
interested in learning about new launches, but solely for
informational purposes. In Portland, CIG met with several
regional consultants among which equity long short strategies
are currently in favor. While interest in new launches among
those allocators was keen, early-stage investing is rare for
this group. In Los Angeles, finally, investors are more
interested in fundamental strategies than systematic
strategies. Several allocators expressed a preference for
smaller managers, albeit with fee discounts and via separate
accounts.
Consultants
In an effort to differentiate themselves, several consultants
are beginning to look further down the AUM spectrum and
consider emerging managers.
Funds of Hedge Funds (FoFs)
Among larger FoFs, interest in credit is declining, as equity-
biased strategies are now in favor, including lower net and
activist managers.
Endowments & Foundations (E&Fs)
Long short and event driven equities are of primary interest
among E&Fs. Global macro is of secondary interest. Certain
Tri-State area E&Fs are taking a pause with respect to new
investments, as those groups are giving recent allocations
time to season.
Other Strategies of Interest
CIG has received several requests regarding women- and
minority-owned managers, socially responsible funds,
reinsurance and longer-duration vehicles.
EMEA
Several European investors have made inquiries regarding
“differentiated” equity strategies, including managers with
longer-biased, concentrated portfolios and uncorrelated,
trading-oriented equity funds. It should be noted though, that
new allocation activity among European investors remains
muted. Interest in structured credit continues to wane.
Generally, European investors are not making any new
allocations to this strategy and some investors are reducing
such allocations. Several European investors, primarily FoFs
and private banks, report that outflows have abated. Certain
of those allocators have even started to see inflows.
Asia Pacific
Investor interest in equity-biased, directional strategies is on
the rise. Interest in structured credit among Asia Pacific-
based investors also is increasing. There has also been an
uptick in interest in Asia-based managers from consultants’
clients in the region. Accordingly, consultants’ Asian offices
have started to increase staffing for local hedge fund
research. Investors continue to seek out strategies that can
provide uncorrelated alpha.
Notably, Albourne Partners’ Open Protocol Risk Aggregation
system was endorsed by the Australian Prudential Regulatory
Authority (APRA). Albourne’s system for reporting hedge
fund holdings may therefore become more widely adopted in
Australia as the Stronger Super reforms are rolled out across
the country.
Table 6: Investor strategies of interest by region5
Americas Europe Asia-Pacific
Direction of
Interest
Level of
Interest
Direction of
Interest
Level of
Interest
Direction of
Interest
Level of
Interest
Convertible
Arbitrage
Neutral Neutral Neutral
Distressed Neutral Neutral Neutral
Equity Long
Short
Increasing Increasing Increasing
Event
Driven
Increasing Increasing Neutral
Macro Neutral Neutral Decreasing
CTA Decreasing Neutral Neutral
Market
Neutral
Neutral Neutral Increasing
Structured
Credit
Decreasing Neutral Increasing
Legend
Low Interest
Medium Interest
High Interest
Source: J.P. Morgan Capital Introduction Group
5
This information comes from CIG conference calls and meetings with global hedge
fund managers and institutional investors. This table represents views of the CIG team
and may not be completely exhaustive.
Prime Brokerage Global Hedge Fund Trends – Market Perspectives
11 
This material is provided by J.P. Morgan’s Prime Brokerage business for informational purposes only. It is not a product of J.P. Morgan’s Research Departments.
For Institutional Investors only. For the intended recipient only. The reference period for this publication is April 2013 unless otherwise stated.
April Commentary
Although April delivered some disappointing economic
news, a number of data points emerged that bode well for
growth in the U.S. (and, by extension, the global economy).
For example, private final sales rose at an annualized rate of
+3.3% and new home sales increased by another +1.5% in
March. House prices are running 7% to 11% above their
levels from a year ago as the recovery in residential real
estate continues. The inventory of existing homes for sale, a
key variable impacting house prices, remains close to
housing boom-era lows. Home price appreciation is therefore
likely to continue. The unemployment report for April also
delivered positive news with 165,000 nonfarm payrolls
created, which caused the unemployment rate to drop to
7.5%, its lowest level since the financial crisis. Additionally,
real consumer spending rose at a robust +3.2% during the
first quarter.
However, real GDP rose at an annualized rate of only 2.5%
in the first quarter. While that pace was much improved from
the fourth quarter’s anemic 0.4%, it nonetheless fell below
expectations by roughly half a percentage point. Earlier in the
year6
, we noted that government cutbacks could exert a drag
on growth, which is now occurring. During the first quarter,
government spending contracted by -4.1%. Defense spending
fell by a much steeper -11.5% over the same period. While
predictions that sequestration would throw the economy into
a tailspin fortunately failed to materialize (particularly for
commercial air travelers), the pullback in federal outlays is
serving as an unmistakable weight on the heels of what
remains a tepid recovery.
Despite the sclerosis in Washington, a consensus seems to
have congealed among policymakers that federal spending
should be curtailed to reduce the deficit in both the short run
and over the long term. It seems, therefore, that government
will continue to exert a drag on growth in the coming years,
potentially blunting the recovery.
The following sections are excerpts from J.P. Morgan
Research publications. The full publications can be
accessed via the sources provided in the footnotes below.
6
J.P. Morgan Prime Brokerage, Global Hedge Fund Trends, March 12, 2013.
Key Currency Views: April 2013 7
The aggressive monetary easing by the BoJ is expected to
push the yen lower through (1) lower nominal JGB yields via
aggressive JGB purchases, and (2) higher inflation
expectation due to their strong commitment to a 2% inflation
target. In theory, the combination of lower nominal rates and
higher inflation expectation means Japan’s real interest rates
would move much lower, resulting in a weaker JPY. The US-
Japan real interest rate differential, which is calculated using
actual inflation rates in the US and Japan, has had a good
correlation with USD/JPY. This correlation suggests that if
the market prices in 2% inflation in Japan, USD/JPY could
appreciate to around 105. Before the BoJ announced
aggressive easing on April 4, we had thought that it unlikely
that the market would price in 2% inflation, and thus unlikely
that USD/JPY would rally significantly above 100. However,
after the aggressive easing on April 4th, the possibility that
the market prices in 2% inflation seems to have heightened.
Unprecedented monetary easing by the BoJ is expected to
push long-end JGB yields lower (our JGB strategists expect
10y JGB yield to decline to 0.25% in coming months). This
has heightened speculation that Japanese investors will be
forced to eventually shift their money abroad, as domestic
investment conditions will become difficult given the super
low yields. W e are skeptical about this narration and believe
that even if this materializes, FX impact would remain
uncertain as lower JGB yields should make FX-hedged
foreign bond investments more attractive. However, it’s
likely that this speculation will weigh on JPY for a while.
Global Data Watch: EM Corporates Seem Sluggish8
The global economy is in transition. Growth has picked up
from a low base as drags from tightening credit outside the
US fade, easy money gains traction, and the removal of
significant tail risks bolsters sentiment. However, the damage
from a prolonged period of subpar growth lingers in the form
of a corporate margin squeeze. In addition, the phase of an
intense developed market fiscal adjustment that began last
year is continuing as the US is now absorbing a substantial
fiscal drag. If we are right, these conflicting forces will allow
a choppy return to trend growth to continue. To be sure, the
latest news has been disappointing and the risks to our
current-quarter global GDP forecast of 2.7% (trend is 3%)
7
J.P. Morgan Global FX Strategy, Key Currency Views: April 2013, April 19, 2013,
J.P. Morgan Markets, https://jpmm.com/research/content/GPS-1099959-0.
8
J.P. Morgan Economic Research, Global Data Watch, April 26, 2013, J.P. Morgan
Markets, https://jpmm.com/research/content/GPS-1107480-0.
Prime Brokerage Global Hedge Fund Trends – Market Perspectives
12 
This material is provided by J.P. Morgan’s Prime Brokerage business for informational purposes only. It is not a product of J.P. Morgan’s Research Departments.
For Institutional Investors only. For the intended recipient only. The reference period for this publication is April 2013 unless otherwise stated. 
have shifted to the downside. However, we do not see tail
risks on the horizon and the underlying dynamic in place—of
supportive monetary policies, healing credit markets, and
soon-to-fade fiscal drags—remains consistent with a gradual
transition to stronger growth
Most notable in the recent news is the downshift in the
industrial sector. A rebound in manufacturing output and
business surveys at the start of the year does not appear to be
delivering the above-trend 1Q GDP signaled by our nowcast.
And while we have been looking for growth momentum to
wane, the message from the April surveys is weak. Flash
manufacturing PMI readings were lower than expected in the
US, China, and the Euro area and suggest that global
manufacturing output might be stalling. A sharp up-and-
down swing in global industry is not a particular concern
given the volatility in inventory behavior in recent years, but
the drop in the orders-to-inventory ratio in the flash PMIs
raises concern that final demand growth is growing more
slowly than anticipated.
There is limited information available regarding the
composition of final demand growth last quarter, but we
believe that sluggish EM business spending is the main
source of disappointment. We have been highlighting the
damaging combination of subpar global growth and
weakening pricing power in goods industries for EM profit
margins—particularly as labor costs continue to rise at a
rapid pace. Investment spending has been sluggish in recent
quarters—in absolute terms and relative to consumer
demand—and does not appear to be lifting during 1H13 as
we had expected. Weaker-than-expected manufacturing
sector investment and stockbuilding contributed to last
quarter’s growth disappointment in China, and we expect this
pattern will be evident in GDP releases across the EM more
broadly.
It would be wrong to expect a quick rebound in EM business
spending. The latest IIF survey of EM bank lending officers,
conducted from mid-March through mid-April, found that a
modest net majority of EM banks continue to tighten credit
standards. However, the survey also suggests that the
pressure to tighten is easing. Banks no longer perceive
funding conditions as tight and a significant rise in NPLs
appears to be leveling off. This improvement, if sustained,
should give banks an incentive to stop tightening standards.
Europe’s future will be shaped by politics in the South9
European crisis management is centered on the principle of
conditionality—the application of macroeconomic
adjustment by debtor countries in return for access to external
support. The German government’s commitment that there
will be “no liability without control” has become Europe’s
guiding political maxim; an inter-state equivalent of “no
taxation without representation.” This approach has become
clearer than ever in the post-Cyprus world (see A. White, The
Importance of a Germany that can say no).
The difficulty with this approach, in our view, is that it
assumes that the debtor countries have the institutional
capacity to consistently implement their side of the bargain. It
also assumes that the general public in the debtor countries
shares the same political and normative values as Germany
and the European North (or can be persuaded to acquiesce to
them) in a way that will embed the prevailing approach to the
management of EMU. In reality, both assumptions are
questionable, in our opinion. Near term, the constitutional
and political settlement in the South has created impediments
to the implementation of fiscal restraint. The region has
demonstrated its capacity to address this through the use of
various “work-arounds,” including the imposition of
technocratic administrations and rule by decree (both of
which have proved deeply unpopular).
This approach appears to have been partly successful in
delivering greater fiscal consolidation in the short term. In the
medium term, however, the southern economies will likely
need to embrace deeper structural reform if they are to
deliver sustained growth. This will likely require a degree of
political commitment that goes beyond what is achievable
through the work-around approach. Finally, in the long term,
we believe the South will need to internalize a vision of Euro
area management (EMU Mark II) that is largely based on
northern European precepts. Without this, in our view, a
broader clash of approaches to EMU will be hard to avoid
(the German view is that domestic dysfunction within the
periphery must be addressed before more substantive
integration can occur).
The recent intervention by the Portuguese Constitutional
Court, which threw out aspects of the 2013 Budget, is a case
in point. In our view, the near-term solution is for the
Portuguese government to prepare additional measures that
9
J.P. Morgan Economic and Policy Research, Economic Research Note, April 26, 2013,
J.P. Morgan Markets, https://jpmm.com/research/content/GPS-1106830-0.
Prime Brokerage Global Hedge Fund Trends – Market Perspectives
13 
This material is provided by J.P. Morgan’s Prime Brokerage business for informational purposes only. It is not a product of J.P. Morgan’s Research Departments.
For Institutional Investors only. For the intended recipient only. The reference period for this publication is April 2013 unless otherwise stated. 
meet the requirements of its assistance program and are
compatible with its constitution. Longer term, we believe
Portugal needs to ensure that its constitutional settlement and
the requirements of EMU membership—as well as broader
fiscal realities—are not in conflict. The European South still
has a long political journey ahead of it, and we expect its
response will shape the region’s future in the short, medium,
and long term.
Important Information and Disclaimers
14 
This material is provided by J.P. Morgan’s Prime Brokerage business for informational purposes only. It is not a product of J.P. Morgan’s Research Departments.
For Institutional Investors only. For the intended recipient only. The reference period for this publication is April 2013 unless otherwise stated.
This material (“Material”) is provided by J.P. Morgan’s Prime
Brokerage business for informational purposes only. It is not a
product of J.P. Morgan’s Research Departments. This Material
includes data and viewpoints from various departments and
businesses within JPMorgan Chase & Co., as well as from third
parties unaffiliated with JPMorgan Chase & Co. and its subsidiaries.
The generalized hedge fund and institutional investor information
presented in this Material, including trends referred to herein, are
not intended to be representative of the hedge fund and institutional
investor communities at large. This Material is provided directly to
professional and institutional investors and is not intended for nor
may it be provided to retail clients.
This Material has not been verified for accuracy or completeness by
JPMorgan Chase & Co. or by any of its subsidiaries, affiliates,
successors, assigns, agents, or by any of their respective officers,
directors, employees, agents or advisers (collectively, “JPMorgan”),
and JPMorgan does not guarantee this Material in any respect,
including but not limited to, its accuracy, completeness or
timeliness. Information for this Material was collected and compiled
during the stated timeframe, if applicable. Past performance is not a
guarantee of future results. JPMorgan has no obligation to update
any portion of this Material. This Material may not be relied upon as
definitive, and shall not form the basis of any decisions. It is the
user’s responsibility to independently confirm the information
presented in this Material, and to obtain any other information
deemed relevant to any decision made in connection with the
subject matter contained in this Material. Users of this Material are
encouraged to seek their own professional experts as they deem
appropriate including, but not limited to, tax, financial, legal,
investment or equivalent advisers, in relation to the subject matter
covered by this Material. JPMorgan makes no representations (and
to the extent permitted by law, all implied warranties and
representations are hereby excluded), and JPMorgan takes no
responsibility for the information presented in this Material. This
Material is provided for informational purposes only and for the
intended users’ use only, and no portion of this Material may be
reproduced or distributed for any purpose without the express
written permission of JPMorgan. The provision of this Material does
not constitute, and shall not be construed as constituting or be
deemed to constitute, a solicitation of, or offer or inducement to
provide or carry on, any type of investment service or activity by
JPMorgan. Under all applicable laws, including, but not limited to,
the US Employee Retirement Income Security Act of 1974, as
amended, or the US Internal Revenue Code of 1986 or the Financial
Services and Markets Act 2000 (Regulated Activities) Order 2001,
as amended, no portion of this Material shall constitute, or be
construed as constituting or be deemed to constitute “investment
advice” for any purpose, and JPMorgan shall not be considered as a
fiduciary of any person or institution for any purpose in relation to
Material. This Material shall not be construed as constituting or be
deemed to constitute an invitation to treat in respect of, an offer or a
solicitation of an offer to buy or sell any securities or constitute
advice to buy or sell any security. This Material is not intended as
tax, legal, financial or equivalent advice and should not be regarded
or used as such. The Material should not be relied upon for
compliance.
An investment in a hedge fund is speculative and involves a high
degree of risk, which each investor must carefully consider. Returns
generated from an investment in a hedge fund may not adequately
compensate investors for the business and financial risks assumed.
An investor in hedge funds could lose all or a substantial amount of
its investment. While hedge funds are subject to market risks
common to other types of investments, including market volatility,
hedge funds employ certain trading techniques, such as the use of
leveraging and other speculative investment practices that may
increase the risk of investment loss. Other risks associated with
hedge fund investments include, but are not limited to, the fact that
hedge funds: can be highly illiquid; are not required to provide
periodic pricing or valuation information to investors; may involve
complex tax structures and delays in distributing important tax
information; are not subject to the same regulatory requirements as
mutual funds; often charge higher fees and the high fees may offset
the fund’s trading profits; may have a limited operating history; can
have performance that is volatile; may have a fund manager who has
total trading authority over the fund and the use of a single adviser
applying generally similar trading programs could mean a lack of
diversification, and consequentially, higher risk; may not have a
secondary market for an investor’s interest in the fund and none may
be expected to develop; may have restrictions on transferring
interests in the fund; and may affect a substantial portion of its
trades on foreign exchanges.
JPMorgan may (as agent or principal) have positions (long or short),
effect transactions or make markets in securities or financial
instruments mentioned herein (or derivatives with respect thereto),
or provide advice or loans to, or participate in the underwriting or
restructuring of the obligations of, issuers mentioned herein.
JPMorgan may engage in transactions in a manner inconsistent with
the views discussed herein.
© 2013 JPMorgan Chase & Co. All rights reserved. All product
names, company names and logos mentioned herein are trademarks
or registered trademarks of their respective owners. Access to
financial products and execution services is offered through J.P.
Morgan Securities LLC (“JPMS”) and J.P. Morgan Securities plc
(“JPMS plc”). Clearing, prime brokerage and custody services are
provided by J.P. Morgan Clearing Corp. (“JPMCC”) in the US and
JPMS plc in the UK. JPMS and JPMCC are separately registered
US broker dealer affiliates of JPMorgan Chase & Co., and are each
members of FINRA, NYSE and SIPC. JPMS plc is authorized by
the Prudential Regulation Authority and regulated by the Financial
Conduct Authority and the Prudential Regulation Authority in the
UK. J.P. Morgan Securities (Asia Pacific) Limited is regulated by
the HKMA.
Contact Us:
Alessandra Tocco
Alessandra.Tocco@jpmorgan.com
212-272-9132
Kenny King, CFA
Kenny.King@jpmorgan.com
212-622-5043
Christopher M. Evans
c.m.evans@jpmorgan.com
212-622-5693
Stacy Bartolomeo
Stacy.Bartolomeo@jpmorgan.com
212-272-3471
Elizabeth Drumm
Elizabeth.H.Drumm@jpmorgan.com
212-272-2642

Mais conteúdo relacionado

Mais procurados

Asia pacific strategy - modifying our view - raise india to marketweight (3)
Asia pacific strategy - modifying our view - raise india to marketweight (3)Asia pacific strategy - modifying our view - raise india to marketweight (3)
Asia pacific strategy - modifying our view - raise india to marketweight (3)Hemant Khanolkar
 
ING Funds Fact Sheets@March 2010
ING Funds Fact Sheets@March 2010ING Funds Fact Sheets@March 2010
ING Funds Fact Sheets@March 2010Wilson Wong
 
Strategy untenable euphoria - centrum-310809
Strategy   untenable euphoria - centrum-310809Strategy   untenable euphoria - centrum-310809
Strategy untenable euphoria - centrum-310809Manish Kayal, CFA
 
clear channel swap
clear channel swapclear channel swap
clear channel swapDylan Bateh
 
Equity Update - March 2019
Equity Update - March 2019Equity Update - March 2019
Equity Update - March 2019iciciprumf
 
Conquest Monthly Recap Report - 022916
Conquest Monthly Recap Report - 022916Conquest Monthly Recap Report - 022916
Conquest Monthly Recap Report - 022916RC_Stewart
 
Ch21 mish11 embfm
Ch21 mish11 embfmCh21 mish11 embfm
Ch21 mish11 embfmRob Sears
 
A Better Investment Experience
A Better Investment ExperienceA Better Investment Experience
A Better Investment ExperienceMichael J. Evans
 
Putnam Perspective: Fixed Income Outlook Q2 2014
Putnam Perspective: Fixed Income Outlook Q2 2014Putnam Perspective: Fixed Income Outlook Q2 2014
Putnam Perspective: Fixed Income Outlook Q2 2014Putnam Investments
 
Capital Markets Insights - Spring 2017
Capital Markets Insights - Spring 2017Capital Markets Insights - Spring 2017
Capital Markets Insights - Spring 2017Duff & Phelps
 
fundamental analysis for axis bank in banking industry
fundamental analysis for axis bank in banking industryfundamental analysis for axis bank in banking industry
fundamental analysis for axis bank in banking industryswapnilgangele
 
Equity Update - April 2019
Equity Update - April 2019Equity Update - April 2019
Equity Update - April 2019iciciprumf
 

Mais procurados (20)

Central Vision
Central VisionCentral Vision
Central Vision
 
Asia pacific strategy - modifying our view - raise india to marketweight (3)
Asia pacific strategy - modifying our view - raise india to marketweight (3)Asia pacific strategy - modifying our view - raise india to marketweight (3)
Asia pacific strategy - modifying our view - raise india to marketweight (3)
 
ING Funds Fact Sheets@March 2010
ING Funds Fact Sheets@March 2010ING Funds Fact Sheets@March 2010
ING Funds Fact Sheets@March 2010
 
Strategy untenable euphoria - centrum-310809
Strategy   untenable euphoria - centrum-310809Strategy   untenable euphoria - centrum-310809
Strategy untenable euphoria - centrum-310809
 
clear channel swap
clear channel swapclear channel swap
clear channel swap
 
Weekly Market Review, April 05, 2013
Weekly Market Review, April 05, 2013Weekly Market Review, April 05, 2013
Weekly Market Review, April 05, 2013
 
Equity Update - March 2019
Equity Update - March 2019Equity Update - March 2019
Equity Update - March 2019
 
Conquest Monthly Recap Report - 022916
Conquest Monthly Recap Report - 022916Conquest Monthly Recap Report - 022916
Conquest Monthly Recap Report - 022916
 
Weekly Market Review - October 25, 2013
Weekly Market Review - October 25, 2013Weekly Market Review - October 25, 2013
Weekly Market Review - October 25, 2013
 
Ch21 mish11 embfm
Ch21 mish11 embfmCh21 mish11 embfm
Ch21 mish11 embfm
 
Weekly Market Review - June 28, 2013
Weekly Market Review - June 28, 2013Weekly Market Review - June 28, 2013
Weekly Market Review - June 28, 2013
 
A Better Investment Experience
A Better Investment ExperienceA Better Investment Experience
A Better Investment Experience
 
Japan_Equity_Strategy
Japan_Equity_StrategyJapan_Equity_Strategy
Japan_Equity_Strategy
 
Putnam Perspective: Fixed Income Outlook Q2 2014
Putnam Perspective: Fixed Income Outlook Q2 2014Putnam Perspective: Fixed Income Outlook Q2 2014
Putnam Perspective: Fixed Income Outlook Q2 2014
 
76 i chronicle
76 i chronicle76 i chronicle
76 i chronicle
 
Capital Markets Insights - Spring 2017
Capital Markets Insights - Spring 2017Capital Markets Insights - Spring 2017
Capital Markets Insights - Spring 2017
 
fundamental analysis for axis bank in banking industry
fundamental analysis for axis bank in banking industryfundamental analysis for axis bank in banking industry
fundamental analysis for axis bank in banking industry
 
BOJ_Policy
BOJ_PolicyBOJ_Policy
BOJ_Policy
 
Equity Update - April 2019
Equity Update - April 2019Equity Update - April 2019
Equity Update - April 2019
 
LPL Research 2014 Mid-Year
LPL Research 2014 Mid-Year LPL Research 2014 Mid-Year
LPL Research 2014 Mid-Year
 

Semelhante a JPM Prime Brokerage Global Hedge Fund Trends May 2013.pdf

JPM Prime Brokerage Global Hedge Fund Trends September 2013
JPM Prime Brokerage Global Hedge Fund Trends September 2013JPM Prime Brokerage Global Hedge Fund Trends September 2013
JPM Prime Brokerage Global Hedge Fund Trends September 2013Brian Shapiro
 
Olympic Wealth Fund Marathon Class 'A' April Fact sheet
Olympic Wealth Fund Marathon Class 'A' April Fact sheetOlympic Wealth Fund Marathon Class 'A' April Fact sheet
Olympic Wealth Fund Marathon Class 'A' April Fact sheetRichard Baxter
 
The World This Week May 13 - May 17, 2013
The World This Week May 13 - May 17, 2013The World This Week May 13 - May 17, 2013
The World This Week May 13 - May 17, 2013Karvy Private Wealth
 
Week Ahead: Markets to remain volatile with positive bias - Eastern Financiers
Week Ahead: Markets to remain volatile with positive bias - Eastern FinanciersWeek Ahead: Markets to remain volatile with positive bias - Eastern Financiers
Week Ahead: Markets to remain volatile with positive bias - Eastern FinanciersIndiaNotes.com
 
Investment Edge Quarter 1 2011
Investment Edge Quarter 1 2011Investment Edge Quarter 1 2011
Investment Edge Quarter 1 2011simonkbowen
 

Semelhante a JPM Prime Brokerage Global Hedge Fund Trends May 2013.pdf (20)

JPM Prime Brokerage Global Hedge Fund Trends September 2013
JPM Prime Brokerage Global Hedge Fund Trends September 2013JPM Prime Brokerage Global Hedge Fund Trends September 2013
JPM Prime Brokerage Global Hedge Fund Trends September 2013
 
Weekly Market Review, Apr 26, 2013
Weekly Market Review, Apr 26, 2013Weekly Market Review, Apr 26, 2013
Weekly Market Review, Apr 26, 2013
 
Olympic Wealth Fund Marathon Class 'A' April Fact sheet
Olympic Wealth Fund Marathon Class 'A' April Fact sheetOlympic Wealth Fund Marathon Class 'A' April Fact sheet
Olympic Wealth Fund Marathon Class 'A' April Fact sheet
 
Weekly Market Review - February 7, 2014
Weekly Market Review - February 7, 2014Weekly Market Review - February 7, 2014
Weekly Market Review - February 7, 2014
 
Weekly Market Review June 14, 2013
Weekly Market Review June 14, 2013Weekly Market Review June 14, 2013
Weekly Market Review June 14, 2013
 
Weekly market review - May 31, 2013
Weekly market review - May 31, 2013Weekly market review - May 31, 2013
Weekly market review - May 31, 2013
 
Weekly Market Review - January 03, 2014
Weekly Market Review - January 03, 2014Weekly Market Review - January 03, 2014
Weekly Market Review - January 03, 2014
 
Weekly Market Review, May 17, 2013
Weekly Market Review, May 17, 2013Weekly Market Review, May 17, 2013
Weekly Market Review, May 17, 2013
 
Weekly Market Review Apr 19, 2013
Weekly Market Review  Apr 19, 2013Weekly Market Review  Apr 19, 2013
Weekly Market Review Apr 19, 2013
 
Weekly Market Review - May 24, 2013
Weekly Market Review - May 24, 2013Weekly Market Review - May 24, 2013
Weekly Market Review - May 24, 2013
 
Weekly Market Review - May 10, 2013
Weekly Market Review - May 10, 2013Weekly Market Review - May 10, 2013
Weekly Market Review - May 10, 2013
 
The World This Week May 13 - May 17, 2013
The World This Week May 13 - May 17, 2013The World This Week May 13 - May 17, 2013
The World This Week May 13 - May 17, 2013
 
Weekly Market Review - January 24, 2014
Weekly Market Review - January 24, 2014Weekly Market Review - January 24, 2014
Weekly Market Review - January 24, 2014
 
Weekly Market Review - July 5, 2013
Weekly Market Review - July 5, 2013Weekly Market Review - July 5, 2013
Weekly Market Review - July 5, 2013
 
Weekly Market Review - August 30, 2013
Weekly Market Review - August 30, 2013Weekly Market Review - August 30, 2013
Weekly Market Review - August 30, 2013
 
Weekly market review: June 7, 2013
Weekly market review: June 7, 2013Weekly market review: June 7, 2013
Weekly market review: June 7, 2013
 
Week Ahead: Markets to remain volatile with positive bias - Eastern Financiers
Week Ahead: Markets to remain volatile with positive bias - Eastern FinanciersWeek Ahead: Markets to remain volatile with positive bias - Eastern Financiers
Week Ahead: Markets to remain volatile with positive bias - Eastern Financiers
 
Weekly Market Review - August 23, 2013
Weekly Market Review - August 23, 2013Weekly Market Review - August 23, 2013
Weekly Market Review - August 23, 2013
 
Weekly Market Review - December 13, 2013
Weekly Market Review - December 13, 2013Weekly Market Review - December 13, 2013
Weekly Market Review - December 13, 2013
 
Investment Edge Quarter 1 2011
Investment Edge Quarter 1 2011Investment Edge Quarter 1 2011
Investment Edge Quarter 1 2011
 

Mais de Brian Shapiro

JPM Prime Brokerage 2014 Institutional Investor Sentiments Report
JPM Prime Brokerage 2014 Institutional Investor Sentiments ReportJPM Prime Brokerage 2014 Institutional Investor Sentiments Report
JPM Prime Brokerage 2014 Institutional Investor Sentiments ReportBrian Shapiro
 
JP Morgan Prime Brokerage 2013 Hedge Fund Terms Analysis
JP Morgan Prime Brokerage 2013 Hedge Fund Terms AnalysisJP Morgan Prime Brokerage 2013 Hedge Fund Terms Analysis
JP Morgan Prime Brokerage 2013 Hedge Fund Terms AnalysisBrian Shapiro
 
CS Liquid Alternative Beta Performance Review 2013
CS Liquid Alternative Beta Performance Review 2013CS Liquid Alternative Beta Performance Review 2013
CS Liquid Alternative Beta Performance Review 2013Brian Shapiro
 
JP Morgan Prime Brokerage Perspectives 4Q 2013
JP Morgan Prime Brokerage Perspectives 4Q 2013JP Morgan Prime Brokerage Perspectives 4Q 2013
JP Morgan Prime Brokerage Perspectives 4Q 2013Brian Shapiro
 
Citi prime services report on liquid alternatives
Citi prime services report on liquid alternativesCiti prime services report on liquid alternatives
Citi prime services report on liquid alternativesBrian Shapiro
 
HSBC Hedge weekly2013 no22
HSBC Hedge weekly2013 no22HSBC Hedge weekly2013 no22
HSBC Hedge weekly2013 no22Brian Shapiro
 
Opg keys to establishing a cost efficient & institutional quality hedge fun...
Opg   keys to establishing a cost efficient & institutional quality hedge fun...Opg   keys to establishing a cost efficient & institutional quality hedge fun...
Opg keys to establishing a cost efficient & institutional quality hedge fun...Brian Shapiro
 
HSBC Hedge Weekly 2013 No12
HSBC Hedge Weekly 2013 No12HSBC Hedge Weekly 2013 No12
HSBC Hedge Weekly 2013 No12Brian Shapiro
 
JPM Prime Brokerage Global Hedge Fund Trends March 2013
JPM Prime Brokerage Global Hedge Fund Trends March 2013JPM Prime Brokerage Global Hedge Fund Trends March 2013
JPM Prime Brokerage Global Hedge Fund Trends March 2013Brian Shapiro
 
MS Weekly US PB Mkt Clr Summary 2013.03.18
MS Weekly US PB Mkt Clr Summary 2013.03.18MS Weekly US PB Mkt Clr Summary 2013.03.18
MS Weekly US PB Mkt Clr Summary 2013.03.18Brian Shapiro
 
Credit suisse 2013 investor survey report final
Credit suisse 2013 investor survey report finalCredit suisse 2013 investor survey report final
Credit suisse 2013 investor survey report finalBrian Shapiro
 
Credit Suisse investor update february 2013 final
Credit Suisse investor update february 2013 finalCredit Suisse investor update february 2013 final
Credit Suisse investor update february 2013 finalBrian Shapiro
 
Hedge weekly2013 no07
Hedge weekly2013 no07Hedge weekly2013 no07
Hedge weekly2013 no07Brian Shapiro
 
HSBC Hedge weekly2013 no05
HSBC Hedge weekly2013 no05HSBC Hedge weekly2013 no05
HSBC Hedge weekly2013 no05Brian Shapiro
 

Mais de Brian Shapiro (14)

JPM Prime Brokerage 2014 Institutional Investor Sentiments Report
JPM Prime Brokerage 2014 Institutional Investor Sentiments ReportJPM Prime Brokerage 2014 Institutional Investor Sentiments Report
JPM Prime Brokerage 2014 Institutional Investor Sentiments Report
 
JP Morgan Prime Brokerage 2013 Hedge Fund Terms Analysis
JP Morgan Prime Brokerage 2013 Hedge Fund Terms AnalysisJP Morgan Prime Brokerage 2013 Hedge Fund Terms Analysis
JP Morgan Prime Brokerage 2013 Hedge Fund Terms Analysis
 
CS Liquid Alternative Beta Performance Review 2013
CS Liquid Alternative Beta Performance Review 2013CS Liquid Alternative Beta Performance Review 2013
CS Liquid Alternative Beta Performance Review 2013
 
JP Morgan Prime Brokerage Perspectives 4Q 2013
JP Morgan Prime Brokerage Perspectives 4Q 2013JP Morgan Prime Brokerage Perspectives 4Q 2013
JP Morgan Prime Brokerage Perspectives 4Q 2013
 
Citi prime services report on liquid alternatives
Citi prime services report on liquid alternativesCiti prime services report on liquid alternatives
Citi prime services report on liquid alternatives
 
HSBC Hedge weekly2013 no22
HSBC Hedge weekly2013 no22HSBC Hedge weekly2013 no22
HSBC Hedge weekly2013 no22
 
Opg keys to establishing a cost efficient & institutional quality hedge fun...
Opg   keys to establishing a cost efficient & institutional quality hedge fun...Opg   keys to establishing a cost efficient & institutional quality hedge fun...
Opg keys to establishing a cost efficient & institutional quality hedge fun...
 
HSBC Hedge Weekly 2013 No12
HSBC Hedge Weekly 2013 No12HSBC Hedge Weekly 2013 No12
HSBC Hedge Weekly 2013 No12
 
JPM Prime Brokerage Global Hedge Fund Trends March 2013
JPM Prime Brokerage Global Hedge Fund Trends March 2013JPM Prime Brokerage Global Hedge Fund Trends March 2013
JPM Prime Brokerage Global Hedge Fund Trends March 2013
 
MS Weekly US PB Mkt Clr Summary 2013.03.18
MS Weekly US PB Mkt Clr Summary 2013.03.18MS Weekly US PB Mkt Clr Summary 2013.03.18
MS Weekly US PB Mkt Clr Summary 2013.03.18
 
Credit suisse 2013 investor survey report final
Credit suisse 2013 investor survey report finalCredit suisse 2013 investor survey report final
Credit suisse 2013 investor survey report final
 
Credit Suisse investor update february 2013 final
Credit Suisse investor update february 2013 finalCredit Suisse investor update february 2013 final
Credit Suisse investor update february 2013 final
 
Hedge weekly2013 no07
Hedge weekly2013 no07Hedge weekly2013 no07
Hedge weekly2013 no07
 
HSBC Hedge weekly2013 no05
HSBC Hedge weekly2013 no05HSBC Hedge weekly2013 no05
HSBC Hedge weekly2013 no05
 

JPM Prime Brokerage Global Hedge Fund Trends May 2013.pdf

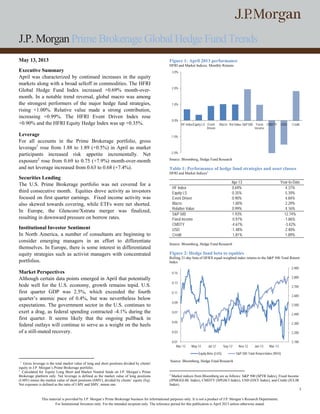
  • 1. J.P. Morgan Prime Brokerage Global Hedge Fund Trends 1  This material is provided by J.P. Morgan’s Prime Brokerage business for informational purposes only. It is not a product of J.P. Morgan’s Research Departments. For Institutional Investors only. For the intended recipient only. The reference period for this publication is April 2013 unless otherwise stated. May 13, 2013 Executive Summary April was characterized by continued increases in the equity markets along with a broad selloff in commodities. The HFRI Global Hedge Fund Index increased +0.69% month-over- month. In a notable trend reversal, global macro was among the strongest performers of the major hedge fund strategies, rising +1.00%. Relative value made a strong contribution, increasing +0.99%. The HFRI Event Driven Index rose +0.90% and the HFRI Equity Hedge Index was up +0.35%. Leverage For all accounts in the Prime Brokerage portfolio, gross leverage1 rose from 1.88 to 1.89 (+0.5%) in April as market participants increased risk appetite incrementally. Net exposure2 rose from 0.69 to 0.75 (+7.9%) month-over-month and net leverage increased from 0.63 to 0.68 (+7.4%). Securities Lending The U.S. Prime Brokerage portfolio was net covered for a third consecutive month. Equities drove activity as investors focused on first quarter earnings. Fixed income activity was also skewed towards covering, while ETFs were net shorted. In Europe, the Glencore/Xstrata merger was finalized, resulting in downward pressure on borrow rates. Institutional Investor Sentiment In North America, a number of consultants are beginning to consider emerging managers in an effort to differentiate themselves. In Europe, there is some interest in differentiated equity strategies such as activist managers with concentrated portfolios. Market Perspectives Although certain data points emerged in April that potentially bode well for the U.S. economy, growth remains tepid. U.S. first quarter GDP was 2.5%, which exceeded the fourth quarter’s anemic pace of 0.4%, but was nevertheless below expectations. The government sector in the U.S. continues to exert a drag, as federal spending contracted -4.1% during the first quarter. It seems likely that the ongoing pullback in federal outlays will continue to serve as a weight on the heels of a still-muted recovery. 1 Gross leverage is the total market value of long and short positions divided by clients' equity in J.P. Morgan’s Prime Brokerage portfolio. 2 Calculated for Equity Long Short and Market Neutral funds on J.P. Morgan’s Prime Brokerage platform only. Net leverage is defined as the market value of long positions (LMV) minus the market value of short positions (SMV), divided by clients’ equity (Eq). Net exposure is defined as the ratio of LMV and SMV, minus one. Figure 1: April 2013 performance HFRI and Market Indices. Monthly Returns Source: Bloomberg, Hedge Fund Research Table 1: Performance of hedge fund strategies and asset classes HFRI and Market Indices3 Apr-13 Year-to-Date HF Index 0.69% 4.37% Equity LS 0.35% 5.39% Event Driven 0.90% 4.84% Macro 1.00% 2.29% Relative Value 0.99% 4.16% S&P 500 1.93% 12.74% Fixed Income 0.97% -1.86% CMDTY -4.67% -3.42% USD -1.48% 2.48% Credit 1.81% 1.89% Source: Bloomberg, Hedge Fund Research Figure 2: Hedge fund beta to equities Rolling 21-day beta of HFRX equal-weighted index returns to the S&P 500 Total Return Index Source: Bloomberg, Hedge Fund Research 3 Market indices from Bloomberg are as follows: S&P 500 (SPTR Index), Fixed Income (JPMGGLBL Index), CMDTY (SPGSCI Index), USD (DXY Index), and Credit (JULIR Index). -2.0% -1.0% 0.0% 1.0% 2.0% 3.0% HF IndexEquity LS Event Driven Macro Rel Value S&P 500 Fixed Income CMDTY USD Credit 2,100 2,200 2,300 2,400 2,500 2,600 2,700 2,800 2,900 0.01 0.03 0.05 0.07 0.09 0.11 0.13 0.15 Mar-12 May-12 Jul-12 Sep-12 Nov-12 Jan-13 Mar-13 Equity Beta (LHS) S&P 500 Total Return Index (RHS)
  • 2. Prime Brokerage Global Hedge Fund Trends – Performance, Leverage, and Risk Exposures 2  This material is provided by J.P. Morgan’s Prime Brokerage business for informational purposes only. It is not a product of J.P. Morgan’s Research Departments. For Institutional Investors only. For the intended recipient only. The reference period for this publication is April 2013 unless otherwise stated. This section presents a summary of the changes that we have observed in leverage and sector exposures across the range of hedge funds that we work with. The confidentiality of our clients’ positions is important to us and as such this information has been aggregated and displayed in an anonymous manner in an effort to mitigate the risk of revealing or alluding to any one fund’s exposures. Information may be excluded due to the perceived risk of revealing sensitive information. The information discussed is specific to activities on J.P. Morgan’s books, and may not represent total client activity. These numbers should only be viewed as representative observations. Market Overview April was characterized by continued gains in the equity markets, particularly in the U.S. and Japan, a broad selloff in commodities and mixed economic data. The S&P 500 Total Return Index increased +1.93% month-over-month and the Nikkei rose +11.7%, posting its strongest April performance since 1993 as the Bank of Japan (BoJ) proceeded with its plans to reflate Japan’s economy. In terms of economic data, the U.S. jobs report for April exceeded expectations, with total nonfarm payrolls rising 165,000, causing the unemployment rate to fall to 7.5%. By contrast, though, manufacturing PMIs were down globally, March factory orders slid -4.0%, and first quarter U.S. GDP was weaker than expected at 2.5%. In part because of the mixed data, the Federal Reserve is unlikely to reign in its bond buying program in the foreseeable future. Credit should therefore remain plentiful, in turn prolonging investors’ hunt for yield. Hedge Fund Composite The HFRI Global Hedge Fund Index climbed +0.69% in April. Global macro and relative value strategies fueled most of those gains, but all of the major hedge fund categories returned positive performance, as was the case in March. There was a noticeable increase in April in the beta of the HFRX equal-weighted index returns to the S&P 500 Total Return Index. Global Macro In a noticeable reversal of a months’-long trend, global macro was the best performing strategy in April among the core hedge fund categories. The HFRI Macro Index returned +1.00% month-over-month. Trend followers navigated the massive selloff in gold and other commodities. (Gold suffered its largest two-day decline in April over the last 30 years.) Accordingly, the HFRI Macro Systematic Diversified CTA Index rose +2.3%. Both systematic and discretionary managers with short Yen and long Japanese equities exposures also benefitted from the Bank of Japan’s onward march with respect to monetary easing. Managers with long exposure to U.S. equities benefitted from continued gains in the S&P 500. Figure 3: Gold spot daily performance year-to-date Source: Bloomberg Relative Value As in prior months, relative value managers were among the best performers within the main hedge fund strategies, with the HFRI Relative Value Index rising +0.99% in April. As in March, gains among relative value strategies were fueled largely by multi-strategy and convertible arbitrage managers, which posted increases of +1.5% and +1.1%, respectively. April marked the eleventh consecutive monthly gain for the HFRI Relative Value Index, which has delivered positive performance in 45 of the 52 months since December 2008. Event Driven The HFRI Event Driven Index rose +0.90% in April. Gains were helped by ongoing deal activity. Distressed transactions added to the gains, with the HFRX Distressed Restructuring Index up +0.85% month-over-month. Merger arbitrage managers also contributed to April’s positive performance, with the HFRX Merger Arbitrage Index increasing +0.72% month-over-month. Equity Hedge The HFRI Equity Hedge Index increased +0.35% in April as the S&P 500 continued its year-to-date climb. Equity-biased managers benefitted from exposures to U.S. and Japanese equities, which continued their ascent. Equity-focused funds also benefitted from continued shareholder-friendly activity, including dividend payments and share buybacks. Throughout April, market participants were heavily focused on corporate earnings. Of the companies that reported, 65% -11.0% -9.0% -7.0% -5.0% -3.0% -1.0% 1.0% 3.0% Jan-13 Feb-13 Mar-13 Apr-13 GOLDLNPM Index
  • 3. Prime Brokerage Global Hedge Fund Trends – Performance, Leverage, and Risk Exposures 3  This material is provided by J.P. Morgan’s Prime Brokerage business for informational purposes only. It is not a product of J.P. Morgan’s Research Departments. For Institutional Investors only. For the intended recipient only. The reference period for this publication is April 2013 unless otherwise stated.  exceeded earnings per share expectations, which is in line with trend. Energy and industrials sectors, which declined - 0.88% and -0.84%,4 respectively, offset gains in other sectors, particularly telecommunications (+5.99%) and utilities (+5.89%), which outperformed. Weakness in the energy and industrials sectors may reflect slowing growth rates, which were captured in the sagging manufacturing PMIs. Figure 4: Sector performance, April 2013 Source: Standard & Poor’s, Bloomberg April seemed to mark a growing divergence between equity markets on one hand, which continued their year-to-date gains, and underlying economic data on the other hand, which sent negative signals. In addition to declining output PMIs in the U.S., the Euro zone and China, the global manufacturing PMI is now in negative territory – a bearish indicator for cyclical sectors. The continued rise in equity markets is therefore not a reaction to positive signs regarding economic growth. Instead, it appears that share buyback activity is helping to support equity markets to a significant extent. As Figure 5 shows, share buyback activity year-to- date is comparable to the highs reached in the same periods in 2007, 2007 and 2011. 4 Based on S&P 500 Energy Index and S&P 500 Industrials Index. Figure 5: Global share announced buybacks in first four months of the year ($billion) Source: ThomsonOne, J.P. Morgan Global Markets Outlook and Strategy 5.99% 5.89% 2.93% 2.90% 2.79% 2.69% 0.83% 0.55% -0.84% -0.88% -1.0% 0.0% 1.0% 2.0% 3.0% 4.0% 5.0% 6.0% 7.0% 0 50 100 150 200 250 300 02 03 04 05 06 07 08 09 10 11 12 13
  • 4. Prime Brokerage Global Hedge Fund Trends – Performance, Leverage, and Risk Exposures 4  This material is provided by J.P. Morgan’s Prime Brokerage business for informational purposes only. It is not a product of J.P. Morgan’s Research Departments. For Institutional Investors only. For the intended recipient only. The reference period for this publication is April 2013 unless otherwise stated. Leverage and Risk Exposures Gross Leverage There was a modest uptick in risk appetite towards month- end once volatility subsided after having notched up during the middle of April. For all accounts in the Prime Brokerage portfolio, gross leverage rose from 1.88 to 1.89 (+0.5%) (See Figure 6). Gross leverage of levered accounts in the Prime Brokerage portfolio fell from 2.57 to 2.49 (-2.9%) (See Figure 7). The divergence in gross leverage between levered accounts and all accounts is typical during risk-on environments. During such periods, a greater number of clients run leverage, including those that opportunistically do so at lower levels, which causes the average among levered accounts to be skewed lower. Figure 6: Daily gross leverage and the S&P 500 Index Source: Bloomberg, J.P. Morgan Prime Brokerage Figure 7: Gross leverage (levered accounts) 5-day moving average and the S&P 500 Index Source: Bloomberg, J.P. Morgan Prime Brokerage Figure 8: Z-score of gross leverage and the S&P 500 Index  The Z-score measures how many standard deviations an observation is above or below the mean Source: Bloomberg, J.P. Morgan Prime Brokerage Gross Leverage by Strategy Gross leverage rose for Equity Long Short (+6.3%) in April while Convertible Arbitrage and High Grade Fixed Income fell -5.9% and -9.0%, respectively. An uptick in leverage for equity-biased strategies is in line with the historical trend alongside earnings season. As in March, all strategies are running leverage at or above their 2-year averages except for High Grade Fixed Income. Figure 9: Gross leverage by strategy Source: J.P. Morgan Prime Brokerage 1.75 1.80 1.85 1.90 1.95 1,250 1,300 1,350 1,400 1,450 1,500 1,550 1,600 May-12 Jul-12 Sep-12 Nov-12 Jan-13 Mar-13 S&P 500 Index (LHS) Gross Leverage (RHS) 2.4 2.5 2.6 2.7 1,250 1,300 1,350 1,400 1,450 1,500 1,550 1,600 May-12 Jul-12 Sep-12 Nov-12 Jan-13 Mar-13 S&P 500 Index (LHS) Gross Leverage (Levered Accounts - RHS) -1.3 0.0 1.3 May-11 Sep-11 Jan-12 May-12 Sep-12 Jan-13 Difference between gross leverage and S&P 500 Index Z-scores 0 1 2 3 4 5 Market Neutral Equity Long Short Multi-Strategy Convertible Arbitrage High Grade Fixed Income High Yield Fixed Income Feb-13 Mar-13 Apr-13
  • 5. Prime Brokerage Global Hedge Fund Trends – Performance, Leverage, and Risk Exposures 5  This material is provided by J.P. Morgan’s Prime Brokerage business for informational purposes only. It is not a product of J.P. Morgan’s Research Departments. For Institutional Investors only. For the intended recipient only. The reference period for this publication is April 2013 unless otherwise stated.  Table 2: Gross leverage by strategy Average and first quartile calculated for the period of April 2011 to April 2013 Source: J.P. Morgan Prime Brokerage Net Exposure and Net Leverage Net exposure for equity-biased funds rose from 0.69 to 0.75 (+7.9%) in April and net leverage increased from 0.63 to 0.68 (+7.4%). Higher exposures and net leverage are reflective of an uptick in bullishness and risk appetite among equity- centric managers. Figure 10: Net exposure and net leverage Equity Long Short and Market Neutral funds on the Prime Brokerage platform only. LMV: Market value of long positions. SMV: Market value of short positions. Eq: Equity in the clients’ accounts Source: J.P. Morgan Prime Brokerage Sector Exposures There was a general increase in long exposures during April, reflecting incremental bullishness. There were increases in the long Prime Brokerage portfolio month-over-month in the Financial (+0.6%), Consumer, Cyclical (+0.5%), and Technology (+0.5%) sectors. The largest declines occurred in the Non sector-specific ETF (-2.1%) and Basic Materials (- 0.4%) sectors. The largest increases in the Prime Brokerage short portfolio were in the Energy (+0.8%) and Technology (+0.6%) sectors. The most substantial decreases in short exposure occurred with respect to the Non sector-specific ETF (-0.7%) and Industrial (-0.6%) sectors. Month-over-month, changes in sector exposures may indicate that the Prime Brokerage portfolio has become more bullish on the Consumer, Non-cyclical, Financial and Industrial sectors, for which there were noticeable increases in long exposure and declines in short exposure. Table 3: Long and short exposures by sector Long (Short) exposure by sector as a percentage of total client long (short) exposure in Prime Brokerage portfolio Long exposure Short exposure Apr-12 Mar-13 Apr-13 Apr-12 Mar-13 Apr-13 Basic Materials 5.6% 5.0% 4.6% 4.5% 5.5% 5.4% Communications 11.9% 14.5% 14.4% 6.5% 7.0% 6.7% Consumer, Cyclical 11.4% 10.9% 11.4% 8.6% 8.0% 8.2% Consumer, Non- cyclical 15.0% 15.2% 15.3% 10.0% 11.3% 11.1% Diversified 0.3% 0.3% 0.3% 0.1% 0.0% 0.0% Energy 9.3% 8.8% 9.1% 6.7% 6.3% 7.1% Non sector-specific ETF 3.1% 4.1% 2.0% 15.6% 16.1% 15.4% Financial 19.0% 17.5% 18.1% 11.8% 11.0% 10.9% Industrial 6.5% 6.1% 6.4% 5.8% 7.0% 6.4% Technology 5.3% 4.2% 4.7% 5.4% 7.1% 7.7% Utilities 1.6% 1.1% 1.2% 1.4% 1.9% 1.8% Government 5.4% 6.8% 7.2% 15.3% 7.3% 7.2% Other 5.6% 5.6% 5.4% 8.2% 11.5% 12.1% Source: J.P. Morgan Prime Brokerage Feb-13 Mar-13 Apr-13 Average First Quartile % Change Market Neutral 4.47 4.34 4.25 3.82 3.54 -2.1% Equity Long Short 1.94 1.94 2.06 1.82 1.72 6.3% Multi-Strategy 1.79 1.78 1.80 1.78 1.76 0.8% Convertible Arbitrage 4.29 4.52 4.25 3.67 3.47 -5.9% High Grade Fixed Income 2.06 2.24 2.04 2.59 2.38 -9.0% High Yield Fixed Income 1.42 1.42 1.44 1.22 1.16 1.4% PB Portfolio (Levered Accounts) 2.59 2.57 2.49 2.52 2.48 -2.9% 0.4 0.7 1.0 1.3 Apr-11 Aug-11 Dec-11 Apr-12 Aug-12 Dec-12 Apr-13 Net Exposure (LMV/SMV)-1 Net Leverage (LMV-SMV)/Eq
  • 6. Prime Brokerage Global Hedge Fund Trends – Securities Lending 6  This material is provided by J.P. Morgan’s Prime Brokerage business for informational purposes only. It is not a product of J.P. Morgan’s Research Departments. For Institutional Investors only. For the intended recipient only. The reference period for this publication is April 2013 unless otherwise stated.  North America Securities Lending Equities Market participants remained hesitant to add short exposures in the face of the ongoing equities rally, which resulted in a third consecutive month of net covering across the U.S. short book. Equities drove activity in April as investors focused on first quarter earnings. Fixed income activity was also skewed towards covering, while ETFs bucked the trend with a solid month of shorting. In a sign of higher overall engagement, gross volume was up by more than 20% month-over-month. From a sector perspective, the strongest covering occurred in the Communications, Consumer Cyclical and Industrial sectors, while Technology and Energy led short activity. ETFs As the lone asset class net shorted for the month, ETF short activity was heavily index-focused on IWM (iShares Russell 2000 Index Fund) and MDY (SPDR S&P MidCap 400 ETF), with one notable sector play in XLE (Energy Select Sector SPDR). Covering in SPY (SPDR S&P 500) and QQQ (PowerShares QQQ Trust, Series 1) ran contrary to the overall trend, with further sector ETF covering across retail and technology. Japanese and fixed income ETFs lead with respect to creation inflows, while emerging markets ETFs experienced the largest outflows. Event Driven Provident New York Bancorp (PBNY) and Sterling Bancorp (STL) agreed to merge in a stock–for–stock transaction announced in early April. Sterling shareholders will receive 1.2625 shares of Provident and will ultimately own approximately 47% of the combined company. Provident short interest is relatively unchanged since news of the merger broke, while borrow is available at close to GC rates. The transaction is expected to be completed by year-end. General Electric (GE) agreed to acquire Lufkin Industries (LUFK) in an all cash transaction totaling $3.3 billion. Lufkin shareholders will receive $88.50 per share and the transaction is expected to close by the end of 2013. Interest in Lufkin borrow has been relatively light. Lufkin borrow remains plentiful at GC levels. Dish Network (DISH) announced an offer to acquire Sprint Nextel Corp (S) for $7.00 per share, $4.76 of which will be cash; the remainder will be in stock. Dish is now competing with Softbank Corp’s (9984 JP) offer from October 2012. Short interest in Sprint shares has been on the rise in recent weeks but borrow is readily available at GC rates. Fixed Income The Prime Brokerage fixed income short book was net covered for a third consecutive month. Only two sectors – basic materials and energy – saw an increase in the net market value of shorts. However, with Treasury yields nearing their lowest levels of the past nine months, there was a substantial increase in Treasury shorts with a heavy concentration in the 10-year. J.P. Morgan is now forecasting that yields on the 10-year will begin to rise towards 2%. Accordingly, activity around Treasuries in the Prime Brokerage book is likely to continue. Convertibles remain active in event driven credits; Lam Research (LRCX), Newmont Mining (NEM) and Priceline (PCLN) all continue to see strong flows. In high yield, coal mining, basic materials and energy names continue to garner strong interest. Most of the Prime Brokerage flows with respect to high grade have been concentrated in credits with exposure to headline risk. Active names include Arch Coal Inc. (ACI), AK Steel (AKS), Alpha Natural Resources (ANR), Dell Inc. (DELL), Cliff Natural Resources Inc. (CLF), J.C. Penney (JCP) and United States Steel Corp (X).
  • 7. Prime Brokerage Global Hedge Fund Trends – Securities Lending 7  This material is provided by J.P. Morgan’s Prime Brokerage business for informational purposes only. It is not a product of J.P. Morgan’s Research Departments. For Institutional Investors only. For the intended recipient only. The reference period for this publication is April 2013 unless otherwise stated.  Figure 11: Cumulative net activity Market value change of activity across equities, ETFs, and fixed income Source: J.P. Morgan Securities Lending Figure 12: Rolling 1-month daily short flow Daily Activity Relative to 30-Day Average (LHS) and S&P 500 Index (RHS) Source: Bloomberg, J.P. Morgan Securities Lending Table 4: U.S. securities lending trends by sector For the month of April 2013 5 Day 30 Day 90 Day Price Change Position Change (shares) Price Change Position Change (shares) Price Change Position Change (shares) Consumer, Non-cyclical 0.3% -0.6% 2.3% -2.3% 9.7% -6.7% Financial 2.0% 1.1% 2.0% -1.5% 7.8% -5.8% Technology 4.5% -1.5% -1.9% 22.0% -1.3% 27.1% Energy 2.7% -1.3% -2.4% -0.4% 1.5% 1.6% Communications 0.6% -0.6% 2.0% -7.1% 6.3% 0.1% Industrial 2.3% -1.0% -2.2% -6.8% 1.9% -2.2% Consumer, Cyclical 3.1% -1.1% 4.6% -5.4% 10.6% -8.5% Basic Materials 5.4% 0.4% -0.7% 6.0% -9.3% 14.6% Utilities 1.3% -3.5% 5.2% -11.1% 13.4% -19.2% Source: J.P. Morgan Securities Lending Table 5: U.S. securities lending trends by ETFs For the month of April 2013 5 Day 30 Day 90 Day Price Change Position Change (shares) Price Change Position Change (shares) Price Change Position Change (shares) SPDR S&P 500 ETF TRUST 1.2% -1.6% 1.9% -6.9% 7.0% 28.9% ISHARES RUSSELL 2000 1.9% 7.8% -0.3% 23.5% 5.3% 10.0% ENERGY SELECT SECTOR SPDR 2.7% 0.0% -1.1% 30.4% 3.0% 18.2% ISHARES MSCI EMERGING MARKETS INDEX 3.2% 82.5% 1.0% 73.5% -1.4% 51.6% ISHARES IBOXX H/Y CORP BOND 1.0% -10.6% 1.8% -8.9% 0.8% -4.5% FINANCIAL SELECT SECTOR SPDR 1.6% 13.6% 2.6% 9.5% 7.6% 58.4% INDUSTRIAL SELECT SECTOR SPDR 1.8% -0.6% -0.9% -8.8% 3.1% 38.5% MARKET VECTORS OIL SERVICE 3.9% -10.9% -0.4% 106.8% 0.7% 303.7% CONSUMER STAPLES SPDR -1.2% -4.1% 2.9% 10.5% 12.0% -15.8% SPDR BARCLAYS HIGH YIELD BOND 0.8% -11.2% 1.5% -4.4% 0.4% 83.8% Source: J.P. Morgan Securities Lending ‐$10.0 ‐$8.0 ‐$6.0 ‐$4.0 ‐$2.0 $0.0 $2.0 $4.0 $6.0 $8.0 1-May 31-May 30-Jun 30-Jul 29-Aug 28-Sep 28-Oct 27-Nov 27-Dec 26-Jan 25-Feb 27-Mar 26-Apr Equity ETF Fixed Income Net Activity 1,500 1,525 1,550 1,575 1,600 -300% -200% -100% 0% 100% 200% 300% 01-Apr 08-Apr 15-Apr 22-Apr 29-Apr Net Cover Activity (LHS) Net Short Activity (LHS) S&P 500 Index (RHS)
  • 8. Prime Brokerage Global Hedge Fund Trends – Securities Lending 8  This material is provided by J.P. Morgan’s Prime Brokerage business for informational purposes only. It is not a product of J.P. Morgan’s Research Departments. For Institutional Investors only. For the intended recipient only. The reference period for this publication is April 2013 unless otherwise stated.  International Securities Lending EMEA As in prior months, capital raising events were the main driver for borrow demand in April. There was significant interest in Commerzbank AG (CBK GY), Koninklijke KPN N.V. (KPN NA), Bankia SA (BKIA SM) and Meyer Burger Technology AG (MBTN SW). The spread for the Koninklijke rights arbitrage grew sufficiently wide to drive borrow rates higher, with lenders looking for re-rates. There has been significant recall activity for Bankia, an already crowded borrow. Its stock price therefore spiked during the rights trading period. The same is true for Meyer Burger for which there have been heavy recalls and re-rates. That was especially true once the stock began trading ex dividend rights. In April, Kier Group Plc (KIE LN) announced its proposed acquisition of May Gurney Integrated Services Plc (MAYG LN). Borrow for Kier Group subsequently spiked to 4%. With respect to flows, there has been considerable interest in Banca Monte dei Paschi di Siena (BMPS IM) for which borrow tightened in April as lenders saw large sales and subsequently recalled. There were also significant recalls for BMPS in anticipation of the annual general meeting (AGM). Interest also was heavy in Norsk Hydro ASA (NHY NO) as local lenders recalled stock for the AGM, thus putting upward pressure on the borrow rate. Hedge funds also sought borrow in April to increase their short exposure and maintain excess to protect existing shorts. Finally, the Glencore/Xstrata merger is now complete. Consequently, the Prime Brokerage book is seeing borrow at GC rates. Asia Pacific Ex-Japan Korea As in March, flows remained light in Korea. April saw renewed demand for Apple-related names. There was an uptick in short interest for LG Display Co. Ltd (034220 KS) and Hynix Semiconductor Inc. (000660 KS). Both names remain highly liquid. Taiwan Onshore recalls continued into April as a result of impending AGM dates. Borrow for stocks with mid-March record dates returned to the market, which freed up some liquidity. HTC Corp. (2498 TW) remains a top short after having missed earnings expectations. However, hedge funds sought to avoid onshore supply given that it will be recalled again this year for an impending dividend record date. As in Korea, there was a focus on Apple-related plays, including heightened demand for Largan Precision Co. Ltd. (3008 TW) and Catcher Technology Co. Ltd. (2474 TW). Singapore Demand picked up in April after several months of lighter activity. Fraser and Neave Ltd. (F99) generated significant interest after the announcement that it would be removed from the MSCI. Demand also picked up in the shipping sector, with Sembcorp Marine Ltd. (SMM) leading the way. While borrow for Sembcorp historically has been liquid, heightened demand caused liquidity to tighten, with fees moving north of 1%. Hong Kong ETFs again lead the way among short names. Sports apparel makers lead the way among single names following a year- long trend as hedge funds have been scouring the consumer sector for underperformance. Li Ning Co. Ltd. (2331 HK), which recently was deleted from the MSCI, and Anta Sports (2020 HK) were the top locates. Investors also are looking at shorts among Chinese financials. Along those lines, interest in China Minsheng Bank (1988 HK) increased through April. Japan The Nikkei continued its strong rally in April, ending +11.7% month-over-month. Clients continued to unwind short positions owing to continued market strength. The Nikkei plateaued in mid-April, which caused a number of hedge funds to increase short positions opportunistically. For example, there was strong interest in automobile names, including Mazda Motor (7261 JP), Nissan (7201 JP) and Suzuki (7267 JP). In the real estate sector, short interest rose for Sekisui House (1928 JP) and Daiwa Office (8976 JP). Among financials, there was heightened demand for consumer finance-related names such as Aiful (8515 JP) and Acom (8572 JP) along with banks such as Mitsubishi UJF (8316 JP) and Sumitomo Mitsui Financial (8316JP). Finally, demand was acute for smartphone game-related Gungho (3765 JP) and Colopl (3668 JP). Australia A bearish outlook on rare earth materials prices caused an uptick in demand for Lynas Corp. Ltd. (LYC AU) at the start of April. Headlines out of China and Europe regarding potential competitive threats put Cochlear (COH) in the crosshairs of shortsellers. Weakness in gold prices drove demand for Newcrest Mining Ltd. (NCM AU). Cutbacks in
  • 9. Prime Brokerage Global Hedge Fund Trends – Securities Lending 9  This material is provided by J.P. Morgan’s Prime Brokerage business for informational purposes only. It is not a product of J.P. Morgan’s Research Departments. For Institutional Investors only. For the intended recipient only. The reference period for this publication is April 2013 unless otherwise stated.  capex among mining companies drove increased interest for ALS Ltd (ALQ AU), Ausdrill Ltd. (ASL AU) and Worley Parsons Ltd. (WOR). Rio Tinto Ltd. (RIO AU) borrow was taken down in substantial size as the spread between the AU and LN listings diverged, providing opportunity for relative value investors. Prices for thermal coal continued their slide as a result of which demand for producer Whitehaven Coal Ltd. (WHC AU) spiked because of mounting short interest.
  • 10. Prime Brokerage Global Hedge Fund Trends – Institutional Investor Sentiment 10  This material is provided by J.P. Morgan’s Prime Brokerage business for informational purposes only. It is not a product of J.P. Morgan’s Research Departments. For Institutional Investors only. For the intended recipient only. The reference period for this publication is April 2013 unless otherwise stated. Institutional Investor Sentiment North America In general, many investors seem to be on hold with respect to new allocations, as they have done significant work over the last 18 months and are now allowing their existing portfolios to season. Correspondingly, the bar for investors to add new allocations is currently very high. In April, the Capital Introduction Group (CIG) held investor meetings in North Carolina, Portland, Dallas and Los Angeles. In North Carolina, investors are on hold with respect to new allocations, as several groups are in the process of concentrating their portfolios. Investors in Dallas were interested in learning about new launches, but solely for informational purposes. In Portland, CIG met with several regional consultants among which equity long short strategies are currently in favor. While interest in new launches among those allocators was keen, early-stage investing is rare for this group. In Los Angeles, finally, investors are more interested in fundamental strategies than systematic strategies. Several allocators expressed a preference for smaller managers, albeit with fee discounts and via separate accounts. Consultants In an effort to differentiate themselves, several consultants are beginning to look further down the AUM spectrum and consider emerging managers. Funds of Hedge Funds (FoFs) Among larger FoFs, interest in credit is declining, as equity- biased strategies are now in favor, including lower net and activist managers. Endowments & Foundations (E&Fs) Long short and event driven equities are of primary interest among E&Fs. Global macro is of secondary interest. Certain Tri-State area E&Fs are taking a pause with respect to new investments, as those groups are giving recent allocations time to season. Other Strategies of Interest CIG has received several requests regarding women- and minority-owned managers, socially responsible funds, reinsurance and longer-duration vehicles. EMEA Several European investors have made inquiries regarding “differentiated” equity strategies, including managers with longer-biased, concentrated portfolios and uncorrelated, trading-oriented equity funds. It should be noted though, that new allocation activity among European investors remains muted. Interest in structured credit continues to wane. Generally, European investors are not making any new allocations to this strategy and some investors are reducing such allocations. Several European investors, primarily FoFs and private banks, report that outflows have abated. Certain of those allocators have even started to see inflows. Asia Pacific Investor interest in equity-biased, directional strategies is on the rise. Interest in structured credit among Asia Pacific- based investors also is increasing. There has also been an uptick in interest in Asia-based managers from consultants’ clients in the region. Accordingly, consultants’ Asian offices have started to increase staffing for local hedge fund research. Investors continue to seek out strategies that can provide uncorrelated alpha. Notably, Albourne Partners’ Open Protocol Risk Aggregation system was endorsed by the Australian Prudential Regulatory Authority (APRA). Albourne’s system for reporting hedge fund holdings may therefore become more widely adopted in Australia as the Stronger Super reforms are rolled out across the country. Table 6: Investor strategies of interest by region5 Americas Europe Asia-Pacific Direction of Interest Level of Interest Direction of Interest Level of Interest Direction of Interest Level of Interest Convertible Arbitrage Neutral Neutral Neutral Distressed Neutral Neutral Neutral Equity Long Short Increasing Increasing Increasing Event Driven Increasing Increasing Neutral Macro Neutral Neutral Decreasing CTA Decreasing Neutral Neutral Market Neutral Neutral Neutral Increasing Structured Credit Decreasing Neutral Increasing Legend Low Interest Medium Interest High Interest Source: J.P. Morgan Capital Introduction Group 5 This information comes from CIG conference calls and meetings with global hedge fund managers and institutional investors. This table represents views of the CIG team and may not be completely exhaustive.
  • 11. Prime Brokerage Global Hedge Fund Trends – Market Perspectives 11  This material is provided by J.P. Morgan’s Prime Brokerage business for informational purposes only. It is not a product of J.P. Morgan’s Research Departments. For Institutional Investors only. For the intended recipient only. The reference period for this publication is April 2013 unless otherwise stated. April Commentary Although April delivered some disappointing economic news, a number of data points emerged that bode well for growth in the U.S. (and, by extension, the global economy). For example, private final sales rose at an annualized rate of +3.3% and new home sales increased by another +1.5% in March. House prices are running 7% to 11% above their levels from a year ago as the recovery in residential real estate continues. The inventory of existing homes for sale, a key variable impacting house prices, remains close to housing boom-era lows. Home price appreciation is therefore likely to continue. The unemployment report for April also delivered positive news with 165,000 nonfarm payrolls created, which caused the unemployment rate to drop to 7.5%, its lowest level since the financial crisis. Additionally, real consumer spending rose at a robust +3.2% during the first quarter. However, real GDP rose at an annualized rate of only 2.5% in the first quarter. While that pace was much improved from the fourth quarter’s anemic 0.4%, it nonetheless fell below expectations by roughly half a percentage point. Earlier in the year6 , we noted that government cutbacks could exert a drag on growth, which is now occurring. During the first quarter, government spending contracted by -4.1%. Defense spending fell by a much steeper -11.5% over the same period. While predictions that sequestration would throw the economy into a tailspin fortunately failed to materialize (particularly for commercial air travelers), the pullback in federal outlays is serving as an unmistakable weight on the heels of what remains a tepid recovery. Despite the sclerosis in Washington, a consensus seems to have congealed among policymakers that federal spending should be curtailed to reduce the deficit in both the short run and over the long term. It seems, therefore, that government will continue to exert a drag on growth in the coming years, potentially blunting the recovery. The following sections are excerpts from J.P. Morgan Research publications. The full publications can be accessed via the sources provided in the footnotes below. 6 J.P. Morgan Prime Brokerage, Global Hedge Fund Trends, March 12, 2013. Key Currency Views: April 2013 7 The aggressive monetary easing by the BoJ is expected to push the yen lower through (1) lower nominal JGB yields via aggressive JGB purchases, and (2) higher inflation expectation due to their strong commitment to a 2% inflation target. In theory, the combination of lower nominal rates and higher inflation expectation means Japan’s real interest rates would move much lower, resulting in a weaker JPY. The US- Japan real interest rate differential, which is calculated using actual inflation rates in the US and Japan, has had a good correlation with USD/JPY. This correlation suggests that if the market prices in 2% inflation in Japan, USD/JPY could appreciate to around 105. Before the BoJ announced aggressive easing on April 4, we had thought that it unlikely that the market would price in 2% inflation, and thus unlikely that USD/JPY would rally significantly above 100. However, after the aggressive easing on April 4th, the possibility that the market prices in 2% inflation seems to have heightened. Unprecedented monetary easing by the BoJ is expected to push long-end JGB yields lower (our JGB strategists expect 10y JGB yield to decline to 0.25% in coming months). This has heightened speculation that Japanese investors will be forced to eventually shift their money abroad, as domestic investment conditions will become difficult given the super low yields. W e are skeptical about this narration and believe that even if this materializes, FX impact would remain uncertain as lower JGB yields should make FX-hedged foreign bond investments more attractive. However, it’s likely that this speculation will weigh on JPY for a while. Global Data Watch: EM Corporates Seem Sluggish8 The global economy is in transition. Growth has picked up from a low base as drags from tightening credit outside the US fade, easy money gains traction, and the removal of significant tail risks bolsters sentiment. However, the damage from a prolonged period of subpar growth lingers in the form of a corporate margin squeeze. In addition, the phase of an intense developed market fiscal adjustment that began last year is continuing as the US is now absorbing a substantial fiscal drag. If we are right, these conflicting forces will allow a choppy return to trend growth to continue. To be sure, the latest news has been disappointing and the risks to our current-quarter global GDP forecast of 2.7% (trend is 3%) 7 J.P. Morgan Global FX Strategy, Key Currency Views: April 2013, April 19, 2013, J.P. Morgan Markets, https://jpmm.com/research/content/GPS-1099959-0. 8 J.P. Morgan Economic Research, Global Data Watch, April 26, 2013, J.P. Morgan Markets, https://jpmm.com/research/content/GPS-1107480-0.
  • 12. Prime Brokerage Global Hedge Fund Trends – Market Perspectives 12  This material is provided by J.P. Morgan’s Prime Brokerage business for informational purposes only. It is not a product of J.P. Morgan’s Research Departments. For Institutional Investors only. For the intended recipient only. The reference period for this publication is April 2013 unless otherwise stated.  have shifted to the downside. However, we do not see tail risks on the horizon and the underlying dynamic in place—of supportive monetary policies, healing credit markets, and soon-to-fade fiscal drags—remains consistent with a gradual transition to stronger growth Most notable in the recent news is the downshift in the industrial sector. A rebound in manufacturing output and business surveys at the start of the year does not appear to be delivering the above-trend 1Q GDP signaled by our nowcast. And while we have been looking for growth momentum to wane, the message from the April surveys is weak. Flash manufacturing PMI readings were lower than expected in the US, China, and the Euro area and suggest that global manufacturing output might be stalling. A sharp up-and- down swing in global industry is not a particular concern given the volatility in inventory behavior in recent years, but the drop in the orders-to-inventory ratio in the flash PMIs raises concern that final demand growth is growing more slowly than anticipated. There is limited information available regarding the composition of final demand growth last quarter, but we believe that sluggish EM business spending is the main source of disappointment. We have been highlighting the damaging combination of subpar global growth and weakening pricing power in goods industries for EM profit margins—particularly as labor costs continue to rise at a rapid pace. Investment spending has been sluggish in recent quarters—in absolute terms and relative to consumer demand—and does not appear to be lifting during 1H13 as we had expected. Weaker-than-expected manufacturing sector investment and stockbuilding contributed to last quarter’s growth disappointment in China, and we expect this pattern will be evident in GDP releases across the EM more broadly. It would be wrong to expect a quick rebound in EM business spending. The latest IIF survey of EM bank lending officers, conducted from mid-March through mid-April, found that a modest net majority of EM banks continue to tighten credit standards. However, the survey also suggests that the pressure to tighten is easing. Banks no longer perceive funding conditions as tight and a significant rise in NPLs appears to be leveling off. This improvement, if sustained, should give banks an incentive to stop tightening standards. Europe’s future will be shaped by politics in the South9 European crisis management is centered on the principle of conditionality—the application of macroeconomic adjustment by debtor countries in return for access to external support. The German government’s commitment that there will be “no liability without control” has become Europe’s guiding political maxim; an inter-state equivalent of “no taxation without representation.” This approach has become clearer than ever in the post-Cyprus world (see A. White, The Importance of a Germany that can say no). The difficulty with this approach, in our view, is that it assumes that the debtor countries have the institutional capacity to consistently implement their side of the bargain. It also assumes that the general public in the debtor countries shares the same political and normative values as Germany and the European North (or can be persuaded to acquiesce to them) in a way that will embed the prevailing approach to the management of EMU. In reality, both assumptions are questionable, in our opinion. Near term, the constitutional and political settlement in the South has created impediments to the implementation of fiscal restraint. The region has demonstrated its capacity to address this through the use of various “work-arounds,” including the imposition of technocratic administrations and rule by decree (both of which have proved deeply unpopular). This approach appears to have been partly successful in delivering greater fiscal consolidation in the short term. In the medium term, however, the southern economies will likely need to embrace deeper structural reform if they are to deliver sustained growth. This will likely require a degree of political commitment that goes beyond what is achievable through the work-around approach. Finally, in the long term, we believe the South will need to internalize a vision of Euro area management (EMU Mark II) that is largely based on northern European precepts. Without this, in our view, a broader clash of approaches to EMU will be hard to avoid (the German view is that domestic dysfunction within the periphery must be addressed before more substantive integration can occur). The recent intervention by the Portuguese Constitutional Court, which threw out aspects of the 2013 Budget, is a case in point. In our view, the near-term solution is for the Portuguese government to prepare additional measures that 9 J.P. Morgan Economic and Policy Research, Economic Research Note, April 26, 2013, J.P. Morgan Markets, https://jpmm.com/research/content/GPS-1106830-0.
  • 13. Prime Brokerage Global Hedge Fund Trends – Market Perspectives 13  This material is provided by J.P. Morgan’s Prime Brokerage business for informational purposes only. It is not a product of J.P. Morgan’s Research Departments. For Institutional Investors only. For the intended recipient only. The reference period for this publication is April 2013 unless otherwise stated.  meet the requirements of its assistance program and are compatible with its constitution. Longer term, we believe Portugal needs to ensure that its constitutional settlement and the requirements of EMU membership—as well as broader fiscal realities—are not in conflict. The European South still has a long political journey ahead of it, and we expect its response will shape the region’s future in the short, medium, and long term.
  • 14. Important Information and Disclaimers 14  This material is provided by J.P. Morgan’s Prime Brokerage business for informational purposes only. It is not a product of J.P. Morgan’s Research Departments. For Institutional Investors only. For the intended recipient only. The reference period for this publication is April 2013 unless otherwise stated. This material (“Material”) is provided by J.P. Morgan’s Prime Brokerage business for informational purposes only. It is not a product of J.P. Morgan’s Research Departments. This Material includes data and viewpoints from various departments and businesses within JPMorgan Chase & Co., as well as from third parties unaffiliated with JPMorgan Chase & Co. and its subsidiaries. The generalized hedge fund and institutional investor information presented in this Material, including trends referred to herein, are not intended to be representative of the hedge fund and institutional investor communities at large. This Material is provided directly to professional and institutional investors and is not intended for nor may it be provided to retail clients. This Material has not been verified for accuracy or completeness by JPMorgan Chase & Co. or by any of its subsidiaries, affiliates, successors, assigns, agents, or by any of their respective officers, directors, employees, agents or advisers (collectively, “JPMorgan”), and JPMorgan does not guarantee this Material in any respect, including but not limited to, its accuracy, completeness or timeliness. Information for this Material was collected and compiled during the stated timeframe, if applicable. Past performance is not a guarantee of future results. JPMorgan has no obligation to update any portion of this Material. This Material may not be relied upon as definitive, and shall not form the basis of any decisions. It is the user’s responsibility to independently confirm the information presented in this Material, and to obtain any other information deemed relevant to any decision made in connection with the subject matter contained in this Material. Users of this Material are encouraged to seek their own professional experts as they deem appropriate including, but not limited to, tax, financial, legal, investment or equivalent advisers, in relation to the subject matter covered by this Material. JPMorgan makes no representations (and to the extent permitted by law, all implied warranties and representations are hereby excluded), and JPMorgan takes no responsibility for the information presented in this Material. This Material is provided for informational purposes only and for the intended users’ use only, and no portion of this Material may be reproduced or distributed for any purpose without the express written permission of JPMorgan. The provision of this Material does not constitute, and shall not be construed as constituting or be deemed to constitute, a solicitation of, or offer or inducement to provide or carry on, any type of investment service or activity by JPMorgan. Under all applicable laws, including, but not limited to, the US Employee Retirement Income Security Act of 1974, as amended, or the US Internal Revenue Code of 1986 or the Financial Services and Markets Act 2000 (Regulated Activities) Order 2001, as amended, no portion of this Material shall constitute, or be construed as constituting or be deemed to constitute “investment advice” for any purpose, and JPMorgan shall not be considered as a fiduciary of any person or institution for any purpose in relation to Material. This Material shall not be construed as constituting or be deemed to constitute an invitation to treat in respect of, an offer or a solicitation of an offer to buy or sell any securities or constitute advice to buy or sell any security. This Material is not intended as tax, legal, financial or equivalent advice and should not be regarded or used as such. The Material should not be relied upon for compliance. An investment in a hedge fund is speculative and involves a high degree of risk, which each investor must carefully consider. Returns generated from an investment in a hedge fund may not adequately compensate investors for the business and financial risks assumed. An investor in hedge funds could lose all or a substantial amount of its investment. While hedge funds are subject to market risks common to other types of investments, including market volatility, hedge funds employ certain trading techniques, such as the use of leveraging and other speculative investment practices that may increase the risk of investment loss. Other risks associated with hedge fund investments include, but are not limited to, the fact that hedge funds: can be highly illiquid; are not required to provide periodic pricing or valuation information to investors; may involve complex tax structures and delays in distributing important tax information; are not subject to the same regulatory requirements as mutual funds; often charge higher fees and the high fees may offset the fund’s trading profits; may have a limited operating history; can have performance that is volatile; may have a fund manager who has total trading authority over the fund and the use of a single adviser applying generally similar trading programs could mean a lack of diversification, and consequentially, higher risk; may not have a secondary market for an investor’s interest in the fund and none may be expected to develop; may have restrictions on transferring interests in the fund; and may affect a substantial portion of its trades on foreign exchanges. JPMorgan may (as agent or principal) have positions (long or short), effect transactions or make markets in securities or financial instruments mentioned herein (or derivatives with respect thereto), or provide advice or loans to, or participate in the underwriting or restructuring of the obligations of, issuers mentioned herein. JPMorgan may engage in transactions in a manner inconsistent with the views discussed herein. © 2013 JPMorgan Chase & Co. All rights reserved. All product names, company names and logos mentioned herein are trademarks or registered trademarks of their respective owners. Access to financial products and execution services is offered through J.P. Morgan Securities LLC (“JPMS”) and J.P. Morgan Securities plc (“JPMS plc”). Clearing, prime brokerage and custody services are provided by J.P. Morgan Clearing Corp. (“JPMCC”) in the US and JPMS plc in the UK. JPMS and JPMCC are separately registered US broker dealer affiliates of JPMorgan Chase & Co., and are each members of FINRA, NYSE and SIPC. JPMS plc is authorized by the Prudential Regulation Authority and regulated by the Financial Conduct Authority and the Prudential Regulation Authority in the UK. J.P. Morgan Securities (Asia Pacific) Limited is regulated by the HKMA. Contact Us: Alessandra Tocco Alessandra.Tocco@jpmorgan.com 212-272-9132 Kenny King, CFA Kenny.King@jpmorgan.com 212-622-5043 Christopher M. Evans c.m.evans@jpmorgan.com 212-622-5693 Stacy Bartolomeo Stacy.Bartolomeo@jpmorgan.com 212-272-3471 Elizabeth Drumm Elizabeth.H.Drumm@jpmorgan.com 212-272-2642